Do the regional numbers include all downloads, or just the ones using wget/uclient-fetch without version number? If it's all of them then they include a lot more legitimate downloads in Barcelona and Madrid than in the Bilbao and Burgos areas.
Some comments regarding the statistics:
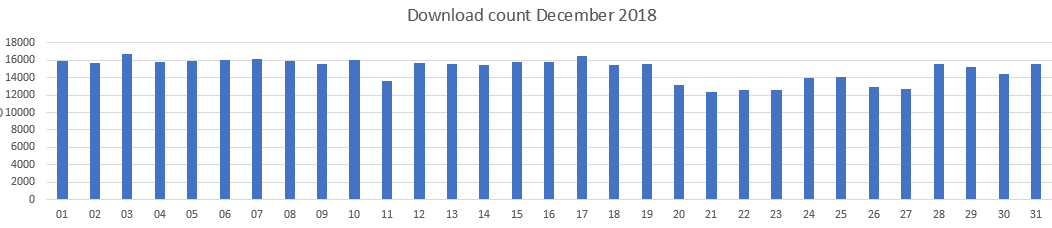
- they show December 2018
- they show only 1043nd downloads
- approx. 99% are wget+uclient-fetch
- Cities are not yet completely added (only 20% of downloads with city added)
BTW: If someone has a script solution
- to scrape IP-Range, Country, netname from https://www.whois.com/whois/ (or any other source)
- to scrape City + Assignment (static/dynamic) from https://whatismyipaddress.com/ip-lookup (or any other source)
without running into automatic bot-detection on those websites, please let me know.
Input: bunch of IPs (thousands)
Output: IP-Range, Country, netname, City, static/dynamic
Yes, Barcelona and Madrid are there, but heavily underrepresented, considering their populations. And the same happens with ISPs.
What I mean is that this seems specific to one ISP (Euskaltel) and one region (Euskadi, where Euskaltel operates). The rest of the connections are probably "noise".
Did the number of connections rise suddenly? That would indicate some massive and coordinate update in many devices... for example a firmware update from the ISP.
1 Like
The underrepresentation of certain regions / IP ranges may be due to only 20% of download requests have added a city.
Madrid may be underrepresented, but there are also some IPs in the vicinity of Madrid (call it "greater Madrid").
I don't think that this issue is restricted to Euskaltel, as I'm seeing lots of other networks.
But yes, a BIG portion of downloads originate in the northern area of Spain where Euskaltel is.
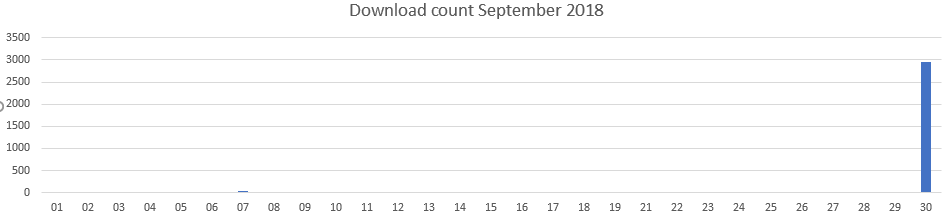
Rise of download numbers: Started 30.09.2018, from low hundreds (like other downloads) to thousands in one day.
Hmm.
And it has it been a rather stable load since then? Or is it still growing?
(the public history only shows the current year 2019, so it is hard to see if there has been growth in Sep/Oct/Nov/Dec/Jan.
If it is rather stable, it reduces the probability of gradual firmware updates by individual customers, or something like that, (causing a growing load along the growth the installed base of the new fiirmware with this test download site).
That being the last day of a quarter (or one day before the first of a new quarter), I have a guess:
some kind of SLA that has been automatically tested since 1.10.2018. E.g. automatic connection speed testing every few hours, run from customer data centers (or modems).
(or the remotely controlled test URL has been changed on 30.9.2018 to point to our site)
Mind the different scaling...
In my opinion it seems like some kind of local software system chosen by consumers (for instance a transportation app), that connects to the internet using which ever provider they are using. When those consumers travel to other places in Spain it will still connect, but in much lower numbers than in the prime area.
So, it really started at one day, and has then stayed rather stable at 15-16k downloads per day. Strange.
Looks like somebody toggled a centrally managed test URL on that day.
It shouldn't be that hard to gather ranges given the amount of data and feed those a dummy file instead, someone will eventually complain 
Madrid is the capital, and "the greater Madrid" is where most ISPs have their headquarters, what you are seeing are the default locations.
I'll try to contact Euskaltel and ask them.
Localized variant of ^?
Guifi + Movi has muchomicro's.......
Top 2 ~ volume correlation... ( to 10 ) of this page look strange;
https://downloads.openwrt.org/stats/awstats.downloads2.lede-project.org.errors404.html
I have just opened a thread on Euskaltel's forum: http://foro.euskaltel.com/Thread-Inexplicable-aumento-de-las-descargas-desde-Euskaltel-hacia-OpenWrt, will keep you informed.
1 Like
Rename target file/dir and redirect to warning page describing the problem.
They removed all the links so it will be hard for them to find the info 
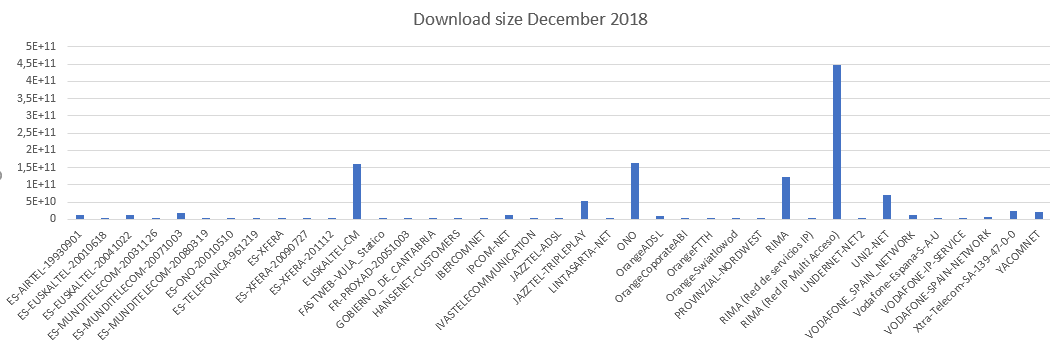
Regarding the source I now noticed that they seem to be from fixed connections, not mobile. There are more sources than Euskatel, though, so I don't think it's specific to that ISP. From what I understand RIMA is Telefonica/Movistar and ONO is Vodafone fiber/ADSL.
Numbers after todays updates (added cities to IPs with >1000 downloads, prefering those which can be found from September through December; approx. 50% of downloads with city now)
Barakaldo, Bilbao, Burgos, Castro Urdiales are the Top 4.
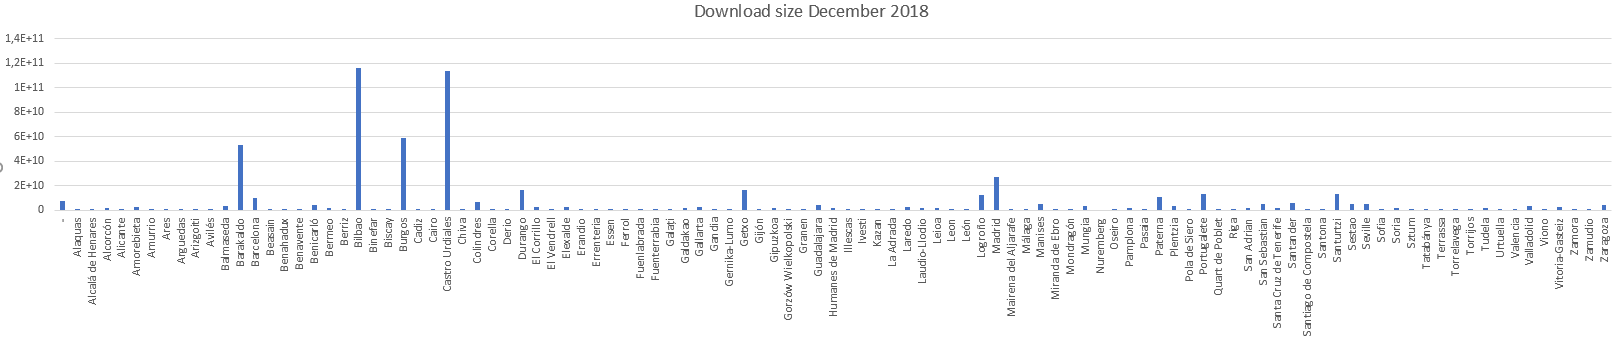
For comparison: numbers from yesterday evening: TL-WR1043ND snapshot images - High download numbers - Spanish users needed
Download size per netname (only relevant shown):
Perhaps I interpreted the data wrongly: there is a heavy bias towards the Euskadi region (Madrid is there because of the reason I explained before, and the rest of the connections is noise), and that produces a bias towards the Euskaltel ISP, because Euskaltel has a notable presence in Euskadi, and not because the issue is related to Euskaltel at all.
So, there seems to be some software that was mass-installed on 30/09/2018 in the Euskadi region, across all providers, on devices running 24/7... each provider uses their own customized routers, I would discard a firmware update or a remote attack.
I do not see a correlation between the number of downloads and the working calendar in Euskadi.
I would like to see some results restricted to the Euskadi region: how many different IPs? does that match the number of schools in Euskadi, for example?
I am also seeing that the number of downloads per city does not match the number of inhabitants, even in the Euskadi region... that seems weird, too.
@tmomas Do you think you could share the raw data from the statistics (without compromising anybody's privacy, obviously)? I have worked in data-mining, and I think that I could get more info if I have access to the raw data and do my own analysis.
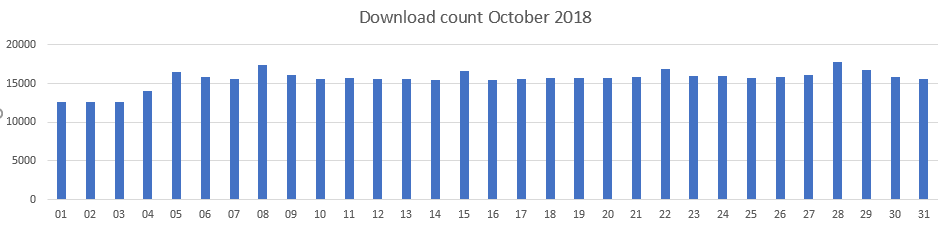
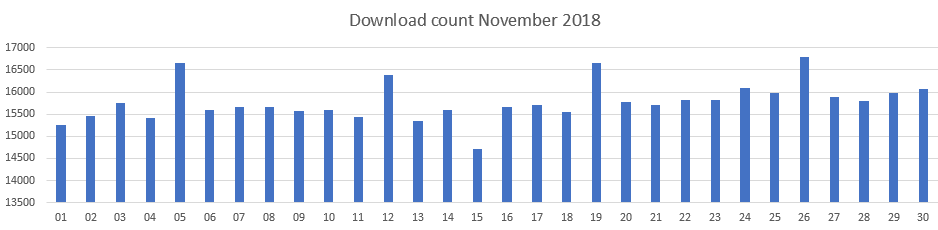
Only now I see a weekly pattern: see graphics above
October: Peaks on 8 / 15 / 22 / 28 (28 being the odd man out) -> 7day period, with the peaks on Mondays
November: 5 / 12 / 19 / 26 -> 7day period, with the peaks on Mondays
December: 3 / 10 / 17 / 24 -> 7day period, with the peaks on Mondays, but much lower than in November.
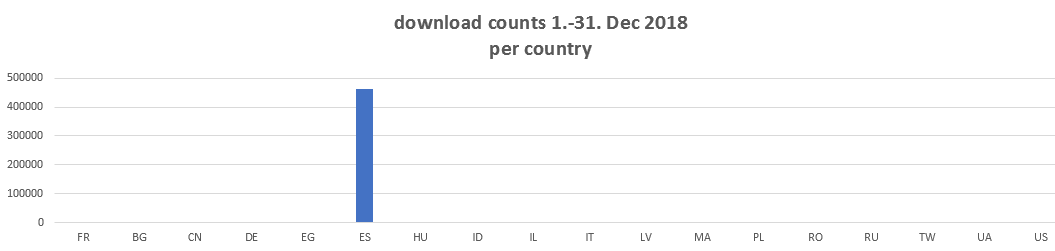
Further above I mentioned that 99,7% of the downloads come from Spain.
Let's take a look at the rest:
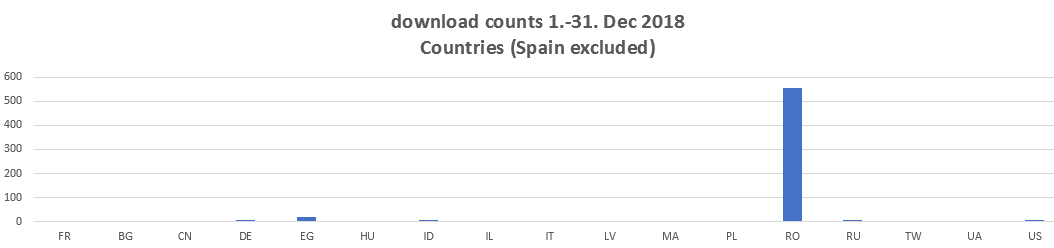
Oh, Romania is sticking out. Let's take an even closer look:

Where are those IPs located?

-> all are within a line of 75km length, so relatively close to each other.
My interpretation:
- A single IP (A,B,C,H) each day, over long periods of time -> one single user
- When there are two IPs per day, it might be the same user that hast just changed his (dynamic) IP
Now, Romania is quite a bit off from Spain (roughly 3000km apart), isn't it?
How comes a single user in Romania shows the same download behaviour as the spanish users (which are 99,7% of all download requests) 3000km away? What is the link between them?