Yep, we already have OpenWrt specific iwinfo plugin, so that solution would be ok.
But the parser should be robost enough that it would also parse fq_codel (from simple.qos) for the extent that there is data (at least number of packets and drops).
A specific plugin for cake/fq_codel would be wonderful. I started hacking a script together that could use the existing 'collectd_exec' plugin. I've hit numerous bumps in the road just to get his far, by which I mean 'parse the json output of tc into some variables'. jshn doesn't like tc's native json output hence the piping into jq. But there's a seed of a framework/idea here...maybe.
#!/bin/sh

. /usr/share/libubox/jshn.sh

HOSTNAME="${COLLECTD_HOSTNAME:-localhost}"
INTERVAL="${COLLECTD_INTERVAL:-60}"

handle_cake() {
	INTERFACE="$1"
	JSON="$2"
	json_load "${JSON}"

#Overall
	json_get_vars bytes packets drops backlog qlen

#Options
	json_select options
	json_get_vars bandwidth
	json_select ".."

	echo "PUTVAL \"$HOSTNAME/cake-$INTERFACE/qdisc_bytes\" interval=$INTERVAL N:$bytes"
	echo "PUTVAL \"$HOSTNAME/cake-$INTERFACE/qdisc_drops\" interval=$INTERVAL N:$drops"
	echo "PUTVAL \"$HOSTNAME/cake-$INTERFACE/qdisc_backlog\" interval=$INTERVAL N:$backlog"

#Tins
	json_get_keys tins tins
	json_select tins
	tinnum=0
	for tin in $tins; do
		json_select "$tin"
		json_get_vars threshold_rate sent_bytes backlog_bytes peak_delay_us avg_delay_us base_delay_us drops ecn_mark ack_drops sparse_flows bulk_flows unresponsive_flows

		echo "PUTVAL \"$HOSTNAME/cake-${INTERFACE}/qdisct_bytes-tin${tinnum}\" interval=$INTERVAL N:$sent_bytes"
		echo "PUTVAL \"$HOSTNAME/cake-${INTERFACE}/qdisct_drops-tin${tinnum}\" interval=$INTERVAL N:$drops:$ecn_mark:$ack_drops"
		echo "PUTVAL \"$HOSTNAME/cake-${INTERFACE}/qdisct_backlog-tin${tinnum}\" interval=$INTERVAL N:$backlog_bytes"
		echo "PUTVAL \"$HOSTNAME/cake-${INTERFACE}/qdisct_flows-tin${tinnum}\" interval=$INTERVAL N:$sparse_flows:$bulk_flows:$unresponsive_flows"
		echo "PUTVAL \"$HOSTNAME/cake-${INTERFACE}/qdisct_latencyus-tin${tinnum}\" interval=$INTERVAL N:$peak_delay_us:$avg_delay_us:$base_delay_us"
		json_select ..
		tinnum=$((tinnum+1))
	done
	json_select ..

	json_cleanup
}

process_qdisc() {
	INTERFACE="$1"
	JSON=$(tc -s -j qdisc show dev "$INTERFACE")
#strip leading & trailing []
	JSON="${JSON#[}" ; JSON="${JSON%]}"
	json_load "${JSON}"
	json_get_var QDISC kind
	json_cleanup

	case "$QDISC" in
		cake) handle_cake "$INTERFACE" "$JSON"
		;;

		*) echo "Unknown qdisc type"
		;;
	esac
}

for iface in $* ; do
	process_qdisc "$iface"
done
Any chance you could post the relevant section from your collectd.conf? I've tried to set up your script, and when I run it from the command line it produces the proper output, but when executed through collectd it's not producing anything. :-\
It requires also the changes to collectd (type definitions), which need to be compiled in. Took me while to figure it out. (Running collectd on foreground helped)
Plus of course you need the chart definitions.
Look at Kevin's GitHub repo, both packages and LuCI there. (I noticed the commits there so late yesterday that I haven't yet compiled them in myself)
The changes/requirements proved a bit more invasive than I hoped, so to get a working system requires changes in a couple of places and not just the script. As Hannu pointed out collectd's types database needs to taught the qdisc data types and the script needs to be executable as 'nobody'.
I hope to have a single commit in the packages collectd repo with all the component parts put together so that it just installs by end of today. Similarly the graph definitions, which are a bit more rough'n'ready, and expose something that's either a bug or incorrect usage/expectations.
Thanks for the script and LuCI parts. They seem to work ok at the first glance.
(The last bit for me was to place the script to /www, so that it was runnable ok.)
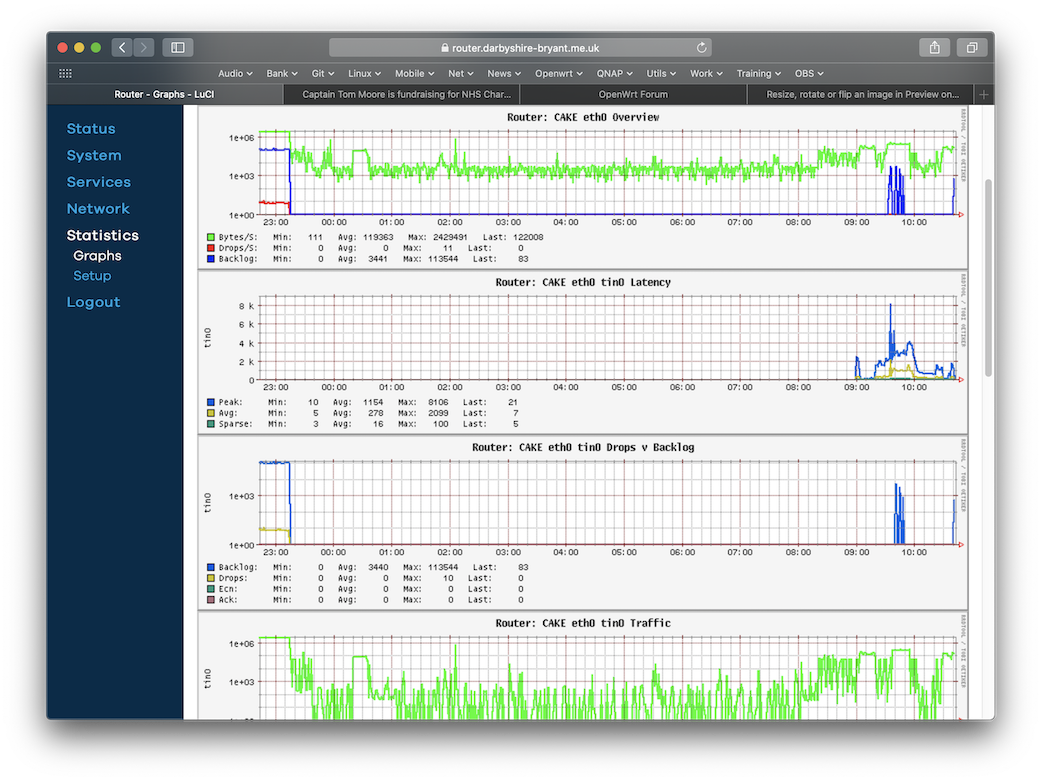
The latest incarnation of the scripts & luci-stats graphs.
The collection bit
The display bit
I split the graph display into 2 categories (requiring a change in how the data is stored by collectd). An 'overview' showing traffic, drops & backlog. A 'per tin' view showing traffic, latency (target, peak, avg, sparse), Drops v Backlog (backlog bytes & drops, ecn marks, ack_drops), flow counts (bulk, sparse, unresponsive)
I'm going to go and lie down now, that's been hard work!
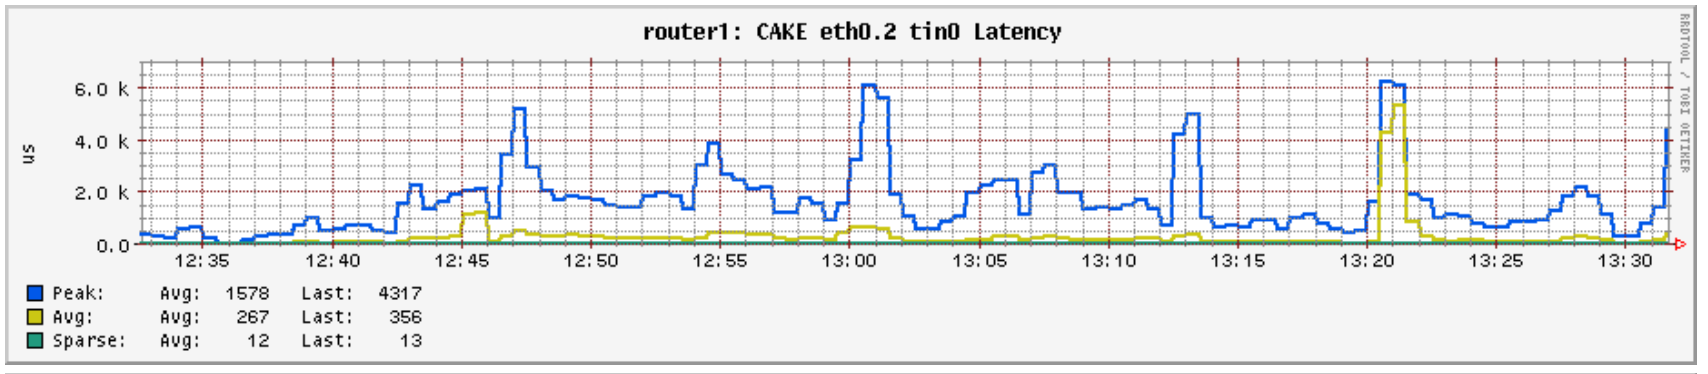
The old code worked for me, but the new code runs errors when run against eth0.2
Apparently the dot in the eth name causes the osp evaluation line to hiccup:
Fri Apr 17 19:47:27 2020 daemon.err collectd[23068]: Initialization complete, entering read-loop.
Fri Apr 17 19:47:28 2020 daemon.err collectd[23068]: exec plugin: exec_read_one: error = sh: .2t0: out of range
Fri Apr 17 19:47:28 2020 daemon.err collectd[23068]: exec plugin: exec_read_one: error = /www/cakestats.sh: eval: line 1: ospeth0.2t0=0: not found
Fri Apr 17 19:47:28 2020 daemon.err collectd[23068]: exec plugin: exec_read_one: error = sh: .2t1: out of range
Fri Apr 17 19:47:28 2020 daemon.err collectd[23068]: exec plugin: exec_read_one: error = /www/cakestats.sh: eval: line 1: ospeth0.2t1=1119: not found
Fri Apr 17 19:47:28 2020 daemon.err collectd[23068]: exec plugin: exec_read_one: error = sh: .2t2: out of range
Happens both with layer_cake and piece_of_cake
With layer_cake I do not get graphs at all,
but with piece_of_cake the tins shows data for tin0. No graph for the total stats.
Rats! I needed to store the previous value of sent_bytes so I could check whether a tin has passed data or not, to then null out some values. '.' is not valid for variable names. I've an idea for working around that.....
/usr/sbin sounds wrong, as "sbin" directories are generally meant for stuff requiring superuser credentials, and here we decrease the access required level to "nobody".
For implementing this in the main repo, I would like to
have the types.db stuff go into the main collectd app, like now
make the cake stuff its own module collectd-mod-cake (or collectd-mod-sqm) that would then depend on collectd-mod-exec. I think that that easiest might be to create a separate package directory collectd-mod-sqm, as the app really is just a script piggy-backing on the required collect-mod-exec. I think that it would be too difficult to really included this in the main collectd Makefile deviating quite much from all other plugins.
have at least some stats from the fq_codel qdisc, so I would prefer the name to be collectd-mod-sqm and to have either an unified script for cake and fq_codel, or two separate scripts.
This really working automatically would require some uci config work in luci_statistics config. The exec plugin should be disabled by default in luci_statistics, but there might be a model config for the sqm stats in the shipped luci_statistics default config
Great work in any case.
In the long run it might be better to do a real C based plugin for collectd, but as the first step, this looks really nice.
Thanks Hannu for the kind words, very much appreciated.
I'm amazed I've got as far as I have and I'm fully aware it's not 'commit quality' A 'C' plugin that interfaces with qdiscs via netlink is by far the more efficient method to go, this was more a "what can be got out and graphed" experiment with the 'least' effort. Perhaps next month
I'm still fiddling with things as it stands. I have the latency display in microseconds and would like to convert that to milliseconds. Of course 'ash' doesn't do floating point so a simple arithmetic divide by 1000 isn't good enough. I have a horrific idea to solve that.
The other thing that is exposing an anomaly in luci-stats graphing is I'd like a 'stacked combined' plot of the tins bandwidth in the tins view with individual 'per instance' tin graphs for everything else. Unfortunately as soon as you do a 'per instance' graph you only get the graphs for the first tin.

 A 'C' plugin that interfaces with qdiscs via netlink is by far the more efficient method to go, this was more a "what can be got out and graphed" experiment with the 'least' effort. Perhaps next month