Speedtest: new package to measure network performance

I'd been thinking about making a network speed testing package since first posting about the currently available options, and over the last few months have developed, tested, and packaged the speedtest-netperf.sh script.

While a PR has since been submitted and merged into the openwrt/packages repo, user feedback and testing exposure, especially on multi-core systems, continues to be welcome.

There is a README.md online, and from the package commit a brief description:

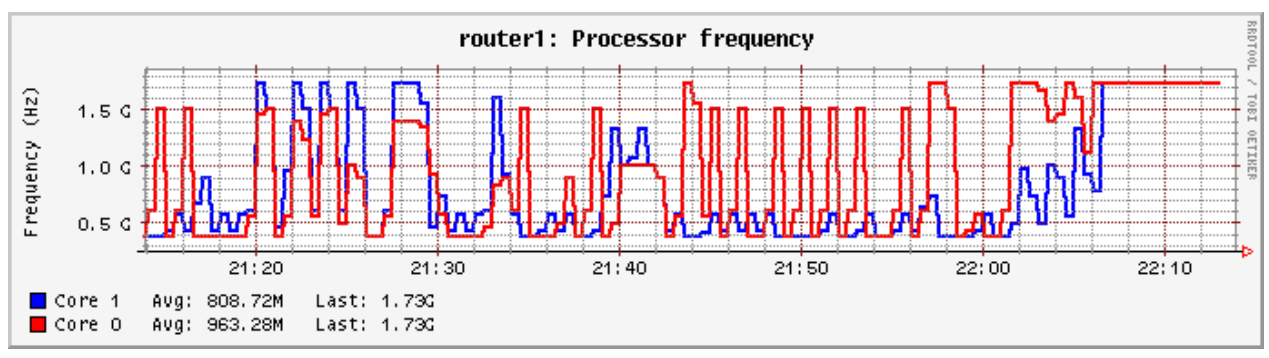
The speedtest-netperf.sh script measures the network throughput while
monitoring latency under load and capturing key CPU usage and frequency
statistics. The script can emulate a web-based speed test by downloading
and then uploading from an internet server, or perform simultaneous
download and upload to mimic the stress of the FLENT test program.

It simplifies tasks such as validating ISP provisioned speeds or setting
up and fine-tuning SQM, directly on the router. The CPU usage details
can also help determine if the demands of SQM, routing and other tasks
such as the test itself are exhausting the device's CPUs.

This script leverages earlier scripts from the CeroWrt project used for
bufferbloat mitigation, betterspeedtest.sh and netperfrunner.sh. They are
used with the permission of the author, Rich Brown.


The package can be installed directly from the openwrt/packages repo, and should work on LEDE 17.01 onwards:

# uclient-fetch https://downloads.openwrt.org/snapshots/packages/mips_24kc/packages/speedtest-netperf_1.0.0-1_all.ipk
# opkg install speedtest-netperf_1.0.0-1_all.ipk

It is also possible to install and run the speedtest-netperf.sh script on a Linux server connected to your router's LAN interface. This can be useful if running the script on your router consumes too much CPU or fails to meet your speed and latency targets. For example, on Ubuntu:

$ sudo apt-get install netperf wget
$ cd /tmp
$ wget https://raw.githubusercontent.com/openwrt/packages/master/net/speedtest-netperf/files/speedtest-netperf.sh

The script output includes network throughput, packet loss, a latency distribution, per-core processor usage and frequency, and CPU consumption of the test program (mainly netperf) itself.

Sample output on an old DIR-835 router (560 MHz single-core MIPS) showing the standard sequential test followed by the more stressful concurrent test:

# speedtest-netperf.sh -H netperf-west.bufferbloat.net -p 1.1.1.1 --sequential
[Date/Time] Starting speedtest for 60 seconds per transfer session.
Measure speed to netperf-west.bufferbloat.net (IPv4) while pinging 1.1.1.1.
Download and upload sessions are sequential, each with 5 simultaneous streams.
..............................................................
 Download:  33.30 Mbps
  Latency: [in msec, 64 pings, 0.00% packet loss]
      Min:   9.551
    10pct:  11.281
   Median:  14.480
      Avg:  14.550
    90pct:  17.327
      Max:  21.308
 CPU Load: [in % busy (avg +/- std dev), 57 samples]
     cpu0:  86.7 +/-  6.5
 Overhead: [in % used of total CPU available]
  netperf: 60.2
.............................................................
   Upload:   5.13 Mbps
  Latency: [in msec, 61 pings, 0.00% packet loss]
      Min:   8.615
    10pct:   9.792
   Median:  14.152
      Avg:  14.303
    90pct:  17.317
      Max:  19.934
 CPU Load: [in % busy (avg +/- std dev), 58 samples]
     cpu0:  19.7 +/-  5.7
 Overhead: [in % used of total CPU available]
  netperf:  1.4

# speedtest-netperf.sh -H netperf-west.bufferbloat.net -p 1.1.1.1 --concurrent
[Date/Time] Starting speedtest for 60 seconds per transfer session.
Measure speed to netperf-west.bufferbloat.net (IPv4) while pinging 1.1.1.1.
Download and upload sessions are concurrent, each with 5 simultaneous streams.
..............................................................
 Download:  31.86 Mbps
   Upload:   4.53 Mbps
  Latency: [in msec, 63 pings, 0.00% packet loss]
      Min:   8.871
    10pct:  13.792
   Median:  17.480
      Avg:  18.427
    90pct:  22.292
      Max:  57.617
 CPU Load: [in % busy (avg +/- std dev), 59 samples]
     cpu0:  90.0 +/-  9.7
 Overhead: [in % used of total CPU available]
  netperf: 46.6

In the examples above, my target upload/download speeds are achieved with good latencies. Although the CPU load is high, much of that is due to the netperf test program itself, so during normal operation there should be more CPU "headroom" available.


For your own testing, please note the script Usage parameters below from the README, and try to run both a sequential and concurrent test, using a netperf server geographically close to you.

speedtest-netperf.sh [-4 | -6] [-H netperf-server] [-t duration] [-p host-to-ping] [-n simultaneous-streams ] [-s | -c]

Options, if present, are:

-4 | -6:           Enable ipv4 or ipv6 testing (default - ipv4)
-H | --host:       DNS or Address of a netperf server (default - netperf.bufferbloat.net)  
                   Alternate servers are netperf-east (US, east coast),
                   netperf-west (US, California), and netperf-eu (Denmark).
-t | --time:       Duration for how long each direction's test should run - (default - 60 seconds)
-p | --ping:       Host to ping to measure latency (default - gstatic.com)
-n | --number:     Number of simultaneous sessions (default - 5 sessions)
-s | --sequential: Sequential download/upload (default - sequential)
-c | --concurrent: Concurrent download/upload

Appreciate any usage feedback. Thanks to all!

Recent Changes

speedtest-netperf_1.0.0-1_all.ipk

- updated the package name to clarify the back-end, highlight the ability to use any netperf server,
  and distinguish from other speedtest variants
- users should use the new speedtest-netperf package after uninstalling the old one,
  and the new package will remind of any conflict with the old one during installation
- improved consistency and clarity of results and units
- check for presence of netperf if running the unpackaged script on a Linux server
- package accepted into openwrt/packages repo

speedtest_0.9-7_all.ipk

- fix typo causing missing "avg frequency" heading and improve robustness

speedtest_0.9-6_all.ipk

- cleanup whitespace, clarify wording of netperf overhead & load samples
- use clearer, consistent local and global variables
- check and warn on netperf errors
- more robust frequency calculation, ping summary
- use sysfs for better cross-platform CPU frequency summary (e.g. arm)
11 Likes

Run fine:


Measure speed to netperf-west.bufferbloat.net (IPv4) while pinging 1.1.1.1.
Download and upload sessions are concurrent, each with 5 simultaneous streams.
.............................................................
 Download:  40.93 Mbps
   Upload:  46.47 Mbps
  Latency: (in msec, 61 pings, 0.00% packet loss)
      Min: 2.945
    10pct: 4.991
   Median: 10.796
      Avg: 14.775
    90pct: 25.821
      Max: 105.775
Processor: (in % busy, avg +/- stddev, 58 samples)
     cpu0: 43 +/-  5
     cpu1: 22 +/-  4
     cpu2: 20 +/-  5
     cpu3: 22 +/-  5
 Overhead: (in % total CPU used)
  netperf: 15

Nice! I wonder whether it would be possible to report the CPU usage like the ping results, or at least with say a 95 and 99 percentile? The average will somewhat hide short excursions to idle0% that still might lead to reduced network throughout. But that is just a minor potential feature request....

Run htop whilst running the speed test.

1 Like

This is great advice in general but will not help with the reason to run a concurrent CPU load-meter together with a speedtest IMHO. The issue is that transient CPU overloads can and will affect both measured latency and achieved throughput negatively, so adding the load information to the summary output is great. I am only trying to argue even more information like maximum CPU load and say 99-percentile as these will give a better feeling whether the speedtest is reliable. This is especially important with this test, as @guidosarducci notes, as running netperf will put additional load on the router's CPU(s).

well, i have a gigabit connection, i suppose this is not measuring properly the speed of my connection :slight_smile:
more or less i get the same result using EU server..

root@RUTTO:~# speedtest.sh -H netperf-west.bufferbloat.net -p 1.1.1.1 --concurrent 2018-11-06 23:03:49 Starting speedtest for 60 seconds per transfer session. Measure speed to netperf-west.bufferbloat.net (IPv4) while pinging 1.1.1.1. Download and upload sessions are concurrent, each with 5 simultaneous streams. ............................................................. Download: 12.96 Mbps Upload: 71.81 Mbps Latency: (in msec, 62 pings, 0.00% packet loss) Min: 2.783 10pct: 4.940 Median: 13.806 Avg: 15.855 90pct: 25.345 Max: 66.465 Processor: (in % busy, avg +/- stddev, 58 samples) cpu0: 70 +/- 8 cpu1: 91 +/- 0 Overhead: (in % total CPU used) netperf: 19

This is basically indicating that you are CPU bound, cpu1 running at 91% busy measured over a full second. This also illustrates why I argue that only giving the average CPU busy is not painting the full picture...

Finally, I would be amazed if the bufferbloat.net infrastructure would be prepared to reliably work for clients in the Gbps range, let alone multiple concurrent ones....

1 Like

i don't think a r7800 can be cpu bound downloading at 10mbps..

Well, two observations:
a) Download: 12.96 Mbps Upload: 71.81 Mbps = 84.77 Mbps total >> 10 Mbps

b) cpu0: 70 +/- 8 cpu1: 91 +/- 0: this leaves at best 100-70+100-91 = 39 % CPU cycles available (with 100% equalling one CPU)

See https://forum.openwrt.org/t/r7800-performance/15780/4 for some discussion of potential r7800 issues.

My thanks to all who've done local testing so far and posted results. This looks very cool and all working as intended, and the multi-core monitoring is definitely compelling.

When posting your results please try to embed them in "code blocks" (</>) to make them more readable, and if you could describe your router model/hardware and expected link speed that would add some useful context to the results.

I also updated the OP slightly to request that folks try performing both a sequential and concurrent test. The sequential test will give closer results to a typical web speed test that you've done before.

@anon69880279 Those are nice test results for your quad-core router: you're getting close to 90 Mbps in aggregate throughput, with good latency and hardly any sweat on your CPU's brow. I'd love to know what device you're using, and how your sequential test results compare with previous ones you've done.

@pattagghiu Thanks for testing. Your results definitely seem odd, but nothing about the test itself jumps out. Your CPU cores %busy is on the high side but stable over the test period, so you don't appear CPU-bound, and netperf overhead is low. Your latencies are OK too. What's strange is your low 13 Mbps download vs the more respectable 72 Mbps upload, though both are shy of 1 Gbps.
My suggestions/questions would be:

  1. Have you previously measured gigabit speeds from your location? Can you try again using the same web site as a point of reference?
  2. Can you try again with a speedtest.sh sequential test, using the EU server, and using e.g. 10 simultaneous transfer streams (options -s -n 10 -H netperf-eu.bufferbloat.net).

Let's try those first and see what happens.

I'll also ask @richb-hanover if he has any insight into what the netperf servers (EU specifically) are capable of (certainly more than 13 Mbps :slight_smile:) .

No. These averages are measured over the full test period, a fact which you're deliberately ignoring. An average of 91% over 60 seconds (NOT 1 second as you claim) and close to zero std deviation, is on the high-side, stable, but not CPU-bound as I said above.

I'll ask you to stop making up facts and spreading unproductive misinformation.

I believe @tohojo is running netperf-eu. @richb-hanover operates netperf-east, @dtaht operates netperf-west.

Your sampling period, or rather the time between reading /proc/stats is 1 second, so you building blocks will only give you one second resolution. in that second the CCPU might be 500ms at 100% busy and 500ms at 0% the average will look like 50% and hide potential stalls., no?

Here is the code I am referring to:

# Capture per-CPU and process load info at 1-second intervals.

sample_load() {
	cat /proc/$$/stat
	while : ; do
		sleep 1s
		egrep "^cpu[0-9]*" /proc/stat
	done
}

You will only get your aggregates build up from these 1 second periods, the only way to reach an average of 100% with this approach seems to be to have all/most of these 1 second epochs be at 100% busy. And that will gloss over shorter cpu-stalls.

Well, as I stated above, the issue I am concerned about are temporary stalls.

Well, it certainly is possible that I misunderstood the code, so please enlighten me, which will be valuable information for other readers of this thread.

speedtest.sh -H netperf-west.bufferbloat.net -p 1.1.1.1 --concurrent

I have a WR1200JS
http://www.minihere.com/youhua-wr1200js-openwrt-padavan-firmware.html

WR1200JS <-> WIFI AC <-> LiveBox 4 <-> Fiber 1000/300

1 Like

All the netperf-*.bufferbloat.net boxes are on Gbit connections, AFAIK, but don't expect to be able to actually get a gigabit of throughput from any one of them, even if you are not CPU limited...

1 Like

You are very welcome :slight_smile:

Well my line is 1000/100 so i'm not that worried about the 72 upload, but the other is totally (i mean, totally) false. See below..

[quote]
My suggestions/questions would be:

  1. Have you previously measured gigabit speeds from your location? Can you try again using the same web site as a point of reference?[/quote]

I reached over 800Mbps with a wired pc (but with with speedtest.net servers!).
Upload over 90Mbps so the line is not in doubt :slight_smile:
I had never used the bufferbloat servers so i should discover how to use them without your script..

I already tried the sequential test, with better but still ridiculous results (sorry, i did not took evidence).
I'll give it another try this evening going home from office..
Have a nice day!

(just for reference: R7800, line 1000/100, last master built by hynman)

1 Like

The package speedtest_0.9-4_all.ipk works even on 15.05...

1 Like

Not quite sure, but somehow stats on R7800 seem strange, like by pattagghiu.

My own R7800 build, r8430-4d5b0efc09, wired connection of approx 100/10, or sometimes a bit more.

I have tested first with SQM on and then with SQM off.
(I usually have pretty conservative speed limits in SQM...)

I also looked with htop that the netperf processes really get divided to both cores, so a balanced CPU usage is apparently true, although I have not modified the interrupts, so eth0/eth1/wlan0/wlan1 all burden core0.

The strange part is visible below, as for some reason I get high CPU utilisation if I use Toke's server that provides 10 Mbit better download speed. At that point, about 98 Mbit/s down, the CPU load grows quite high. (and netperf overhead can be 62)

Somehow the test and R7800 do not like each other.

SQM ON

root@router1:/tmp# ./speed.sh
2018-11-07 20:47:17 Starting speedtest for 60 seconds per transfer session.
Measure speed to netperf.bufferbloat.net (IPv4) while pinging gstatic.com.
Download and upload sessions are sequential, each with 5 simultaneous streams.
.............................................................
 Download:  71.43 Mbps
  Latency: (in msec, 61 pings, 0.00% packet loss)
      Min: 10.673
    10pct: 10.770
   Median: 11.134
      Avg: 11.184
    90pct: 11.656
      Max: 12.417
Processor: (in % busy, avg +/- stddev, 59 samples)
     cpu0: 13 +/-  6
     cpu1: 17 +/-  8
 Overhead: (in % total CPU used)
  netperf: 17
.............................................................
   Upload:   9.15 Mbps
  Latency: (in msec, 62 pings, 0.00% packet loss)
      Min: 10.731
    10pct: 10.900
   Median: 11.459
      Avg: 11.586
    90pct: 12.211
      Max: 13.037
Processor: (in % busy, avg +/- stddev, 59 samples)
     cpu0:  6 +/-  3
     cpu1:  6 +/-  2
 Overhead: (in % total CPU used)
  netperf:  2
root@router1:/tmp# /etc/init.d/sqm stop
SQM: Stopping SQM on eth0.2
SQM OFF

root@router1:/tmp# ./speed.sh
2018-11-07 20:49:34 Starting speedtest for 60 seconds per transfer session.
Measure speed to netperf.bufferbloat.net (IPv4) while pinging gstatic.com.
Download and upload sessions are sequential, each with 5 simultaneous streams.
.............................................................
 Download:  93.43 Mbps
  Latency: (in msec, 61 pings, 0.00% packet loss)
      Min: 10.544
    10pct: 10.655
   Median: 10.886
      Avg: 15.179
    90pct: 24.201
      Max: 48.363
Processor: (in % busy, avg +/- stddev, 58 samples)
     cpu0: 14 +/-  8
     cpu1: 18 +/- 10
 Overhead: (in % total CPU used)
  netperf: 16
.............................................................
   Upload:  10.34 Mbps
  Latency: (in msec, 62 pings, 0.00% packet loss)

      Min: 10.928
    10pct: 10.989
   Median: 11.122
      Avg: 11.154
    90pct: 11.270
      Max: 11.976
Processor: (in % busy, avg +/- stddev, 59 samples)
     cpu0:  5 +/-  3
     cpu1:  5 +/-  2
 Overhead: (in % total CPU used)
  netperf:  2
SQM OFF, SIMULTANEOUS

root@router1:/tmp# ./speed.sh -c
2018-11-07 20:52:59 Starting speedtest for 60 seconds per transfer session.
Measure speed to netperf.bufferbloat.net (IPv4) while pinging gstatic.com.
Download and upload sessions are concurrent, each with 5 simultaneous streams.
.............................................................
 Download:  91.64 Mbps
   Upload:   9.45 Mbps
  Latency: (in msec, 61 pings, 0.00% packet loss)
      Min: 10.730
    10pct: 10.961
   Median: 11.122
      Avg: 15.057
    90pct: 28.342
      Max: 49.733
Processor: (in % busy, avg +/- stddev, 59 samples)
     cpu0: 17 +/-  7
     cpu1: 18 +/-  9
 Overhead: (in % total CPU used)
  netperf: 14

The strange part is that using Toke's server rather near me (in Denmark): I get 10 Mbit higher download speed, but ping latency grows and CPU load jumps to 40%. I wonder if that is somehow related to the test script being a shell script, or is some limit hit there.

root@router1:/tmp# ping netperf-eu.bufferbloat.net
PING netperf-eu.bufferbloat.net (130.243.26.64): 56 data bytes
64 bytes from 130.243.26.64: seq=0 ttl=50 time=14.987 ms
64 bytes from 130.243.26.64: seq=1 ttl=50 time=14.961 ms
64 bytes from 130.243.26.64: seq=2 ttl=50 time=15.116 ms
64 bytes from 130.243.26.64: seq=3 ttl=50 time=15.181 ms

--- netperf-eu.bufferbloat.net ping statistics ---
7 packets transmitted, 7 packets received, 0% packet loss
round-trip min/avg/max = 14.961/15.080/15.181 ms
root@router1:/tmp# ping gstatic.com
PING gstatic.com (216.58.207.195): 56 data bytes
64 bytes from 216.58.207.195: seq=0 ttl=55 time=10.981 ms
64 bytes from 216.58.207.195: seq=1 ttl=55 time=10.873 ms
64 bytes from 216.58.207.195: seq=2 ttl=55 time=10.992 ms

--- gstatic.com ping statistics ---
6 packets transmitted, 6 packets received, 0% packet loss
round-trip min/avg/max = 10.836/10.904/10.992 ms

root@router1:/tmp# ./speed.sh -c -H netperf-eu.bufferbloat.net
2018-11-07 21:01:56 Starting speedtest for 60 seconds per transfer session.
Measure speed to netperf-eu.bufferbloat.net (IPv4) while pinging gstatic.com.
Download and upload sessions are concurrent, each with 5 simultaneous streams.
.............................................................
 Download:  98.24 Mbps
   Upload:   8.42 Mbps
  Latency: (in msec, 61 pings, 0.00% packet loss)
      Min: 10.742
    10pct: 37.472
   Median: 44.505
      Avg: 42.940
    90pct: 48.157
      Max: 49.226
Processor: (in % busy, avg +/- stddev, 59 samples)
     cpu0: 39 +/-  5
     cpu1: 40 +/-  6
 Overhead: (in % total CPU used)
  netperf: 46

root@router1:/tmp# ./speed.sh -c
2018-11-07 21:03:40 Starting speedtest for 60 seconds per transfer session.
Measure speed to netperf.bufferbloat.net (IPv4) while pinging gstatic.com.
Download and upload sessions are concurrent, each with 5 simultaneous streams.
..............................................................
 Download:  90.84 Mbps
   Upload:   9.45 Mbps
  Latency: (in msec, 60 pings, 0.00% packet loss)
      Min: 10.487
    10pct: 10.700
   Median: 10.860
      Avg: 12.372
    90pct: 11.227
      Max: 36.272
Processor: (in % busy, avg +/- stddev, 59 samples)
     cpu0: 16 +/-  9
     cpu1: 18 +/-  7
 Overhead: (in % total CPU used)
  netperf: 15

root@router1:/tmp# ./speed.sh -H netperf-eu.bufferbloat.net
2018-11-07 21:07:08 Starting speedtest for 60 seconds per transfer session.
Measure speed to netperf-eu.bufferbloat.net (IPv4) while pinging gstatic.com.
Download and upload sessions are sequential, each with 5 simultaneous streams.
............................................................
 Download:  98.45 Mbps
  Latency: (in msec, 61 pings, 0.00% packet loss)
      Min: 10.710
    10pct: 38.381
   Median: 45.766
      Avg: 44.546
    90pct: 49.025
      Max: 49.787
Processor: (in % busy, avg +/- stddev, 58 samples)
     cpu0: 39 +/-  5
     cpu1: 38 +/-  5
 Overhead: (in % total CPU used)
  netperf: 48
............................................................
   Upload:  10.58 Mbps
  Latency: (in msec, 56 pings, 0.00% packet loss)
      Min: 10.709
    10pct: 10.773
   Median: 10.904
      Avg: 10.929
    90pct: 11.024
      Max: 12.077
Processor: (in % busy, avg +/- stddev, 58 samples)
     cpu0:  5 +/-  3
     cpu1:  5 +/-  2
 Overhead: (in % total CPU used)
  netperf:  2
root@router1:/tmp# /etc/init.d/sqm restart
Command failed: Not found
SQM: Starting SQM script: simple.qos on eth0.2, in: 110000 Kbps, out: 11000 Kbps
SQM: simple.qos was started on eth0.2 successfully
root@router1:/tmp#
root@router1:/tmp# ./speed.sh -c -H netperf-eu.bufferbloat.net
2018-11-07 21:20:21 Starting speedtest for 60 seconds per transfer session.
Measure speed to netperf-eu.bufferbloat.net (IPv4) while pinging gstatic.com.
Download and upload sessions are concurrent, each with 5 simultaneous streams.
............................................................
 Download:  98.15 Mbps
   Upload:   8.42 Mbps
  Latency: (in msec, 61 pings, 0.00% packet loss)
      Min: 11.765
    10pct: 12.520
   Median: 43.209
      Avg: 36.226
    90pct: 48.268
      Max: 51.537
Processor: (in % busy, avg +/- stddev, 57 samples)
     cpu0: 52 +/-  0
     cpu1: 75 +/-  2
 Overhead: (in % total CPU used)
  netperf: 62
1 Like

@guidosarducci

Apparently the script can also run overtime: once it ran first for the normal 60 seconds, and the next run was surprisingly 130 seconds...

root@router1:/tmp# ./speed.sh -c
2018-11-07 21:27:26 Starting speedtest for 60 seconds per transfer session.
Measure speed to netperf.bufferbloat.net (IPv4) while pinging gstatic.com.
Download and upload sessions are concurrent, each with 5 simultaneous streams.
.............................................................
 Download:  79.89 Mbps
   Upload:   7.02 Mbps
  Latency: (in msec, 61 pings, 0.00% packet loss)
      Min: 10.974
    10pct: 12.375
   Median: 15.434
      Avg: 15.279
    90pct: 17.858
      Max: 19.394
Processor: (in % busy, avg +/- stddev, 58 samples)
     cpu0: 44 +/-  5
     cpu1: 90 +/-  0
 Overhead: (in % total CPU used)
  netperf: 25

root@router1:/tmp# ./speed.sh -c
2018-11-07 21:28:44 Starting speedtest for 60 seconds per transfer session.
Measure speed to netperf.bufferbloat.net (IPv4) while pinging gstatic.com.
Download and upload sessions are concurrent, each with 5 simultaneous streams.
.................................................................................................................................
 Download:  81.34 Mbps
   Upload:   7.08 Mbps
  Latency: (in msec, 130 pings, 0.00% packet loss)
      Min: 10.836
    10pct: 10.968
   Median: 11.119
      Avg: 13.083
    90pct: 16.984
      Max: 26.452
Processor: (in % busy, avg +/- stddev, 126 samples)
     cpu0: 21 +/- 23
     cpu1: 40 +/- 47
 Overhead: (in % total CPU used)
  netperf: 11
1 Like

I think I figured out what goes wrong with the CPU utilization stats:
It does not take into account the CPU frequency scaling that is available on some targets, like ipq806x for R7800. Apparently the stats only read the utilisation at the current frequency.

Below is proof: first a run with the default "ondemand" CPU scaling governor, where CPUs idles at 384 MHz and under load can scale frequency up to 1700 MHz. Then a run with "performance" governor, where CPU is always at 1700 MHz.

On the first run the measured CPU load is 41/43%, while on the second run the reading is just 10/14% reflecting better the true utilisation of the CPU's power. On both runs the speeds and latency are identical, so the true CPU load is also identical.

This will be visible at least with ipq806x routers, plus likely also x86 ( and mvebu if you use the scaling driver patch).

root@router1:~# echo ondemand > /sys/devices/system/cpu/cpufreq/policy0/scaling_governor
root@router1:~# echo ondemand > /sys/devices/system/cpu/cpufreq/policy1/scaling_governor
root@router1:~# /tmp/speed.sh -c -H netperf-eu.bufferbloat.net
2018-11-07 22:05:16 Starting speedtest for 60 seconds per transfer session.
Measure speed to netperf-eu.bufferbloat.net (IPv4) while pinging gstatic.com.
Download and upload sessions are concurrent, each with 5 simultaneous streams.
............................................................
 Download:  98.23 Mbps
   Upload:   8.34 Mbps
  Latency: (in msec, 57 pings, 0.00% packet loss)
      Min: 36.952
    10pct: 39.048
   Median: 46.507
      Avg: 45.769
    90pct: 49.395
      Max: 51.590
Processor: (in % busy, avg +/- stddev, 58 samples)
     cpu0: 41 +/-  4
     cpu1: 43 +/-  2
 Overhead: (in % total CPU used)
  netperf: 48


root@router1:~# echo performance > /sys/devices/system/cpu/cpufreq/policy0/scaling_governor
root@router1:~# echo performance > /sys/devices/system/cpu/cpufreq/policy1/scaling_governor
root@router1:~# /tmp/speed.sh -c -H netperf-eu.bufferbloat.net
2018-11-07 22:06:28 Starting speedtest for 60 seconds per transfer session.
Measure speed to netperf-eu.bufferbloat.net (IPv4) while pinging gstatic.com.
Download and upload sessions are concurrent, each with 5 simultaneous streams.
.............................................................
 Download:  98.23 Mbps
   Upload:   8.32 Mbps
  Latency: (in msec, 60 pings, 0.00% packet loss)
      Min: 10.915
    10pct: 40.384
   Median: 45.772
      Avg: 44.483
    90pct: 48.308
      Max: 49.213
Processor: (in % busy, avg +/- stddev, 59 samples)
     cpu0: 10 +/-  3
     cpu1: 14 +/-  3
 Overhead: (in % total CPU used)
  netperf: 33

CPU speed stats:

image

1 Like

I thought I would give it a try.. I just installed and ran the first command I saw... Getting 0 Zero's on the speedtest.. The hostname resolves. This is on a 3200acm.

root@lede:~# speedtest.sh -4 -H netperf-west.bufferbloat.net -p 1.1.1.1 --concurrent
2018-11-07 16:31:50 Starting speedtest for 60 seconds per transfer session.
Measure speed to netperf-west.bufferbloat.net (IPv4) while pinging 1.1.1.1.
Download and upload sessions are concurrent, each with 5 simultaneous streams.
.
 Download:   0.00 Mbps
   Upload:   0.00 Mbps
  Latency: (in msec, 1 pings, 0.00% packet loss)
      Min: 13.650 
    10pct: 0.000 
   Median: 0.000 
      Avg: 13.650 
    90pct: 0.000 
      Max: 13.650
Processor: (in % busy, avg +/- stddev, -1 samples)
 Overhead: (in % total CPU used)
  netperf:  0
root@lede:~# nslookup netperf-west.bufferbloat.net
Server:		127.0.0.1
Address:	127.0.0.1#53

Name:      netperf-west.bufferbloat.net
netperf-west.bufferbloat.net	canonical name = flent-fremont.bufferbloat.net
Name:      flent-fremont.bufferbloat.net
Address 1: 23.239.20.41

EDIT

Thought I'd check since dependent on netperf, and it is there.

root@lede:~# opkg list-installed |grep netperf
netperf - 2.7.0-1
root@lede:~# which netperf
/usr/bin/netperf
1 Like

Thanks for testing that! I've written the script to be as POSIX-compatible as possible, with only the netperf dependency, but didn't have older systems or VMs handy to test against.

@hnyman Thanks, Hannu, for the thorough testing and also posting the detailed results. I'm catching up to your posts en masse so will consolidate my observations.

Yes, on seeing your results, the smoking gun for me was having similar aggregate network throughputs, but with different CPU utilization. This is equivalent to taking much more time to do the same amount of work, and commonly observed benchmarking different speed CPUs. So I think the root problem, as you suggest, is inconsistent CPU frequency scaling.

I expect this has been going on for a long time on R7800 and similar devices, but we've highlighted it again due to the script's CPU monitoring.

A fair question. The script itself is pretty reliable as it actually does no measurements itself, but rather relies on core Linux functionality and other utilities, while calculating summaries of the results. That means:

  1. CPU usage is based on the standard Linux cumulative statistics found in /proc/stat and /proc/<pid>/stat, which is the same information presented by our usual top and htop.

  2. Latency calculation uses the results of ping, the same as the manual tests you made above.

  3. Throughput calculations use the results output from netperf.

I see this very rarely too, during the course of much testing, and it boils down to a problem with netperf. The script kicks off netperf instances configured for a 60-second test, and then waits for them to complete.

If netperf fails to start, that can yield the zeros seen by @davidc502. Similarly, netperf can timeout after a while, or simply take a long time to start up and complete, which can lead to the long runs seen by @hnyman.

It's hard to reproduce (maybe some network problems or the servers?) so I don't precisely know the root cause, but I'll take a look at improving the logging in the script. If either of you can remember/compare notes on the circumstances around the long runs or zero results, please let me know.

@davidc502 Thanks for giving it a try too. Did you manage to successfully retry afterwards?

Thanks again to everyone for the invaluable feedback.