Speedtest: new package to measure network performance

I'm trying to get this script working on my OpenWRT 19.07.1 on a TP-Link Archer C7 v2.

I've installed the required packages, however whenever I run a test I get this:
0 Mbps up/down

speedtest-netperf.sh -H netperf-east.bufferbloat.net -p 1.1.1.1 --concurrent

2020-02-12 11:08:13 Starting speedtest for 60 seconds per transfer session.
Measure speed to netperf-east.bufferbloat.net (IPv4) while pinging 1.1.1.1.
Download and upload sessions are concurrent, each with 5 simultaneous streams.
...................................................................................................................................
WARNING: netperf returned errors. Results may be inaccurate!

 Download:   0.00 Mbps
   Upload:   0.00 Mbps
  Latency: [in msec, 132 pings, 0.00% packet loss]
      Min:  17.630
    10pct:  17.839
   Median:  18.447
      Avg:  18.508
    90pct:  19.138
      Max:  20.272
 CPU Load: [in % busy (avg +/- std dev), 129 samples]
     cpu0:  14.6 +/- 20.1
 Overhead: [in % used of total CPU available]
  netperf:   1.4

To troubleshoot I used the suggestions posted within this dicussion:

ping netperf-east.bufferbloat.net
PING netperf-east.bufferbloat.net (23.226.232.80): 56 data bytes
64 bytes from 23.226.232.80: seq=0 ttl=55 time=45.363 ms
64 bytes from 23.226.232.80: seq=1 ttl=55 time=45.899 ms
64 bytes from 23.226.232.80: seq=2 ttl=55 time=46.087 ms
64 bytes from 23.226.232.80: seq=3 ttl=55 time=44.909 ms

and ping

ping gstatic.com
PING gstatic.com (172.217.7.163): 56 data bytes
64 bytes from 172.217.7.163: seq=0 ttl=50 time=28.128 ms
64 bytes from 172.217.7.163: seq=1 ttl=50 time=27.882 ms
64 bytes from 172.217.7.163: seq=2 ttl=50 time=27.548 ms

and checked what's installed:

 opkg list-installed |grep netperf
netperf - 2.7.0-1
speedtest-netperf - 1.0.0-1
root@GateKeeper:~# which netperf
/usr/bin/netperf

and nslookups:

nslookup netperf.bufferbloat.net
Server:         127.0.0.1
Address:        127.0.0.1#53

Name:      netperf.bufferbloat.net
netperf.bufferbloat.net canonical name = netperf.richb-hanover.com
Name:      netperf.richb-hanover.com
netperf.richb-hanover.com       canonical name = atl.richb-hanover.com
Name:      atl.richb-hanover.com
Address 1: 23.226.232.80
netperf.bufferbloat.net canonical name = netperf.richb-hanover.com
netperf.richb-hanover.com       canonical name = atl.richb-hanover.com

and

nslookup gstatic.com
Server:         127.0.0.1
Address:        127.0.0.1#53

Name:      gstatic.com
Address 1: 172.217.7.163
Address 2: 2607:f8b0:4004:800::2003

and ran netperf directly and got:

netperf -4 -H netperf.bufferbloat.net -t TCP_STREAM -l 10 -d
resolve_host called with host 'netperf.bufferbloat.net' port '(null)' family AF_INET
getaddrinfo returned the following for host 'netperf.bufferbloat.net' port '(null)'  family AF_INET
        cannonical name: 'atl.richb-hanover.com'
        flags: 0 family: AF_INET: socktype: SOCK_STREAM protocol IPPROTO_TCP addrlen 16
        sa_family: AF_INET sadata: 0 0 23 226 232 80 0 0 0 0 0 0 0 0 0 0
scan_omni_args called with the following argument vector
netperf -4 -H netperf.bufferbloat.net -t TCP_STREAM -l 10 -d
sizeof(omni_request_struct)=200/648
sizeof(omni_response_struct)=204/648
sizeof(omni_results_struct)=284/648
Program name: netperf
Local send alignment: 8
Local recv alignment: 8
Remote send alignment: 8
Remote recv alignment: 8
Local socket priority: -1
Remote socket priority: -1
Local socket TOS: cs0
Remote socket TOS: cs0
Report local CPU 0
Report remote CPU 0
Verbosity: 1
Debug: 1
Port: 12865
Test name: TCP_STREAM
Test bytes: 0 Test time: 10 Test trans: 0
Host name: netperf.bufferbloat.net

installing catcher for all signals
Could not install signal catcher for sig 32, errno 22
Could not install signal catcher for sig 33, errno 22
Could not install signal catcher for sig 34, errno 22
Could not install signal catcher for sig 128, errno 22
remotehost is netperf.bufferbloat.net and port 12865
resolve_host called with host 'netperf.bufferbloat.net' port '12865' family AF_INET
getaddrinfo returned the following for host 'netperf.bufferbloat.net' port '12865'  family AF_INET
        cannonical name: 'atl.richb-hanover.com'
        flags: 0 family: AF_INET: socktype: SOCK_STREAM protocol IPPROTO_TCP addrlen 16
        sa_family: AF_INET sadata: 50 65 23 226 232 80 0 0 0 0 0 0 0 0 0 0
resolve_host called with host '0.0.0.0' port '0' family AF_INET
getaddrinfo returned the following for host '0.0.0.0' port '0'  family AF_INET
        cannonical name: '0.0.0.0'
        flags: 0 family: AF_INET: socktype: SOCK_STREAM protocol IPPROTO_TCP addrlen 16
        sa_family: AF_INET sadata: 0 0 0 0 0 0 0 0 0 0 0 0 0 0 0 0
establish_control called with host 'netperf.bufferbloat.net' port '12865' remfam AF_INET
                local '0.0.0.0' port '0' locfam AF_INET
bound control socket to 0.0.0.0 and 0
establish_control: connect failed, errno 146 Connection refused
    trying next address combination
establish control: are you sure there is a netserver listening on netperf.bufferbloat.net at port 12865?
establish_control could not establish the control connection from 0.0.0.0 port 0 address family AF_INET to netperf.bufferbloat.net port 12865 address family AF_INET

seems my error is:

establish_control called with host 'netperf.bufferbloat.net' port '12865' remfam AF_INET
                local '0.0.0.0' port '0' locfam AF_INET
bound control socket to 0.0.0.0 and 0
establish_control: connect failed, errno 146 Connection refused
    trying next address combination
establish control: are you sure there is a netserver listening on netperf.bufferbloat.net at port 12865?
establish_control could not establish the control connection from 0.0.0.0 port 0 address family AF_INET to netperf.bufferbloat.net port 12865 address family AF_INET

I am using unbound on port 53 for my DNS (forward to TLS provider) and dnsmask on port 1053 for local DNS.

Any suggestions?

Thanks!

So, that server is payed for personally by forum admin/member @richb-hannover-priv (thanks Rich!) and according to a post further above is exceeding it's monthly traffic volume earlier and earlier. I would coutiously recommend to either wait and try again next month or setup your own netperf serves in a cloud hosted server, just make sure the VM has sufficient amounts of bandwidth allocated. Sorry for not having better news...

thanks for the quick reply! I must have missed that post about exceeding it's monthly bandwidth. At least I know it's nothing wrong with my setup! :wink:
I'll see if I can somehow perform these tests some other way! Trying to setup SQM.

While not as nice as netperf the dslteports Speedtest is a reasonable "yardstick" to use while tuning SQM. See https://forum.openwrt.org/t/sqm-qos-recommended-settings-for-the-dslreports-speedtest-bufferbloat-testing/2803 for how to get the most out of that test....
Good luck!

Am I the only one for whom the dslreports test doesn't work for bufferbloat at all on Firefox? I remember reading somewhere it had to do with them not updating their certificates, so the bufferbloat code can't connect because of expired certs.

Edit: tested under chromium and it doesn't work there either... what happens is the bufferbloat meter shows up for about 1/2 second, and then blinks out of existence... and I don't get bufferbloat stats.

:slight_smile:

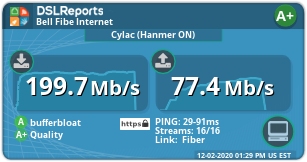
59518605
https://www.dslreports.com/speedtest/59518605

These are the results I got on my Bell Fibe 500 package which is FTTH using pppoe

Originally my fiber was going straight to my HH3000 from Bell. I took the fiber out and hooked up a tp-link fiber-to-ether switch! Now I have my own router (TP-Link Archer C7 v2/OpenWRT 19.07.1) for internet and the HH3000 for TV.

I ran the deslreports test from my Windows 10 Pro desktop which is connected to my router via a tp-link hydro-ethernet adapter.

Yep, a C7 isn't going to keep up with 500Mbps fiber. Take a look here for a good alternative: RPi4 routing performance numbers you can keep the C7 as an access point though.

hmm that's quite interesting! I've never used those devices before. I keep on hearing how amazing they are for many things.
I'd need a pretty good HOW-TO-GUIDE in order to get one setup properly. :wink:
What hardware do you have exactly? I'm intrigue by all of this now! lol

It's a CanaKit RPi 4B package + a TP-link Ue300 USB 3 ethernet device for the WAN port.

For me, It's actually not running OpenWrt, but rather Raspbian, but snapshots support OpenWrt. you can just image the snapshot to the SD card using Balena Etcher:

OpenWrt image is here:

https://downloads.openwrt.org/snapshots/targets/brcm2708/bcm2711/

CanaKit comes with a power supply, case, SD card, etc all for about $100. It's substantially simpler than many routers because the SD card is removable so you can never brick the thing (worst case just put a different SD card in).

Speed is terrific. I was a little hesitant about the USB dongle, but sitting in my closet connected to the ISP device, it's been totally fine for 10 days straight.

1 Like

Awesome thanks for the info! I think I may have found my next home network project lol
I’m sure my wife will be thrilled! :crazy_face:

I’ll let you know how it goes.. and may “bug” you if I get stuck! :wink:

You have to change it to a server that supports the bufferbloat test

No idea, just did a test on firefox on macosx and speedtest and bufferbloat test/plots just worked. BTW, sorry for the dalay, I had not seen your post...

That is possible that my set of servers accidentally supports the bufferbloat probe, but in todays test I did not even log in and hence got the default servers:

0.00s Start testing Cable
00.42s Servers available: 3
00.46s pinging 3 locations
05.46s 54ms Amsterdam, Netherlands, EU
05.46s 222ms Houston, USA
05.47s 262ms San Jose, USA
05.48s 5 seconds measuring idle buffer bloat
11.05s Trial download normal
11.08s Using GET for upload testing
11.08s preference https set to 1
19.34s  stream0 9.4 megabit Amsterdam, Netherlands, EU
19.34s  stream1 1.02 megabit Amsterdam, Netherlands, EU
19.34s  stream2 10.94 megabit Amsterdam, Netherlands, EU
19.34s  stream3 8.85 megabit Amsterdam, Netherlands, EU
19.34s  stream4 1.06 megabit Amsterdam, Netherlands, EU
19.34s  stream5 0.44 megabit Houston, USA
19.34s  stream6 0.97 megabit Amsterdam, Netherlands, EU
19.34s  stream7 0.44 megabit Houston, USA
19.34s  stream8 0.38 megabit Houston, USA
19.34s  stream9 0.46 megabit Houston, USA
19.34s  stream10 0.43 megabit Houston, USA
19.34s  stream11 0.37 megabit San Jose, USA
19.34s  stream12 2.59 megabit Houston, USA
19.34s  stream13 0.4 megabit San Jose, USA
19.34s  stream14 2.22 megabit San Jose, USA
19.34s  stream15 0.51 megabit San Jose, USA
23.34s End of download testing. Starting upload in 2 seconds
25.34s Using POST for upload testing
38.71s Upload report:
38.71s  stream0 6.5 megabit Amsterdam, Netherlands, EU
38.71s  stream1 7.83 megabit Amsterdam, Netherlands, EU
38.71s  stream2 6.02 megabit Amsterdam, Netherlands, EU
38.71s  stream3 8.15 megabit Amsterdam, Netherlands, EU
44.78s End of upload testing
44.79s Recording upload  28.6
44.79s Timer drops: frames=0 total ms=0 slip=0
44.79s END TEST
46.79s Total megabytes consumed: 117.7 (down:53.9 up:63.8)

From the RTT I assume the bufferbloat probes were run against the Amsterdam Servers (with me being in Germany that makes more sense than going to the US)

Does this script still work? I ran this and got similar errors "WARNING: netperf returned errors. Results may be inaccurate!"

1 Like

I seem to have the same problem. I tried all the servers I could find in the discussion above:

And all of them give me this error:
WARNING: netperf returned errors. Results may be inaccurate!

And show 0.00 Mbps for upload and download.

All 3 are still online (I can ping them) but maybe they don't reply in the way this script expects?

I'm having the same issue.. not sure when the issue started (but probably within the past 1-2 weeks), I seldom run speedtest-netperf.sh

[#]# speedtest-netperf.sh
2020-09-22 13:31:40 Starting speedtest for 60 seconds per transfer session.
Measure speed to netperf.bufferbloat.net (IPv4) while pinging gstatic.com.
Download and upload sessions are sequential, each with 5 simultaneous streams.
..
WARNING: netperf returned errors. Results may be inaccurate!

 Download:   0.00 Mbps
  Latency: [in msec, 2 pings, 0.00% packet loss]
      Min:  17.401
    10pct:   0.000
   Median:   0.000
      Avg:  17.575
    90pct:   0.000
      Max:  17.750
 CPU Load: [in % busy (avg +/- std dev), 0 samples]
 Overhead: [in % used of total CPU available]
  netperf:   0.0
.
WARNING: netperf returned errors. Results may be inaccurate!

   Upload:   0.00 Mbps
  Latency: [in msec, 1 pings, 0.00% packet loss]
      Min:  17.551
    10pct:   0.000
   Median:   0.000
      Avg:  17.551
    90pct:   0.000
      Max:  17.551
 CPU Load: [in % busy (avg +/- std dev), 0 samples]
 Overhead: [in % used of total CPU available]
  netperf:   0.0```

The issue is, all of these measurement servers have been set-up, maintained, and financed by private volunteers. That really is no way to operate unless loads of sites volunteer, like is the case with Ookla's speedtest.net.
For machines with a full linux distribution, one could try to replace netperf with speedtest-cli, as a means to generate load, but directly on a small OpenWrt router not so much....
Another option would be to generate the load from a different computer and run the bufferbloat probes still from the router, where one can also measure the traffic.

Adding two options would be nice to use this in other scripts (tweaking SQM for instance):

  1. json output with no progress to stdout to ease scripting
  2. Choice of units in output like bits/s and/or Kbit/s
1 Like

TP-Link Archer C7 v5, installed remotely. Unknown speed local fibre connection. with Gwlim's most recent SFE OpenWrt snapshot build:

root@ap1:/tmp# speedtest-netperf.sh -H netperf-eu.bufferbloat.net -p 1.1.1.1 --sequential
2021-02-09 21:56:15 Starting speedtest for 60 seconds per transfer session.
Measure speed to netperf-eu.bufferbloat.net (IPv4) while pinging 1.1.1.1.
Download and upload sessions are sequential, each with 5 simultaneous streams.
............................................................
 Download: 185.65 Mbps
  Latency: [in msec, 61 pings, 0.00% packet loss]
      Min:   1.781
    10pct:   2.549
   Median:   5.684
      Avg:   5.930
    90pct:   8.406
      Max:  16.810
 CPU Load: [in % busy (avg +/- std dev), 56 samples]
     cpu0:  98.4 +/-  0.5
 Overhead: [in % used of total CPU available]
  netperf:  74.0
..........................................................
   Upload: 143.95 Mbps
  Latency: [in msec, 60 pings, 0.00% packet loss]
      Min:   1.747
    10pct:   2.104
   Median:   3.694
      Avg:  10.916
    90pct:  32.139
      Max:  67.951
 CPU Load: [in % busy (avg +/- std dev), 55 samples]
     cpu0: 100.0 +/-  0.0
 Overhead: [in % used of total CPU available]
  netperf:  76.8

with Netgear R7800 and fiber 600/600 O2 Spain server EU

root@R7800:~# speedtest-netperf.sh -H netperf-eu.bufferbloat.net
2021-08-24 17:16:45 Starting speedtest for 60 seconds per transfer session.
Measure speed to netperf-eu.bufferbloat.net (IPv4) while pinging gstatic.com.
Download and upload sessions are sequential, each with 5 simultaneous streams.
............................................................
 Download: 604.42 Mbps
  Latency: [in msec, 61 pings, 0.00% packet loss]
      Min:   9.288
    10pct:  10.876
   Median:  60.347
      Avg:  54.842
    90pct:  67.735
      Max:  74.628
 CPU Load: [in % busy (avg +/- std dev) @ avg frequency, 56 samples]
     cpu0:  84.2 +/-  0.0  @ 1707 MHz
     cpu1:  93.9 +/-  0.0  @ 1713 MHz
 Overhead: [in % used of total CPU available]
  netperf:  54.5
............................................................
   Upload: 523.52 Mbps
  Latency: [in msec, 61 pings, 0.00% packet loss]
      Min:   9.688
    10pct:  13.356
   Median:  23.195
      Avg:  22.467
    90pct:  29.611
      Max:  35.076
 CPU Load: [in % busy (avg +/- std dev) @ avg frequency, 56 samples]
     cpu0:  67.8 +/-  3.1  @ 1650 MHz
     cpu1:  95.9 +/-  0.0  @ 1685 MHz
 Overhead: [in % used of total CPU available]
  netperf:  26.8
root@R7800:~# date
Tue Aug 24 17:19:18 CEST 2021

root@R7800:~# cat /sys/devices/system/cpu/cpufreq/policy*/scaling_governor
ondemand
ondemand

MikroTik RB450G, factory clock, vanilla 19.07.8, SH/HW flow offloading enabled

BusyBox v1.30.1 () built-in shell (ash)

  _______                     ________        __
 |       |.-----.-----.-----.|  |  |  |.----.|  |_
 |   -   ||  _  |  -__|     ||  |  |  ||   _||   _|
 |_______||   __|_____|__|__||________||__|  |____|
          |__| W I R E L E S S   F R E E D O M
 -----------------------------------------------------
 OpenWrt 19.07.8, r11364-ef56c85848
 -----------------------------------------------------
root@mikropocok:~# vi /etc/config/network
root@mikropocok:~# speedtest-netperf.sh -H netperf-eu.bufferbloat.net -p 1.1.1.1 --sequential
2021-09-10 14:46:16 Starting speedtest for 60 seconds per transfer session.
Measure speed to netperf-eu.bufferbloat.net (IPv4) while pinging 1.1.1.1.
Download and upload sessions are sequential, each with 5 simultaneous streams.
............................................................
 Download: 142.65 Mbps
  Latency: [in msec, 61 pings, 0.00% packet loss]
      Min:  19.634
    10pct:  20.568
   Median:  21.579
      Avg:  22.360
    90pct:  24.116
      Max:  34.342
 CPU Load: [in % busy (avg +/- std dev), 57 samples]
     cpu0:  99.5 +/-  0.7
 Overhead: [in % used of total CPU available]
  netperf:  68.0
............................................................
   Upload: 126.36 Mbps
  Latency: [in msec, 61 pings, 0.00% packet loss]
      Min:  18.638
    10pct:  18.959
   Median:  20.352
      Avg:  22.169
    90pct:  26.650
      Max:  39.456
 CPU Load: [in % busy (avg +/- std dev), 58 samples]
     cpu0:  85.7 +/-  5.5
 Overhead: [in % used of total CPU available]
  netperf:  23.6

Not sure why, but as it can be seen for the user who commented above before me, he is using the same server: netperf-eu.bufferbloat.net, but he gets better results, even though theoretically I have gigabit fibre. Fast.com shows me around 850+ Mbps.