Hi guys,
I am wondering how can I simulate a latency and a packet loss.
I am having problems with the connection to a PLC in another country and I would like to simulate that in the office.
It is connected via OpenVPN and the Internet connection to the router is via GSM USB Stick in modem mode. The PLC is connected to br-lan via eth0.2.
I have already tried tc qdisc, but it throughs the following error.
tc qdisc add dev tun1 root handle 2: htb default 12

tc class add dev tun1 parent 2:1 classid 2:12 htb rate 3000kbps ceil 3000kbps

tc qdisc add dev tun1 parent 2:12 netem delay 60ms 10ms 25% loss 0.5%
RTNETLINK answers: No such file or directory
tc qdisc add dev eth0.2 root handle 2: htb default 12

tc class add dev eth0.2 parent 2:1 classid 2:12 htb rate 3000kbps ceil 3000kbps

:~# tc qdisc add dev eth0.2 parent 2:12 netem delay 60ms 10ms 25% loss 0.5%
RTNETLINK answers: No such file or directory
So far as I read is there a kernel module missing.
Do I have to compile my own kernel, or is there any other way?
3g-wan_3g Link encap:Point-to-Point Protocol
          inet addr:46.67.82.127  P-t-P:10.64.64.64  Mask:255.255.255.255
          UP POINTOPOINT RUNNING NOARP MULTICAST  MTU:1500  Metric:1
          RX packets:414786 errors:0 dropped:0 overruns:0 frame:0
          TX packets:453253 errors:0 dropped:0 overruns:0 carrier:0
          collisions:0 txqueuelen:3
          RX bytes:73361268 (69.9 MiB)  TX bytes:117071211 (111.6 MiB)

br-lan    Link encap:Ethernet  HWaddr 64:70:02:AA:C1:24
          inet addr:10.1.222.254  Bcast:10.1.222.255  Mask:255.255.255.0
          inet6 addr: fdea:1c68:ee3a::1/60 Scope:Global
          inet6 addr: fe80::6670:2ff:feaa:c124/64 Scope:Link
          UP BROADCAST RUNNING MULTICAST  MTU:1500  Metric:1
          RX packets:109786 errors:0 dropped:0 overruns:0 frame:0
          TX packets:82766 errors:0 dropped:0 overruns:0 carrier:0
          collisions:0 txqueuelen:1000
          RX bytes:21737737 (20.7 MiB)  TX bytes:5884712 (5.6 MiB)

eth0      Link encap:Ethernet  HWaddr 64:70:02:AA:C1:24
          inet6 addr: fe80::6670:2ff:feaa:c124/64 Scope:Link
          UP BROADCAST RUNNING MULTICAST  MTU:1500  Metric:1
          RX packets:109801 errors:0 dropped:0 overruns:0 frame:0
          TX packets:106019 errors:0 dropped:0 overruns:0 carrier:0
          collisions:0 txqueuelen:1000
          RX bytes:23715095 (22.6 MiB)  TX bytes:14164134 (13.5 MiB)
          Interrupt:4

eth0.1    Link encap:Ethernet  HWaddr 64:70:02:AA:C1:24
          UP BROADCAST RUNNING MULTICAST  MTU:1500  Metric:1
          RX packets:109786 errors:0 dropped:0 overruns:0 frame:0
          TX packets:82766 errors:0 dropped:0 overruns:0 carrier:0
          collisions:0 txqueuelen:1000
          RX bytes:21737737 (20.7 MiB)  TX bytes:5884712 (5.6 MiB)

eth0.2    Link encap:Ethernet  HWaddr 64:70:02:AA:C1:24
          inet6 addr: fe80::6670:2ff:feaa:c124/64 Scope:Link
          UP BROADCAST RUNNING MULTICAST  MTU:1500  Metric:1
          RX packets:0 errors:0 dropped:0 overruns:0 frame:0
          TX packets:23239 errors:0 dropped:0 overruns:0 carrier:0
          collisions:0 txqueuelen:1000
          RX bytes:0 (0.0 B)  TX bytes:7853986 (7.4 MiB)

lo        Link encap:Local Loopback
          inet addr:127.0.0.1  Mask:255.0.0.0
          inet6 addr: ::1/128 Scope:Host
          UP LOOPBACK RUNNING  MTU:65536  Metric:1
          RX packets:156880 errors:0 dropped:0 overruns:0 frame:0
          TX packets:156880 errors:0 dropped:0 overruns:0 carrier:0
          collisions:0 txqueuelen:1
          RX bytes:14461940 (13.7 MiB)  TX bytes:14461940 (13.7 MiB)

tun1      Link encap:UNSPEC  HWaddr 00-00-00-00-00-00-00-00-00-00-00-00-00-00-00-00
          inet addr:10.102.0.21  P-t-P:10.102.0.21  Mask:255.255.0.0
          inet6 addr: fe80::b4d2:a44:3d31:94ce/64 Scope:Link
          UP POINTOPOINT RUNNING NOARP MULTICAST  MTU:1500  Metric:1
          RX packets:406791 errors:0 dropped:0 overruns:0 frame:0
          TX packets:433355 errors:0 dropped:0 overruns:0 carrier:0
          collisions:0 txqueuelen:100
          RX bytes:48343332 (46.1 MiB)  TX bytes:95504168 (91.0 MiB)

wlan0     Link encap:Ethernet  HWaddr 64:70:02:AA:C1:25
          inet6 addr: fe80::6670:2ff:feaa:c125/64 Scope:Link
          UP BROADCAST RUNNING MULTICAST  MTU:1500  Metric:1
          RX packets:0 errors:0 dropped:0 overruns:0 frame:0
          TX packets:15604 errors:0 dropped:0 overruns:0 carrier:0
          collisions:0 txqueuelen:1000
          RX bytes:0 (0.0 B)  TX bytes:1237734 (1.1 MiB)
Oh boy, I found it right after I created this post here:
opkg install kmod-netem
1 Like
All traffic
WANIF="eth0.2"
iptables -A INPUT -i $WANIF -m statistic --mode random --probability 0.4 -j DROP
ICMP
iptables -A INPUT -i $WANIF -m statistic --mode random --probability 0.4 -p ICMP -j DROP
#!/bin/sh
WANIF="eth0.2"

iptables -N FUZZLIMIT
iptables -A INPUT -i $WANIF -j FUZZLIMIT


while true
do
	RAND1=`awk -v min=2 -v max=35 'BEGIN{srand(); print int(min+rand()*(max-min+1))}'`
	sleep 1
	RAND2=`awk -v min=2 -v max=20 'BEGIN{srand(); print int(min+rand()*(max-min+1))}'`

	iptables -F FUZZLIMIT
	iptables -A FUZZLIMIT -m limit --limit $RAND1/sec --limit-burst $RAND2 -j ACCEPT
	iptables -A FUZZLIMIT -j DROP

done
2 Likes
These iptables rules will give very uniformly distributed losses that will likely be very different from the kinds of bursty noisy results that occur on an across the world connection, the netem supports more sophisticated models of loss and delay.
2 Likes
Even when I add just a 2ms delay, then I get a lot of errors in Wireshark on my FTP transfer.
tc qdisc add dev tun1 root netem delay 2ms 1ms 25%
Why could this be?
I am connected like this:
Win10 PC (10.102.0.43) -> OpenVPN Server <- OpenWRT Router (10.1.222.254) <- PLC (10.1.222.1)
The PC and the router dial into the OpenVPN server and the traffic gets routet from the PC via the OpenVPN server to the OpenWRT router and there is the PLC connected.
There are lots of warnings about duplicates acks and out of order packets. I'm not quite sure what netem does with delay, but if you add delays that are variable and 25% correlated, is it possible that reordering is going on? ie. packet 1 is delayed say 3ms and packet 2 is delayed only 2ms and so packet 2 arrives before packet 3?
It looks like, when I run tc qdisc add dev tun1 root netem delay 100ms only then everything is fine.
Is this only like a warning, or has this any influence on the traffic speed?
So far as I know can packets take different ways to their target in the Internet and I guess this can happen then also.
Reordering is possible but usually rare over the internet, and yes it does affect TCP by increasing retries and reducing throughput
I did some tests:
FTP transfer ~4 MB File:
Without any manipulation
iperf3: ~ 4,3 MBit/s
Idle latency: 55ms
Router -> PC 12s
PLC -> PC: 8s
tc qdisc add dev tun1 root netem delay 100ms
iperf3: ~ 3,3 MBit/s
Idle latency: 145ms
Router -> PC: 7s
PLC -> PC:9s
tc qdisc add dev tun1 root netem delay 100ms 3ms 25%
iperf3: ~ 3,5 MBit/s
Idle latency: 154ms
Router -> PC: 7s
PLC -> PC: 88s
Why has it such an influence on the transfer from the PLC, but not from the router?
This is only my test setup here, but I guess this (packet re-ordering) happens on the remote site as well.
Is something wrong with the PLC?
I even did not test any packet drops so far, but I guess it will get worse then.
Well I assume PLC means programmable logic controller, a kind of industrial control machine. I'm guessing its TCP implementation is probably not super sophisticated so it handles reordering and jitter poorly.
This is correct, it is a X20XP3584 from B&R.
So far as I know is it based on VxWorks.
I just did a test with the devices on site.
There is the PLC on site as well as a PC and I did a FTP upload from the PC, which took about 10s.
Then I did the FTP upload from the PLC, which took 441s.
After a couple seconds the PLC upload went down to 500 Byte/s and it stayed there for a long time.
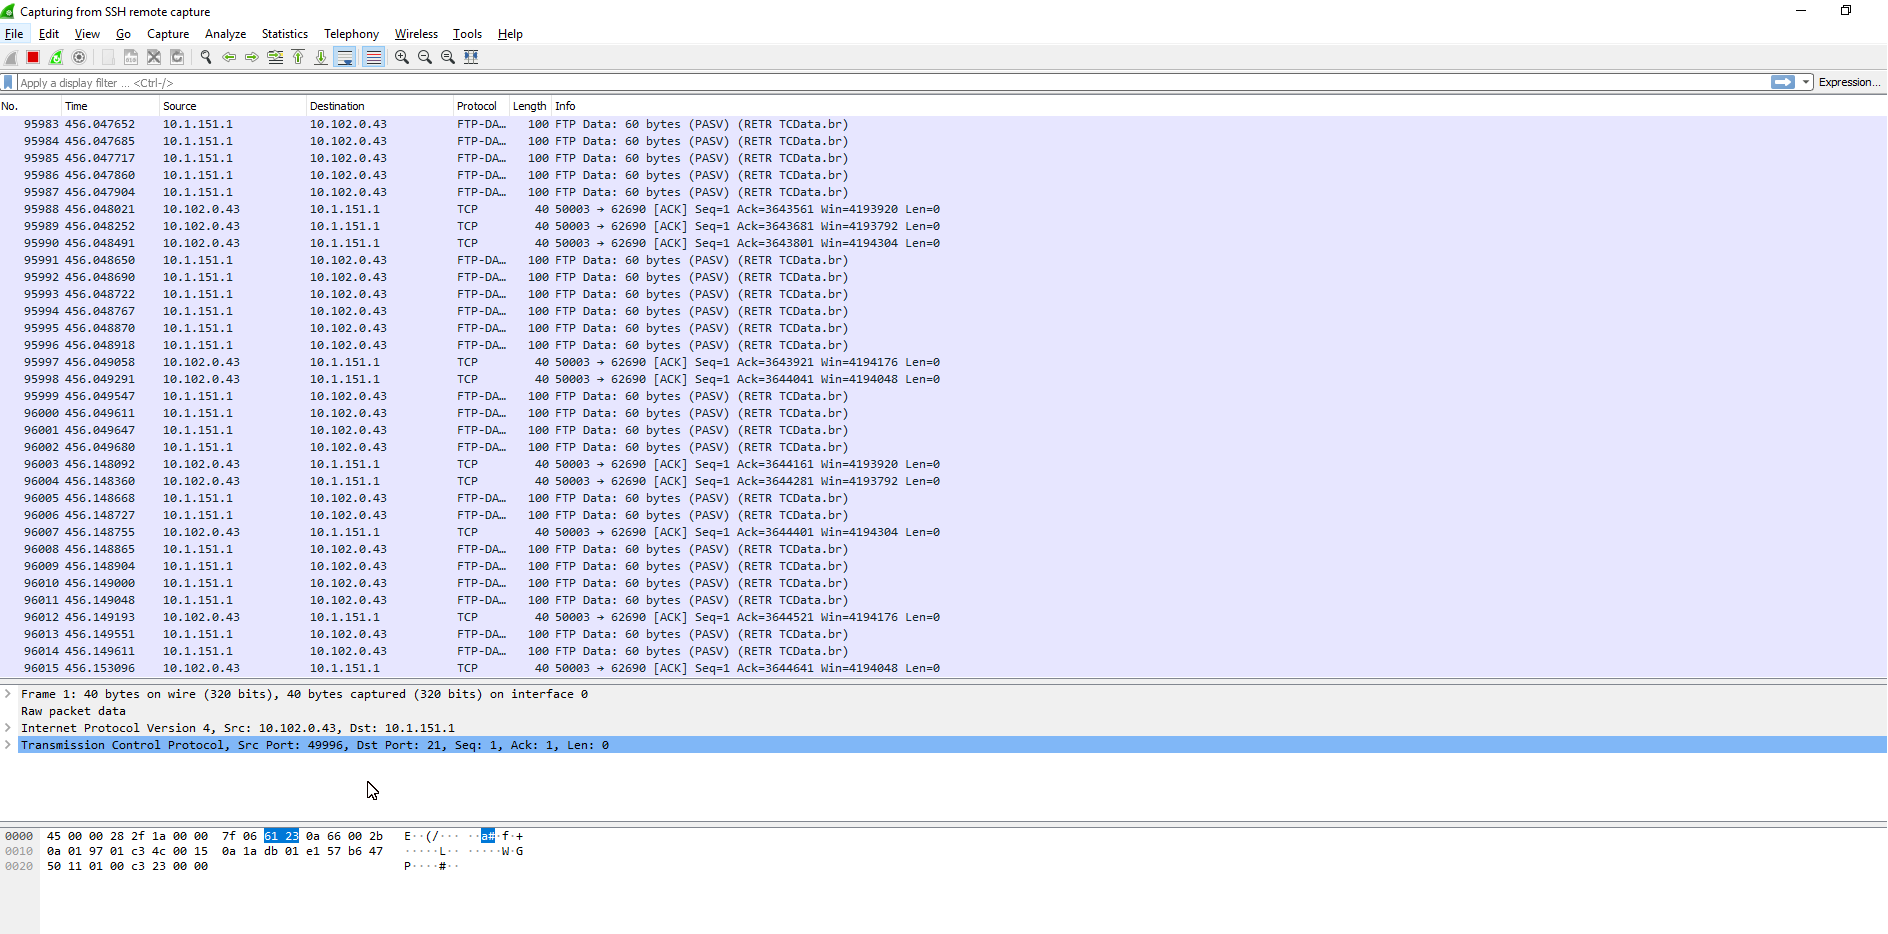
This was shown in wireshark:
Then after a couple minutes it went faster and this was shown in wireshark:
It still showed some errors (not shown on this screenshot) but not so much.
These are the Wirshark files if you are interested.
I'd take a guess at routines beyond network on the PLC.
What are it's priorities beyond getting data out / the type of data it gets out.....
Checkout if the delay effects the payloads, Chance that's why there is a need for these tests in the first place?
Can you tell me which IP is the PC and which is the PLC?
Sure, sorry forgot to mention.
10.1.151.1 - PLC on site (FTP server)
10.1.151.50 - PC on site (FTP server)
10.102.0.43 - PC at home (FTP client, does the upload)
Traceroute from PC at home.
  1     8 ms     8 ms     *     10.102.0.1
  2   105 ms   102 ms   106 ms  10.102.0.38
  3   131 ms   102 ms   106 ms  10.1.151.1
I'm not an expert on the details of the TCP protocol but the general idea is that you send some data and look for acknowledgements and then retransmit data that you're not seeing acknowledgements for.
I actually downloaded your capture file, and at about packet 4428 things go very haywire. The PLC starts sending tons of out-of-order packets, and then the PC starts flooding the link with duplicate ACKS which the PLC doesn't respond to. At this point in time I'm guessing either the PLC has locked up, or its wires are faulty and its not receiving the acks, or it has 100% packet loss for a while... or its sending and there's 100% packet loss coming back to the PC or something.
I'd check by replacing ethernet cables and checking that power to your switches and things like that are not problematic.
Finally, it looks like the "packet loss" takes from 19.527 seconds til 19.864 seconds, so around 340ms or whatever. This is the kind of thing that could be caused by bufferbloat. Did you possibly have some other major transfer going on on your PC / home network or on the business network at the other end? Maybe the "apparent packet loss" is really just that some other flow came through your router, filled up a 350ms buffer, and all of a sudden where you used to have 1ms between data and acknowledgement, you had 350, and the PLC couldn't handle that level of jitter.
If bufferbloat is the issue, you can definitely get better results with SQM.
2 Likes
The upload from the PLC to the local PC works fine, it is done in 1-2s, so I don't think it is the Ethernet cable which causes the issue.
I can run a ping to the PLC with a normal latency at the same time when the upload stucks as well as I can run a iperf3 test at the same time which is showing a available bandwith of ~3MBit/s.
There is no one on site right now who could use the Internet there as well as on my side.
I actually already tried to setup SQM at 2.5 MBit/s, but with no effect.
So I don't think that the Internet line is overloaded.
It also is taking long with my test PLC at home, when I setup the router-delay with some random delays, which causes a re-order of the packets, so I guess this is it what causes the problem somehow, probably caused by an incorrect handling of the PLC.
I just have to find out what it is exactly doing wrong that I can tell it the manufactuer.
Probably handing them that packet capture will go a long way towards them understanding what behavior you're seeing.
As a work-around I can imagine that if you can do your transfers over HTTP you could put a proxy between the PLC and the internet. It would then talk to the Proxy over a local link, and the Proxy could run a more up-to-date OS and handle the noisy weird internet link better... squid might even be able to do this for FTP.
The actual problem startet that I had a very slow and often interrupted online connection to the PLC. The FTP transfer is not required in normal operation, it is only for debugging purposes.
I just noticed, that the packet size from the PC is only 536 byte and it is only 60 (!) byte from the PLC.
The MTU on the plant network should be 1500 and at the OpenVPN client iin the plant router is set to option fragment '1344' as well as option mssfix '1'
A am able to get 1472 bytes from both sides to the OpenVPN server via the Internet.
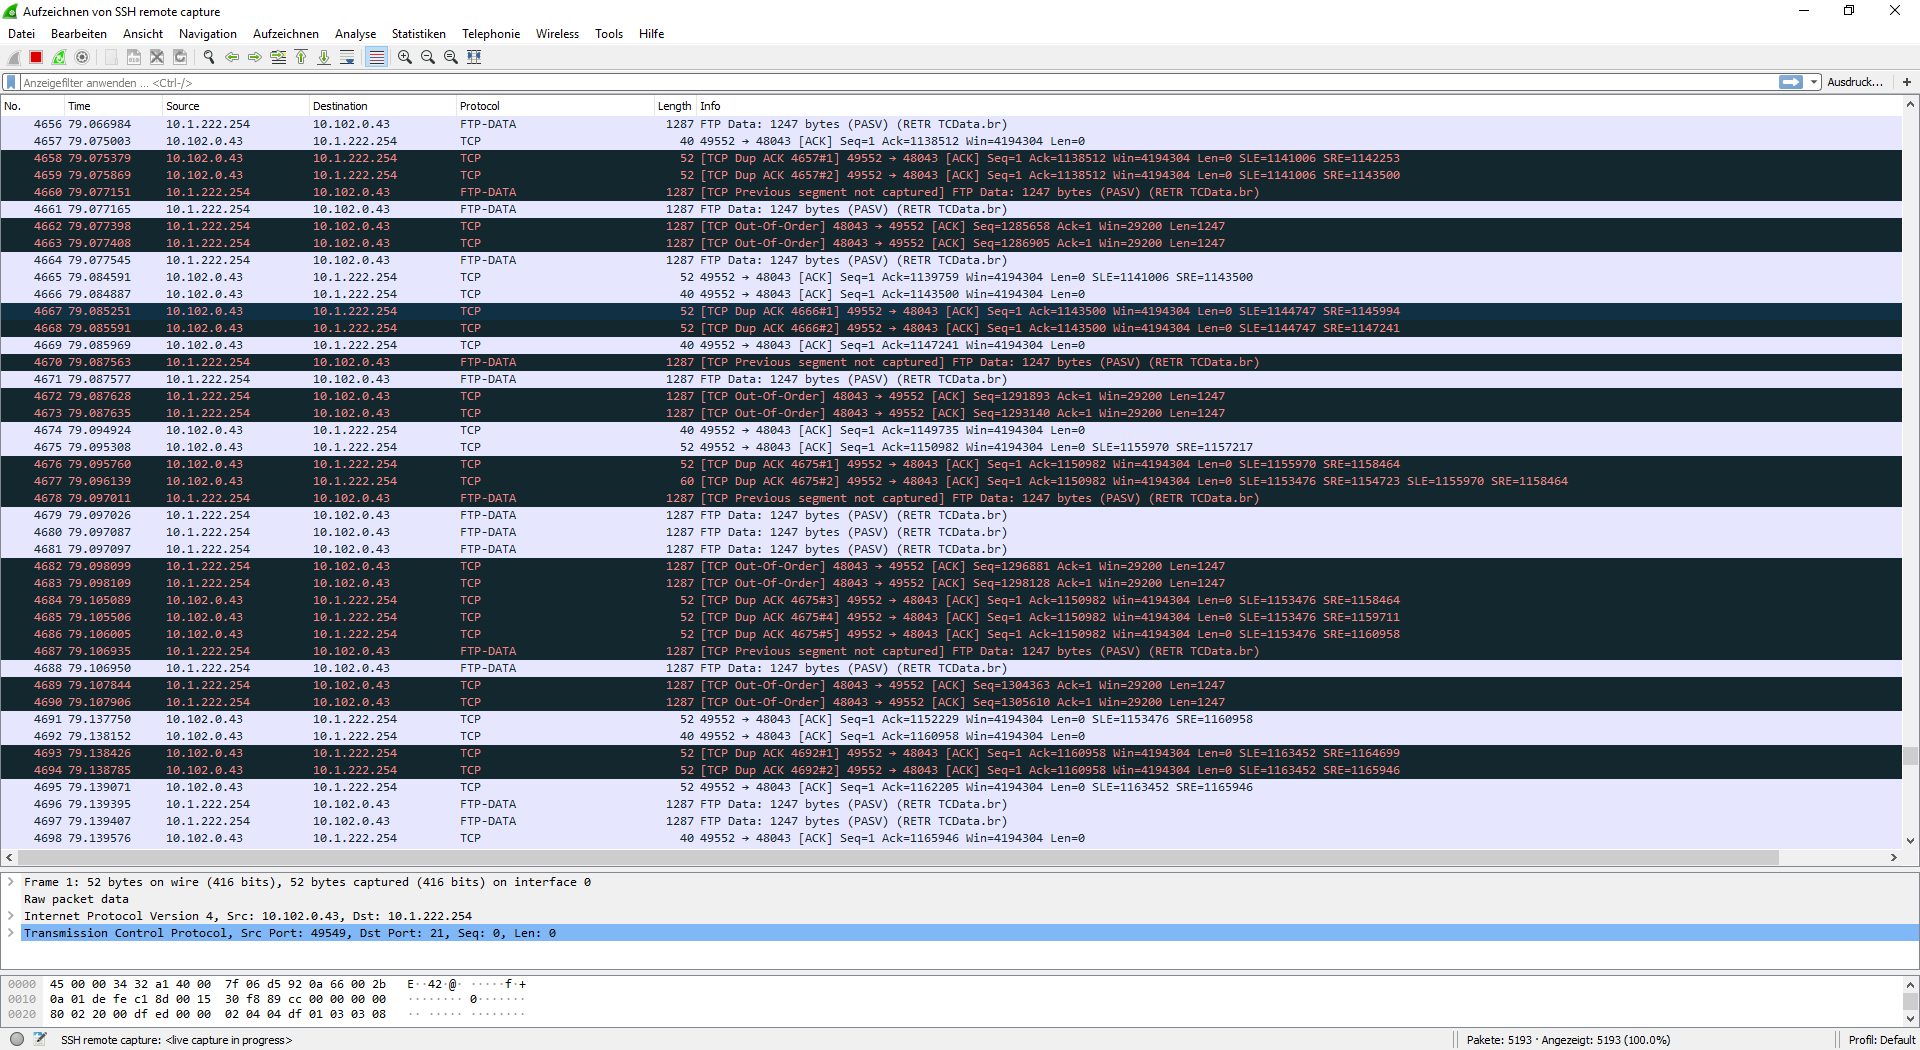
Interesting thing, my test-router as well as my test-plc get 1247 byte trough.
These are my Wireshark files from my test setup.
10.1.222.1 Test-PLC
10.1.222.254 Test-Router
I think there a two separate problems.
One is how out-of-order packets get handled and the other one looks like a MSS issue, where the Filezilla FTP server on the Windows PC drops the packet size to 536 byte, but the PLC drops it to 60, what is probably not conform with the RFCs. This MMS issue is only on site, but not at my test environment.
https://osqa-ask.wireshark.org/questions/24275/tcp-retransmission-with-a-delay-time-of-two-seconds
In general it seems like vxWorks is subject to quirky behavior in its network stack and is probably not terribly well maintained. The second link sounds very much like what you experience, not really sure though
.
1 Like