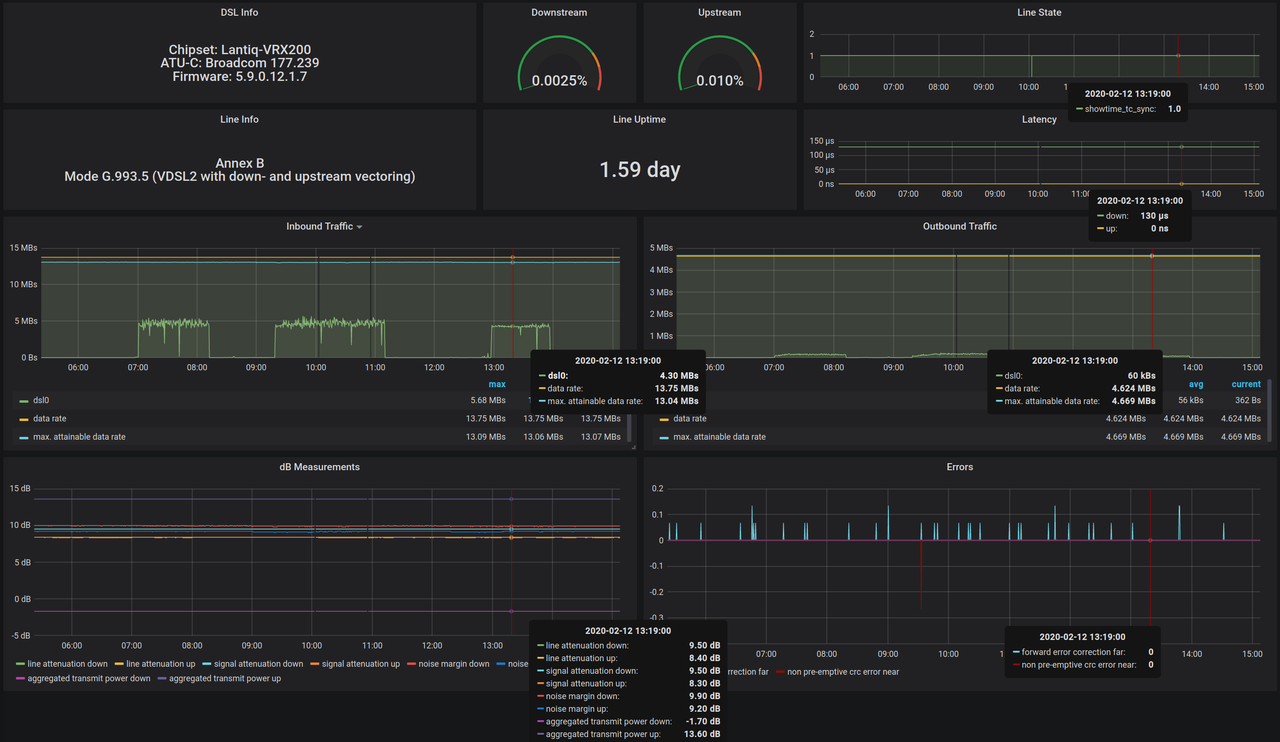
Sorry for the delay, this is my current version:
{
"annotations": {
"list": [
{
"builtIn": 1,
"datasource": "-- Grafana --",
"enable": true,
"hide": true,
"iconColor": "rgba(0, 211, 255, 1)",
"limit": 100,
"name": "Annotations & Alerts",
"showIn": 0,
"type": "dashboard"
}
]
},
"editable": true,
"gnetId": null,
"graphTooltip": 2,
"id": 15,
"iteration": 1587800800250,
"links": [],
"panels": [
{
"cacheTimeout": null,
"colorBackground": false,
"colorValue": false,
"colors": [
"#299c46",
"rgba(237, 129, 40, 0.89)",
"#d44a3a"
],
"datasource": "Prometheus",
"format": "none",
"gauge": {
"maxValue": 100,
"minValue": 0,
"show": false,
"thresholdLabels": false,
"thresholdMarkers": true
},
"gridPos": {
"h": 4,
"w": 9,
"x": 0,
"y": 0
},
"id": 6,
"interval": null,
"links": [],
"mappingType": 1,
"mappingTypes": [
{
"name": "value to text",
"value": 1
},
{
"name": "range to text",
"value": 2
}
],
"maxDataPoints": 100,
"nullPointMode": "connected",
"nullText": null,
"options": {},
"postfix": "",
"postfixFontSize": "50%",
"prefix": "",
"prefixFontSize": "50%",
"rangeMaps": [
{
"from": "null",
"text": "N/A",
"to": "null"
}
],
"sparkline": {
"fillColor": "rgba(31, 118, 189, 0.18)",
"full": false,
"lineColor": "rgb(31, 120, 193)",
"show": false
},
"tableColumn": "",
"targets": [
{
"expr": "dsl_info{instance=\"$instance\"}",
"format": "time_series",
"instant": true,
"intervalFactor": 1,
"legendFormat": "Chipset: {{chipset}}<br>ATU-C: {{atuc_vendor_id}}<br>Firmware: {{firmware_version}}",
"refId": "A"
}
],
"thresholds": "",
"title": "DSL Info",
"type": "singlestat",
"valueFontSize": "50%",
"valueMaps": [],
"valueName": "name"
},
{
"cacheTimeout": null,
"colorBackground": false,
"colorValue": false,
"colors": [
"#299c46",
"rgba(237, 129, 40, 0.89)",
"#d44a3a"
],
"datasource": "Prometheus",
"decimals": null,
"format": "percent",
"gauge": {
"maxValue": 100,
"minValue": 0,
"show": true,
"thresholdLabels": false,
"thresholdMarkers": true
},
"gridPos": {
"h": 4,
"w": 3,
"x": 9,
"y": 0
},
"id": 20,
"interval": null,
"links": [],
"mappingType": 1,
"mappingTypes": [
{
"name": "value to text",
"value": 1
},
{
"name": "range to text",
"value": 2
}
],
"maxDataPoints": 100,
"nullPointMode": "connected",
"nullText": null,
"options": {},
"postfix": "",
"postfixFontSize": "50%",
"prefix": "",
"prefixFontSize": "50%",
"rangeMaps": [
{
"from": "null",
"text": "N/A",
"to": "null"
}
],
"sparkline": {
"fillColor": "rgba(31, 118, 189, 0.18)",
"full": false,
"lineColor": "rgb(31, 120, 193)",
"show": true
},
"tableColumn": "",
"targets": [
{
"expr": "100 / dsl_datarate{instance=\"$instance\", direction=\"down\"} * scalar(irate(node_network_receive_bytes_total{instance=\"$instance\", device=\"dsl0\"}[5m])) * 8",
"format": "time_series",
"instant": true,
"interval": "",
"intervalFactor": 1,
"legendFormat": "",
"refId": "A"
}
],
"thresholds": "75,85",
"title": "Downstream",
"type": "singlestat",
"valueFontSize": "80%",
"valueMaps": [],
"valueName": "current"
},
{
"cacheTimeout": null,
"colorBackground": false,
"colorValue": false,
"colors": [
"#299c46",
"rgba(237, 129, 40, 0.89)",
"#d44a3a"
],
"datasource": "Prometheus",
"decimals": null,
"format": "percent",
"gauge": {
"maxValue": 100,
"minValue": 0,
"show": true,
"thresholdLabels": false,
"thresholdMarkers": true
},
"gridPos": {
"h": 4,
"w": 3,
"x": 12,
"y": 0
},
"id": 22,
"interval": null,
"links": [],
"mappingType": 1,
"mappingTypes": [
{
"name": "value to text",
"value": 1
},
{
"name": "range to text",
"value": 2
}
],
"maxDataPoints": 100,
"nullPointMode": "connected",
"nullText": null,
"options": {},
"postfix": "",
"postfixFontSize": "50%",
"prefix": "",
"prefixFontSize": "50%",
"rangeMaps": [
{
"from": "null",
"text": "N/A",
"to": "null"
}
],
"sparkline": {
"fillColor": "rgba(31, 118, 189, 0.18)",
"full": false,
"lineColor": "rgb(31, 120, 193)",
"show": true
},
"tableColumn": "",
"targets": [
{
"expr": "100 / dsl_datarate{instance=\"$instance\", direction=\"up\"} * scalar(irate(node_network_transmit_bytes_total{instance=\"$instance\", device=\"dsl0\"}[5m])) * 8",
"format": "time_series",
"instant": true,
"interval": "",
"intervalFactor": 1,
"legendFormat": "",
"refId": "A"
}
],
"thresholds": "75,85",
"title": "Upstream",
"type": "singlestat",
"valueFontSize": "80%",
"valueMaps": [],
"valueName": "current"
},
{
"aliasColors": {},
"bars": false,
"dashLength": 10,
"dashes": false,
"datasource": "Prometheus",
"fill": 1,
"fillGradient": 0,
"gridPos": {
"h": 4,
"w": 9,
"x": 15,
"y": 0
},
"hiddenSeries": false,
"id": 4,
"legend": {
"avg": false,
"current": false,
"max": false,
"min": false,
"show": false,
"total": false,
"values": false
},
"lines": true,
"linewidth": 1,
"links": [],
"nullPointMode": "null",
"options": {
"dataLinks": []
},
"percentage": false,
"pointradius": 5,
"points": false,
"renderer": "flot",
"seriesOverrides": [],
"spaceLength": 10,
"stack": false,
"steppedLine": true,
"targets": [
{
"expr": "dsl_up{instance=\"$instance\"}",
"format": "time_series",
"intervalFactor": 1,
"legendFormat": "{{detail}}",
"refId": "A"
}
],
"thresholds": [],
"timeFrom": null,
"timeRegions": [],
"timeShift": null,
"title": "Line State",
"tooltip": {
"shared": true,
"sort": 0,
"value_type": "individual"
},
"type": "graph",
"xaxis": {
"buckets": null,
"mode": "time",
"name": null,
"show": true,
"values": []
},
"yaxes": [
{
"decimals": 0,
"format": "short",
"label": "",
"logBase": 1,
"max": null,
"min": null,
"show": true
},
{
"format": "short",
"label": null,
"logBase": 1,
"max": null,
"min": null,
"show": false
}
],
"yaxis": {
"align": false,
"alignLevel": null
}
},
{
"cacheTimeout": null,
"colorBackground": false,
"colorValue": false,
"colors": [
"#299c46",
"rgba(237, 129, 40, 0.89)",
"#d44a3a"
],
"datasource": "Prometheus",
"format": "none",
"gauge": {
"maxValue": 100,
"minValue": 0,
"show": false,
"thresholdLabels": false,
"thresholdMarkers": true
},
"gridPos": {
"h": 4,
"w": 9,
"x": 0,
"y": 4
},
"id": 8,
"interval": null,
"links": [],
"mappingType": 1,
"mappingTypes": [
{
"name": "value to text",
"value": 1
},
{
"name": "range to text",
"value": 2
}
],
"maxDataPoints": 100,
"nullPointMode": "connected",
"nullText": null,
"options": {},
"postfix": "",
"postfixFontSize": "50%",
"prefix": "",
"prefixFontSize": "50%",
"rangeMaps": [
{
"from": "null",
"text": "N/A",
"to": "null"
}
],
"sparkline": {
"fillColor": "rgba(31, 118, 189, 0.18)",
"full": false,
"lineColor": "rgb(31, 120, 193)",
"show": false
},
"tableColumn": "",
"targets": [
{
"expr": "dsl_line_info{instance=\"$instance\"}",
"format": "time_series",
"instant": true,
"intervalFactor": 1,
"legendFormat": "Annex {{annex}}<br>Mode {{mode}}",
"refId": "A"
}
],
"thresholds": "",
"title": "Line Info",
"type": "singlestat",
"valueFontSize": "50%",
"valueMaps": [],
"valueName": "name"
},
{
"cacheTimeout": null,
"colorBackground": false,
"colorValue": false,
"colors": [
"#299c46",
"rgba(237, 129, 40, 0.89)",
"#d44a3a"
],
"datasource": "Prometheus",
"format": "s",
"gauge": {
"maxValue": 100,
"minValue": 0,
"show": false,
"thresholdLabels": false,
"thresholdMarkers": true
},
"gridPos": {
"h": 4,
"w": 6,
"x": 9,
"y": 4
},
"id": 10,
"interval": null,
"links": [],
"mappingType": 1,
"mappingTypes": [
{
"name": "value to text",
"value": 1
},
{
"name": "range to text",
"value": 2
}
],
"maxDataPoints": 100,
"nullPointMode": "connected",
"nullText": null,
"options": {},
"postfix": "",
"postfixFontSize": "50%",
"prefix": "",
"prefixFontSize": "50%",
"rangeMaps": [
{
"from": "null",
"text": "N/A",
"to": "null"
}
],
"sparkline": {
"fillColor": "rgba(31, 118, 189, 0.18)",
"full": false,
"lineColor": "rgb(31, 120, 193)",
"show": false
},
"tableColumn": "",
"targets": [
{
"expr": "dsl_uptime_seconds{instance=\"$instance\"}",
"format": "time_series",
"instant": true,
"intervalFactor": 1,
"legendFormat": "",
"refId": "A"
}
],
"thresholds": "",
"title": "Line Uptime",
"type": "singlestat",
"valueFontSize": "80%",
"valueMaps": [],
"valueName": "current"
},
{
"aliasColors": {},
"bars": false,
"dashLength": 10,
"dashes": false,
"datasource": "Prometheus",
"fill": 0,
"fillGradient": 0,
"gridPos": {
"h": 4,
"w": 9,
"x": 15,
"y": 4
},
"hiddenSeries": false,
"id": 24,
"legend": {
"alignAsTable": false,
"avg": false,
"current": false,
"max": false,
"min": false,
"show": false,
"total": false,
"values": false
},
"lines": true,
"linewidth": 1,
"links": [],
"nullPointMode": "null",
"options": {
"dataLinks": []
},
"percentage": false,
"pointradius": 5,
"points": false,
"renderer": "flot",
"seriesOverrides": [],
"spaceLength": 10,
"stack": false,
"steppedLine": false,
"targets": [
{
"expr": "dsl_latency_seconds{instance=\"$instance\"}",
"format": "time_series",
"intervalFactor": 1,
"legendFormat": "{{direction}}",
"refId": "A"
}
],
"thresholds": [],
"timeFrom": null,
"timeRegions": [],
"timeShift": null,
"title": "Latency",
"tooltip": {
"shared": true,
"sort": 0,
"value_type": "individual"
},
"type": "graph",
"xaxis": {
"buckets": null,
"mode": "time",
"name": null,
"show": true,
"values": []
},
"yaxes": [
{
"format": "s",
"label": null,
"logBase": 1,
"max": null,
"min": null,
"show": true
},
{
"format": "short",
"label": null,
"logBase": 1,
"max": null,
"min": null,
"show": false
}
],
"yaxis": {
"align": false,
"alignLevel": null
}
},
{
"aliasColors": {},
"bars": false,
"dashLength": 10,
"dashes": false,
"datasource": "Prometheus",
"fill": 1,
"fillGradient": 0,
"gridPos": {
"h": 9,
"w": 12,
"x": 0,
"y": 8
},
"hiddenSeries": false,
"id": 16,
"legend": {
"alignAsTable": true,
"avg": true,
"current": true,
"hideEmpty": false,
"hideZero": false,
"max": true,
"min": false,
"rightSide": false,
"show": true,
"total": false,
"values": true
},
"lines": true,
"linewidth": 1,
"links": [],
"nullPointMode": "null",
"options": {
"dataLinks": []
},
"percentage": false,
"pointradius": 5,
"points": false,
"renderer": "flot",
"repeat": null,
"repeatDirection": "h",
"seriesOverrides": [],
"spaceLength": 10,
"stack": false,
"steppedLine": false,
"targets": [
{
"expr": "irate(node_network_receive_bytes_total{instance=\"$instance\", device=\"dsl0\"}[5m]) * 8",
"format": "time_series",
"hide": false,
"instant": false,
"interval": "",
"intervalFactor": 1,
"legendFormat": "{{device}}",
"refId": "A"
},
{
"expr": "dsl_datarate{instance=\"$instance\", direction=\"down\"}",
"format": "time_series",
"hide": true,
"interval": "",
"intervalFactor": 1,
"legendFormat": "data rate",
"refId": "B"
},
{
"expr": "dsl_max_datarate{instance=\"$instance\", direction=\"down\"}",
"format": "time_series",
"hide": true,
"intervalFactor": 1,
"legendFormat": "max. attainable data rate",
"refId": "C"
}
],
"thresholds": [],
"timeFrom": null,
"timeRegions": [],
"timeShift": null,
"title": "Inbound Traffic",
"tooltip": {
"shared": true,
"sort": 0,
"value_type": "individual"
},
"type": "graph",
"xaxis": {
"buckets": null,
"mode": "time",
"name": null,
"show": true,
"values": []
},
"yaxes": [
{
"decimals": null,
"format": "bps",
"label": null,
"logBase": 1,
"max": null,
"min": null,
"show": true
},
{
"format": "bps",
"label": null,
"logBase": 1,
"max": null,
"min": null,
"show": false
}
],
"yaxis": {
"align": false,
"alignLevel": null
}
},
{
"aliasColors": {},
"bars": false,
"dashLength": 10,
"dashes": false,
"datasource": "Prometheus",
"fill": 1,
"fillGradient": 0,
"gridPos": {
"h": 9,
"w": 12,
"x": 12,
"y": 8
},
"hiddenSeries": false,
"id": 18,
"legend": {
"alignAsTable": true,
"avg": true,
"current": true,
"hideZero": true,
"max": true,
"min": false,
"rightSide": false,
"show": true,
"total": false,
"values": true
},
"lines": true,
"linewidth": 1,
"links": [],
"nullPointMode": "null",
"options": {
"dataLinks": []
},
"percentage": false,
"pointradius": 5,
"points": false,
"renderer": "flot",
"seriesOverrides": [],
"spaceLength": 10,
"stack": false,
"steppedLine": false,
"targets": [
{
"expr": "irate(node_network_transmit_bytes_total{instance=\"$instance\", device=\"dsl0\"}[5m]) * 8",
"format": "time_series",
"hide": false,
"instant": false,
"interval": "",
"intervalFactor": 1,
"legendFormat": "{{device}}",
"refId": "A"
},
{
"expr": "dsl_datarate{instance=\"$instance\", direction=\"up\"}",
"format": "time_series",
"hide": true,
"instant": false,
"intervalFactor": 1,
"legendFormat": "data rate",
"refId": "B"
},
{
"expr": "dsl_max_datarate{instance=\"$instance\", direction=\"up\"}",
"format": "time_series",
"hide": true,
"instant": false,
"intervalFactor": 1,
"legendFormat": "max. attainable data rate",
"refId": "C"
}
],
"thresholds": [],
"timeFrom": null,
"timeRegions": [],
"timeShift": null,
"title": "Outbound Traffic",
"tooltip": {
"shared": true,
"sort": 0,
"value_type": "individual"
},
"type": "graph",
"xaxis": {
"buckets": null,
"mode": "time",
"name": null,
"show": true,
"values": []
},
"yaxes": [
{
"format": "bps",
"label": null,
"logBase": 1,
"max": null,
"min": null,
"show": true
},
{
"format": "decbytes",
"label": null,
"logBase": 1,
"max": null,
"min": null,
"show": false
}
],
"yaxis": {
"align": false,
"alignLevel": null
}
},
{
"aliasColors": {},
"bars": false,
"dashLength": 10,
"dashes": false,
"datasource": "Prometheus",
"fill": 0,
"fillGradient": 0,
"gridPos": {
"h": 9,
"w": 12,
"x": 0,
"y": 17
},
"hiddenSeries": false,
"id": 12,
"legend": {
"avg": false,
"current": false,
"max": false,
"min": false,
"show": true,
"total": false,
"values": false
},
"lines": true,
"linewidth": 1,
"links": [],
"nullPointMode": "null",
"options": {
"dataLinks": []
},
"percentage": false,
"pointradius": 5,
"points": false,
"renderer": "flot",
"seriesOverrides": [],
"spaceLength": 10,
"stack": false,
"steppedLine": false,
"targets": [
{
"expr": "dsl_line_attenuation_db{instance=\"$instance\"}",
"format": "time_series",
"intervalFactor": 1,
"legendFormat": "line attenuation {{direction}}",
"refId": "A"
},
{
"expr": "dsl_signal_attenuation_db{instance=\"$instance\"}",
"format": "time_series",
"intervalFactor": 1,
"legendFormat": "signal attenuation {{direction}}",
"refId": "B"
},
{
"expr": "dsl_signal_to_noise_margin_db{instance=\"$instance\"}",
"format": "time_series",
"intervalFactor": 1,
"legendFormat": "noise margin {{direction}}",
"refId": "C"
},
{
"expr": "dsl_aggregated_transmit_power_db{instance=\"$instance\"}",
"format": "time_series",
"intervalFactor": 1,
"legendFormat": "aggregated transmit power {{direction}}",
"refId": "D"
}
],
"thresholds": [],
"timeFrom": null,
"timeRegions": [],
"timeShift": null,
"title": "dB Measurements",
"tooltip": {
"shared": true,
"sort": 0,
"value_type": "individual"
},
"type": "graph",
"xaxis": {
"buckets": null,
"mode": "time",
"name": null,
"show": true,
"values": []
},
"yaxes": [
{
"format": "dB",
"label": null,
"logBase": 1,
"max": null,
"min": null,
"show": true
},
{
"format": "short",
"label": null,
"logBase": 1,
"max": null,
"min": null,
"show": false
}
],
"yaxis": {
"align": false,
"alignLevel": null
}
},
{
"aliasColors": {},
"bars": false,
"dashLength": 10,
"dashes": false,
"datasource": "Prometheus",
"fill": 1,
"fillGradient": 0,
"gridPos": {
"h": 9,
"w": 12,
"x": 12,
"y": 17
},
"hiddenSeries": false,
"id": 14,
"legend": {
"avg": false,
"current": false,
"hideEmpty": true,
"hideZero": true,
"max": false,
"min": false,
"show": true,
"total": false,
"values": false
},
"lines": true,
"linewidth": 1,
"links": [],
"nullPointMode": "null",
"options": {
"dataLinks": []
},
"percentage": false,
"pointradius": 5,
"points": false,
"renderer": "flot",
"seriesOverrides": [],
"spaceLength": 10,
"stack": false,
"steppedLine": false,
"targets": [
{
"expr": "irate(dsl_error_seconds_total{instance=\"$instance\"}[5m])",
"format": "time_series",
"interval": "",
"intervalFactor": 1,
"legendFormat": "{{err}} {{loc}}",
"refId": "A"
},
{
"expr": "-irate(dsl_errors_total{instance=\"$instance\"}[5m])",
"format": "time_series",
"interval": "",
"intervalFactor": 1,
"legendFormat": "{{err}} {{loc}}",
"refId": "B"
}
],
"thresholds": [],
"timeFrom": null,
"timeRegions": [],
"timeShift": null,
"title": "Errors",
"tooltip": {
"shared": true,
"sort": 0,
"value_type": "individual"
},
"type": "graph",
"xaxis": {
"buckets": null,
"mode": "time",
"name": null,
"show": true,
"values": []
},
"yaxes": [
{
"format": "short",
"label": null,
"logBase": 1,
"max": null,
"min": null,
"show": true
},
{
"format": "short",
"label": null,
"logBase": 1,
"max": null,
"min": null,
"show": false
}
],
"yaxis": {
"align": false,
"alignLevel": null
}
}
],
"refresh": "1m",
"schemaVersion": 22,
"style": "dark",
"tags": [],
"templating": {
"list": [
{
"allValue": null,
"datasource": "Prometheus",
"definition": "label_values(dsl_info, instance)",
"hide": 0,
"includeAll": false,
"label": "Host",
"multi": false,
"name": "instance",
"options": [],
"query": "label_values(dsl_info, instance)",
"refresh": 1,
"regex": "",
"skipUrlSync": false,
"sort": 1,
"tagValuesQuery": "",
"tags": [],
"tagsQuery": "",
"type": "query",
"useTags": false
}
]
},
"time": {
"from": "now-24h",
"to": "now"
},
"timepicker": {
"refresh_intervals": [
"5s",
"10s",
"30s",
"1m",
"5m",
"15m",
"30m",
"1h",
"2h",
"1d"
],
"time_options": [
"5m",
"15m",
"1h",
"6h",
"12h",
"24h",
"2d",
"7d",
"30d"
]
},
"timezone": "",
"title": "OpenWRT DSL Stats",
"uid": "s91DdGEik",
"version": 15
}