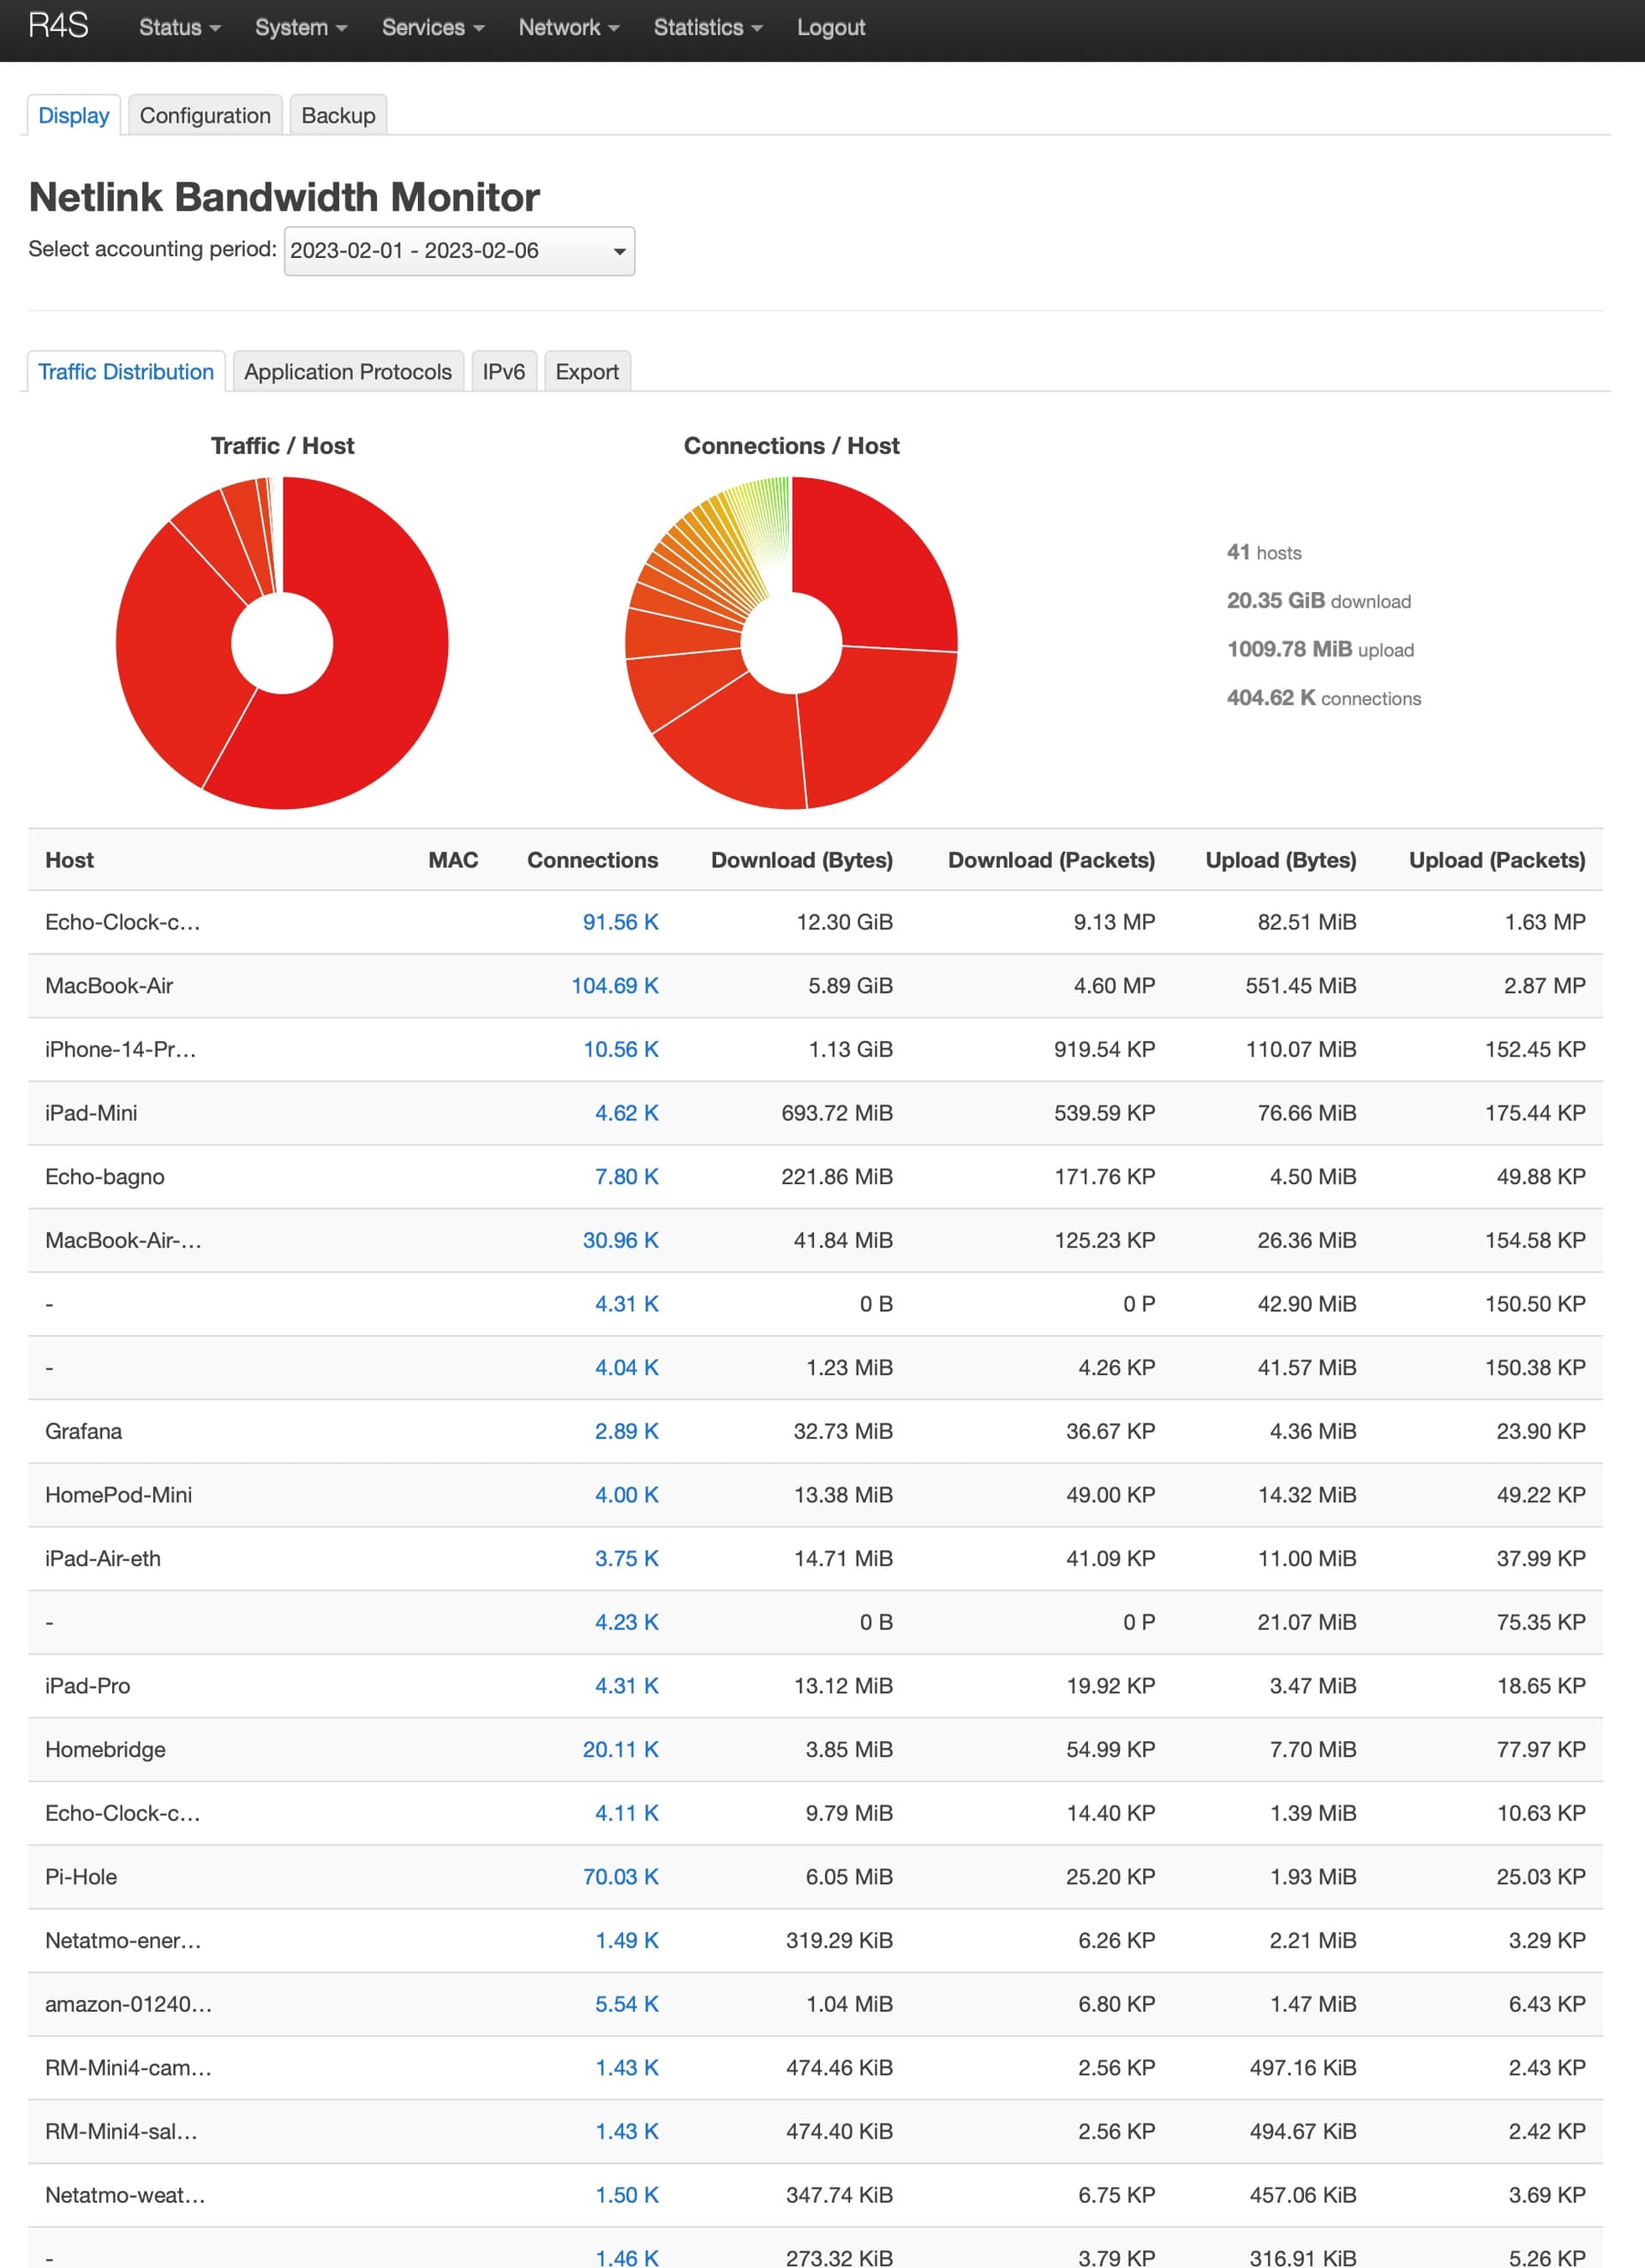
i am running OpenWrt 22.03.2 and i am looking for a way to monitor traffic (usage) per IP. So i could get an understanding of how much traffic each user needs and an overall usage of the WAN. i did install
Netlink Bandwidth Monitor is not really usefull to understand for an IP:
when does it get spikes
what is the maximum threshold that uses
when is the peak time
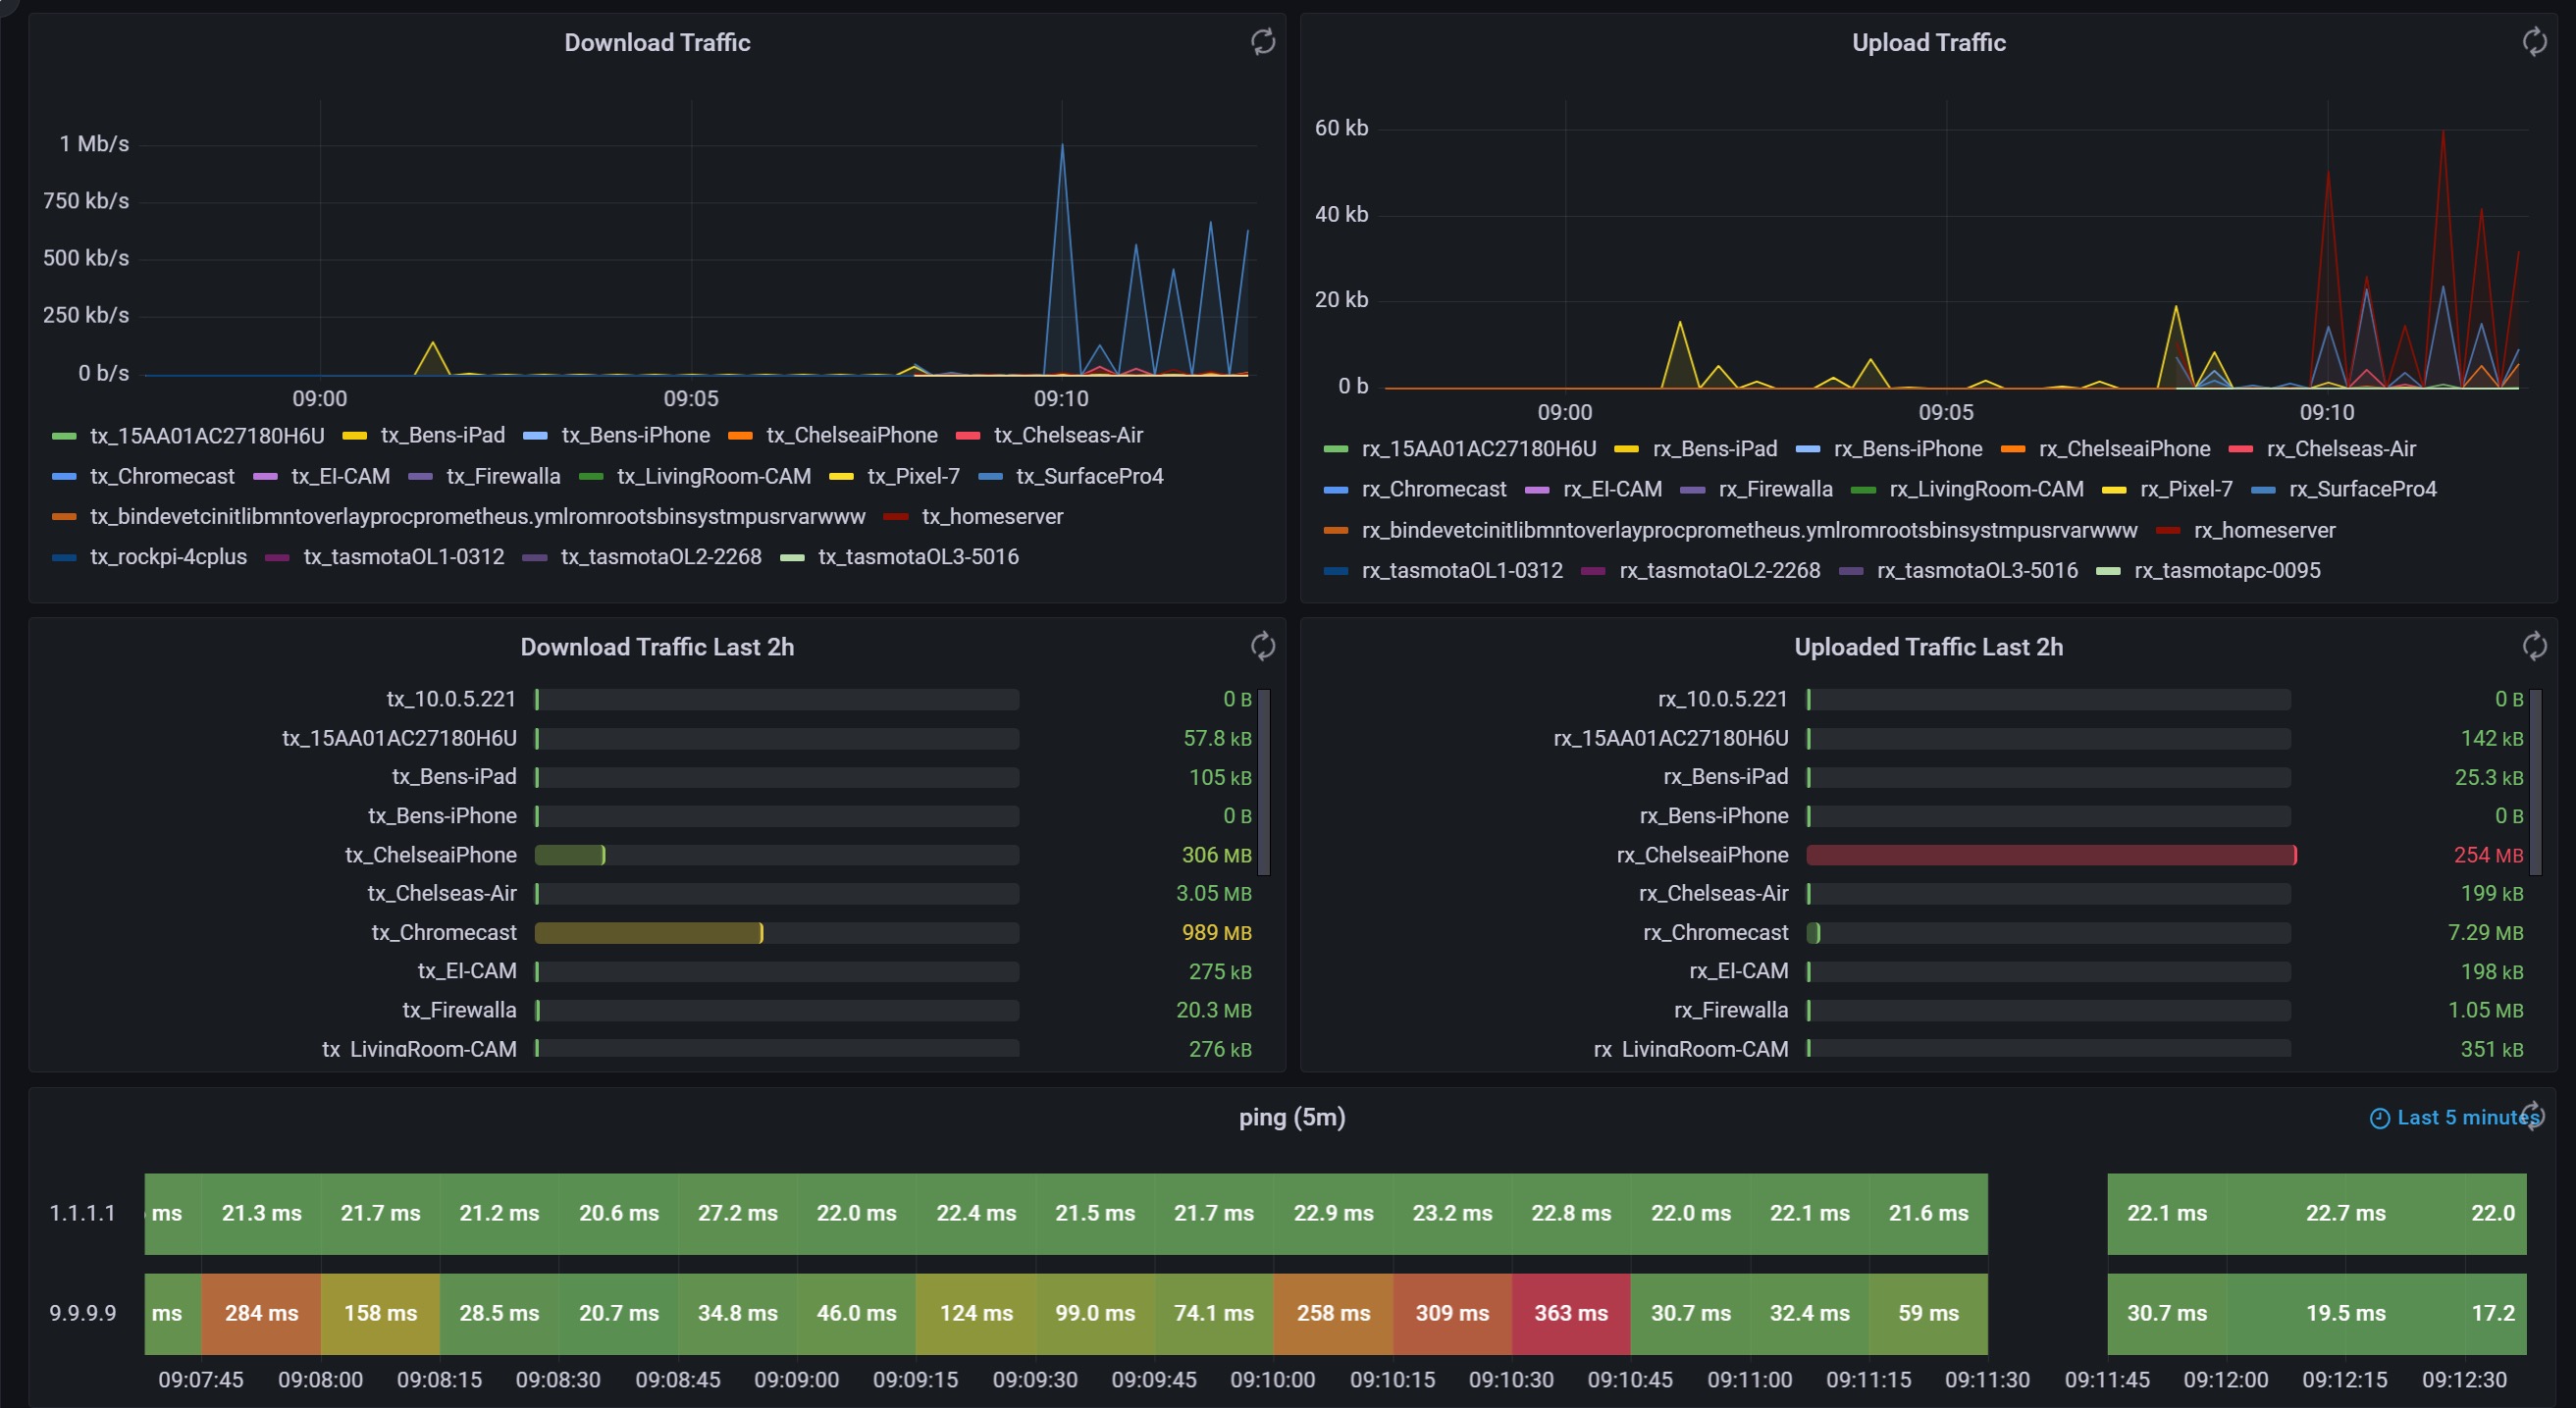
external service is not an option. looking for a nice graph that show in intervals per IP traffic.
Everything should run on OperWRT.
Netlink Bandwidth Monitor is not really usefull to understand for an IP:
when does it get spikes
what is the maximum threshold that uses
when is the peak time
you simply get an overall used in GBs. looking for an actual graph per IP, to see their traffic. I would not like to use external machines, simply run everything in OpenWRT router.
He answered your question, provide specifics in the initial post, instead of complaining over the solution(s) provided, due to incomplete list of requirements.
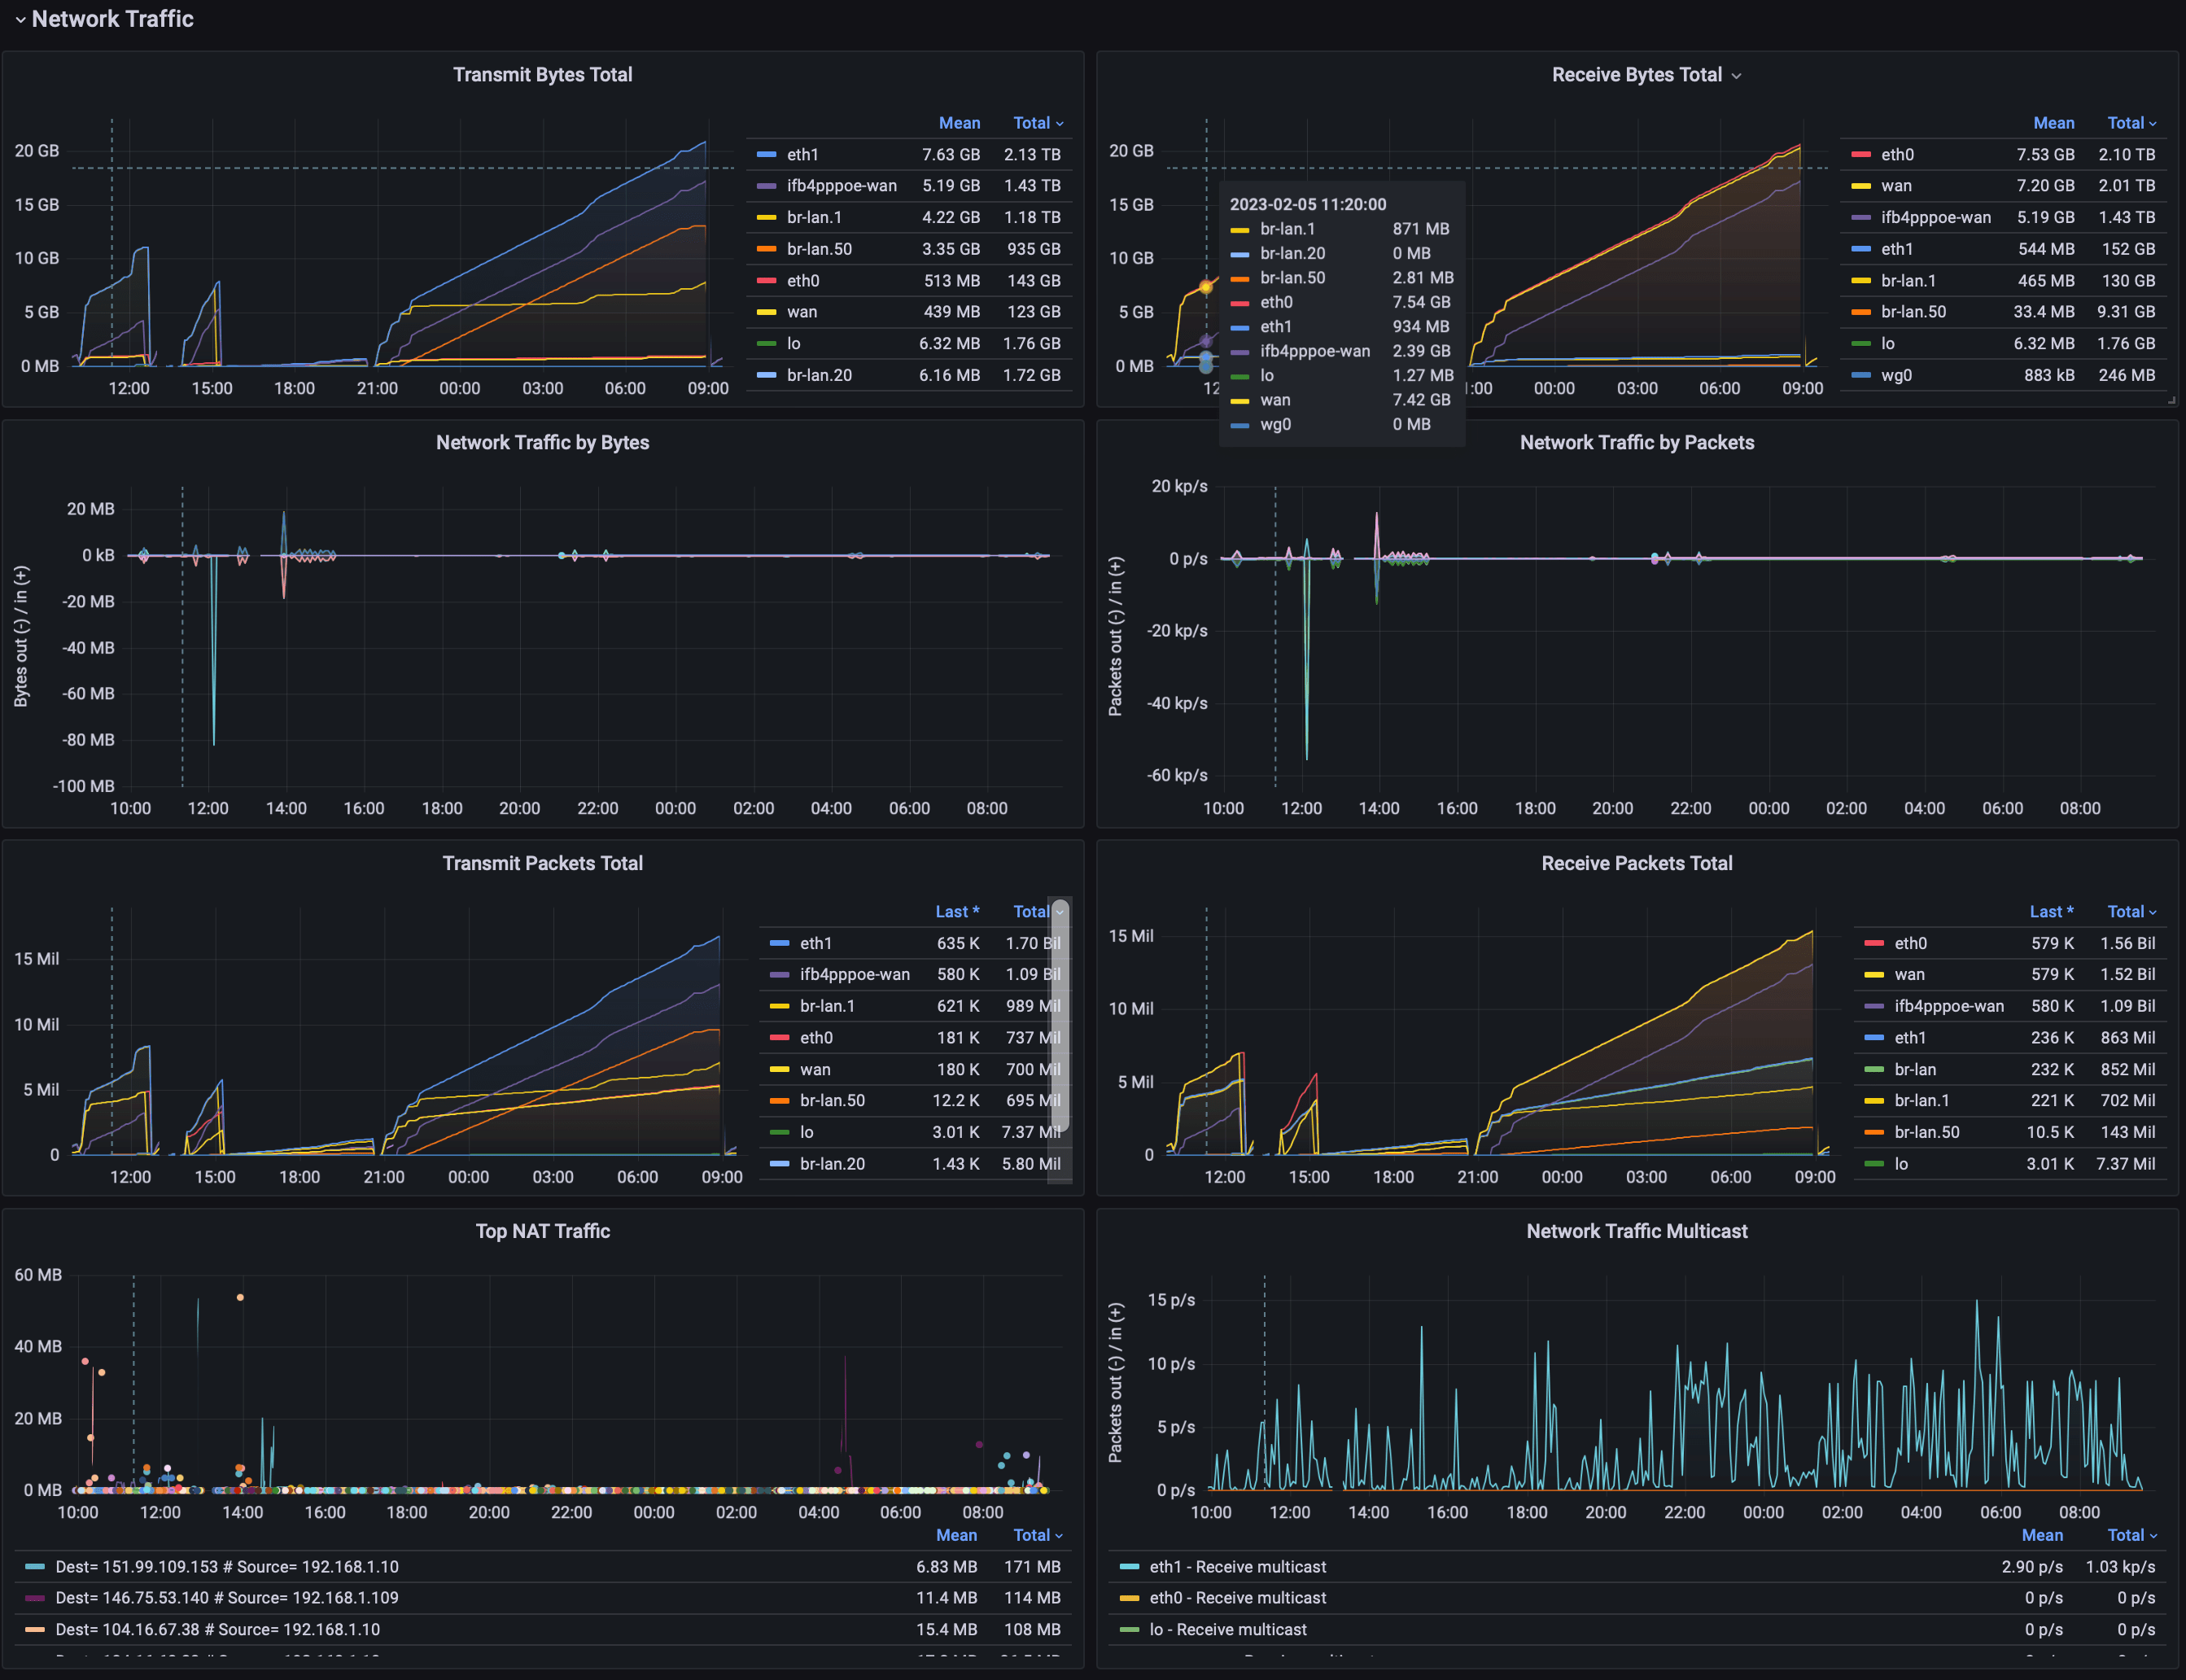
You can also have way more complex monitoring system, but it needs an external machine to create the dashboards, try to search for collectd and Prometheus exporter and after build the stats in Grafana (like I'm doing)
I'm not interested in "per IP traffic" since I monitor it via Netlink Bandwidth Monitor (I just need the traffic on the iot, my, or guest vlans), but is possible if you are still on iptables using iptmon: Simple iptables bandwidth monitor
since it is my mistake, i edited my initial post, to explain what i am asking for.
external service is not an option. looking for a nice graph that show in intervals per IP traffic.
it's not a must, only a suggestion if you don't own the hardware required for hosting the main application, and the external service is in this case only a cloud host for Linux, you're not ULing your stats/data to any 3rd party service, but your own.
You can create a unique virtual SSID for each IP address you want to monitor and then connect only one client to that SSID. This will create a new adapter you can monitor with the normal LuCI Statistics/collectd (interfaces plugin). Anything that is hardwired, assuming you're not using external switches, will already have its own port you can monitor. This will give you usage breakdown at 30 second intervals, or even smaller if you want.
EDIT:
This actually shouldn't be too hard to bake into LuCI. There is already a collectd iptables plugin that can collect data from any filter counter. I don't yet know if this is usable with nft, but it would be very useful. Worth looking into for the future, in any case.
EDIT2:
Good heavens, it looks like it already is baked into LuCI. There is already a collectd-mod-iptables package for OpenWrt and looking at LuCI statistics it seems like there is support for iptables in it.