Is there a way to make my adguard home installation persist post update.
Its installed directly using a script
curl -s -S -L https://raw.githubusercontent.com/AdguardTeam/AdGuardHome/master/scripts/install.sh | sh -s -- -v -r
Is there a way to make my adguard home installation persist post update.
Its installed directly using a script
curl -s -S -L https://raw.githubusercontent.com/AdguardTeam/AdGuardHome/master/scripts/install.sh | sh -s -- -v -r
Hi, I don't use adguardhome, but I use argononed which uses an install script. My problem is: every time the kernel releases are changed, it has to be recompiled by the script, in my case with the appropriate changes. There is an opkg version with instructions on https://openwrt.org/docs/guide-user/services/dns/adguard-home, and the version proposed in 7.1.31-3 is 0.107.6 against the present 0.107.7 on github. Do you have any particular reasons why you need to use the github version?
The opkg version requires manual setup of persistent storage otherwise query log and statistics are lost after reboot and the filters need to be started manually.
These problems don't exist with the script/ github version.
ok, i think or create a script that every time check if it is installed or try to configure the backup, adding folders and files that you plan to restore, or open in https://github.com/wulfy23/rpi4 / issues
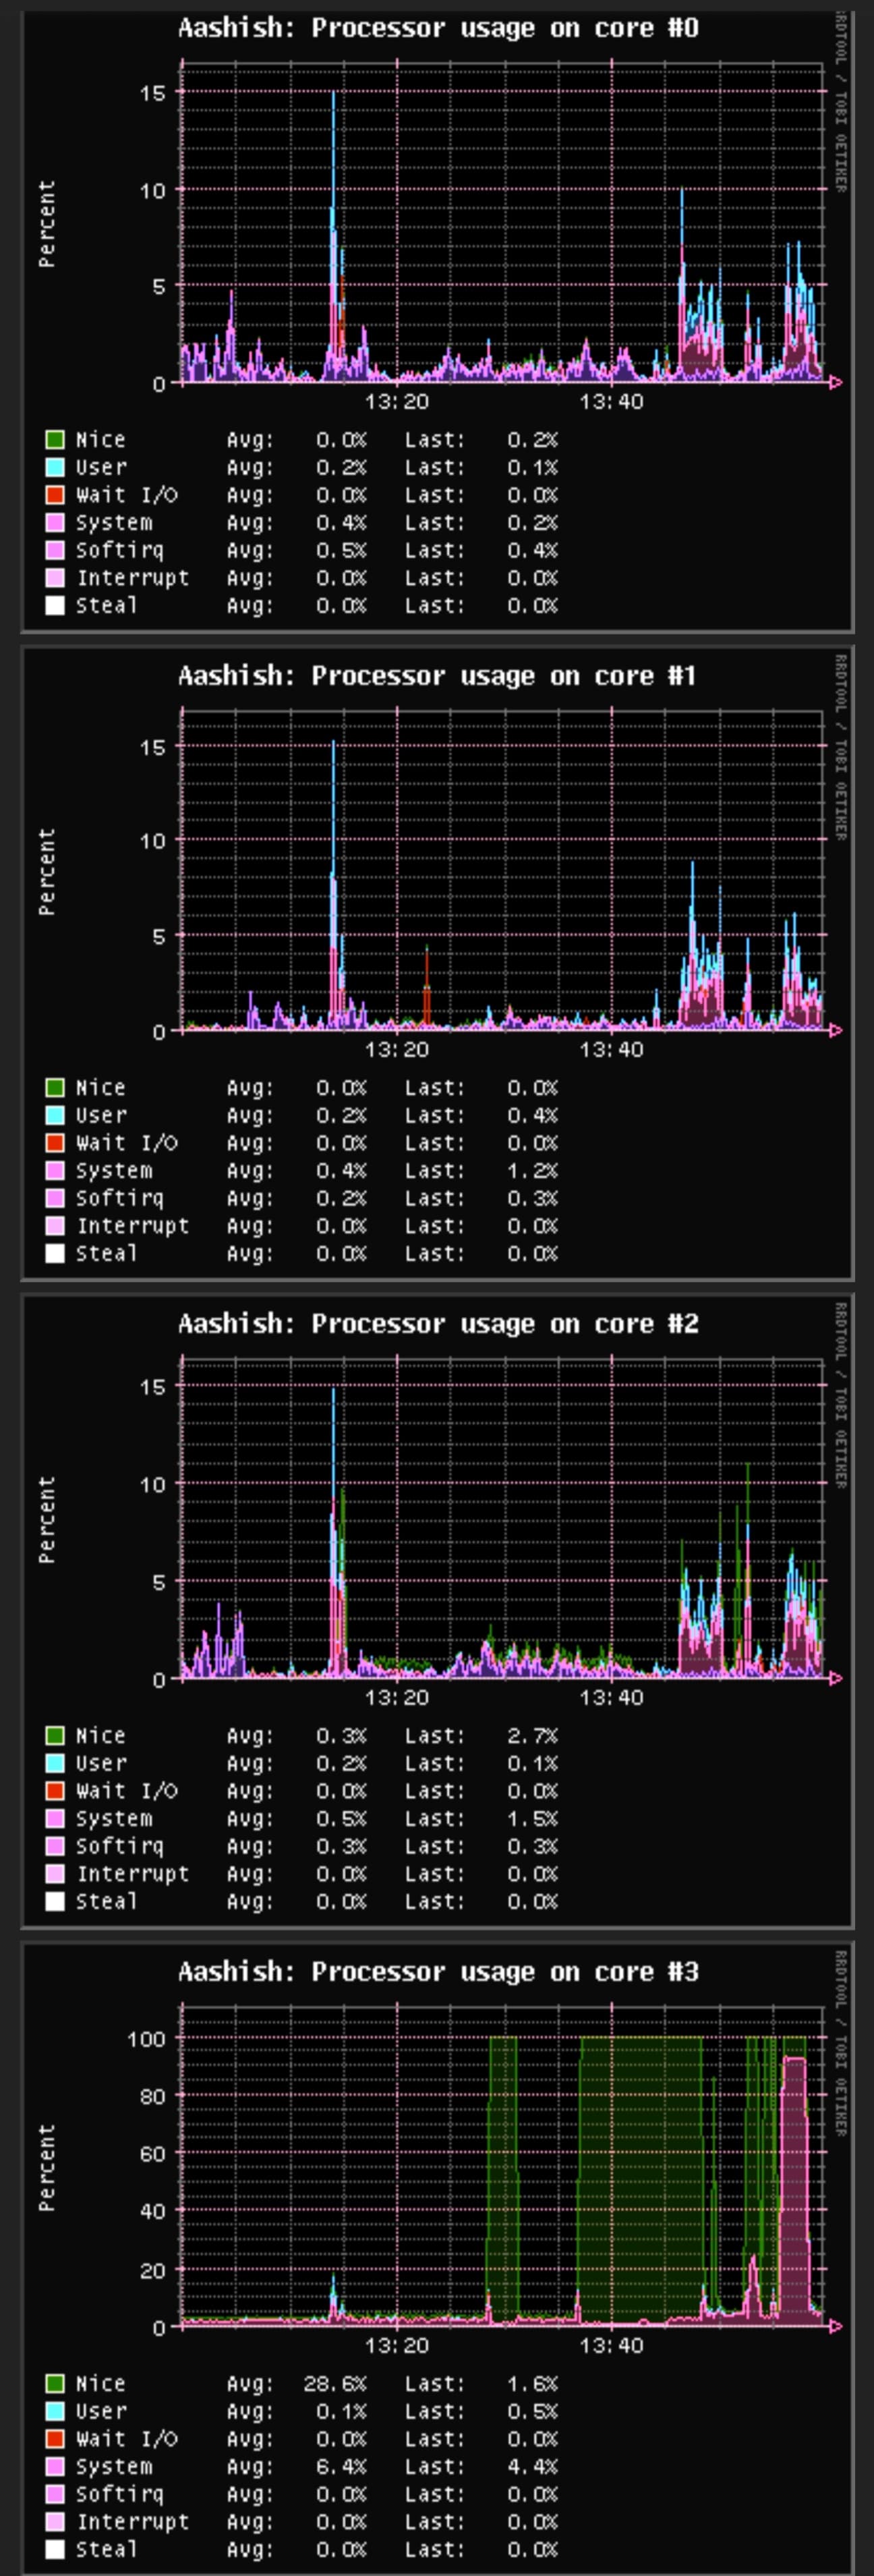
I have noticed that no matter what I do to benchmark using stress-ng only the last core (#3) faces the brunt of the load. All the other 3 cores are comfortably idling, checked using htop.
Can someone verify and revert?
Please add support for DNS over TLS(DOT)
If I install stubby for DNS over TLS, will it be in conflict with DNS over HTTPS package? Which is already installed.
There won't be any conflict, you can use them both.
Hi
I know that this OpenWRT already present built-in statistics but I would like to see them on Grafana that centralise all my other home server metrics.
That seems to be allowed in Statistics > Setup Output plugins > Network, using an InfluxDB database through 25826 port. The problem is that the current InfluxDB 2 versions do not support collectd data anymore.
Maybe using a Prometheus node exporter, but I don't know if this somehow can interfere with the current Statistics packages.
Have you any 2022 suggestion for this need?
Regards
Any help on this please?
Never heard of Grafana or anyone talk about it... But did you try all of this?
[https://github.com/try2codesecure/grafana_dashboards/blob/master/OpenWRT/README.md]
Thanks for the tip, but this use a Prometheus node exporter, and as I wrote "I don't know if this somehow can interfere with the current Statistics packages".
The following lua scripts has to be installen on yout openwrt router:
prometheus-node-exporter-lua
prometheus-node-exporter-lua-nat_traffic
prometheus-node-exporter-lua-netstat
prometheus-node-exporter-lua-openwrt
prometheus-node-exporter-lua-wifi
prometheus-node-exporter-lua-wifi_stations
I am finally able to store "OpenWRT collectd statistics" in a InfluxDB v2 database to be later displayed in Grafana. The solution was to use Telegraf to make the bridge between collectd and InfluxDB v2.
For those that in the future may find this useful, here is the docker-compose.yaml to run the 2 containers:
version: "3.5"
services:
  influxdb:
    container_name: influxdb
    image: influxdb:latest
    ports:
      - 8086:8086
    volumes:
      - /root/docker/influxdb/data:/var/lib/influxdb2
      - /root/docker/influxdb/config:/etc/influxdb2
    restart: always

  telegraf:
    container_name: telegraf
    image: telegraf
    ports:
      - 25826:25826/udp
    volumes:
      - /root/docker/telegraf:/etc/telegraf
    depends_on:
      - influxdb
Here is the telegraf.conf to be placed in the /root/docker/telegraf folder:
[agent]
  interval = "10s"
  round_interval = true
  metric_batch_size = 1000
  metric_buffer_limit = 10000
  collection_jitter = "0s"
  flush_interval = "10s"
  flush_jitter = "0s"
  precision = ""
  hostname = ""
  omit_hostname = false
[[inputs.socket_listener]]
  service_address = "udp://:25826"
  data_format = "collectd"
[[outputs.influxdb_v2]]
  urls = ["http://10.0.5.111:8086"]
  token = "NuD_taOU...wTfq--ag=="
  organization = "Home"
  bucket = "openwrt"
  insecure_skip_verify = true
And in the OpenWRT we just have to go to Statistics > Setup > Output plugins and set the Network, and configure it, by: Enable this plugin; Add a Server Interface with its "Server host"* (10.0.5.111) and "Server port" (25826).
*The IP where Telegraf is running!
In the InfluxDB web interface I just need to define an Organization (Home in this case), create a Bucket to store the data (openwrt in this case) and get the admin's token for Telegraf be able to access InfluxDB.
Now I need to create a nice dashboard in InfluxDB since the ones already available are not compatible with this setup (collectd + InfluxDB 2).
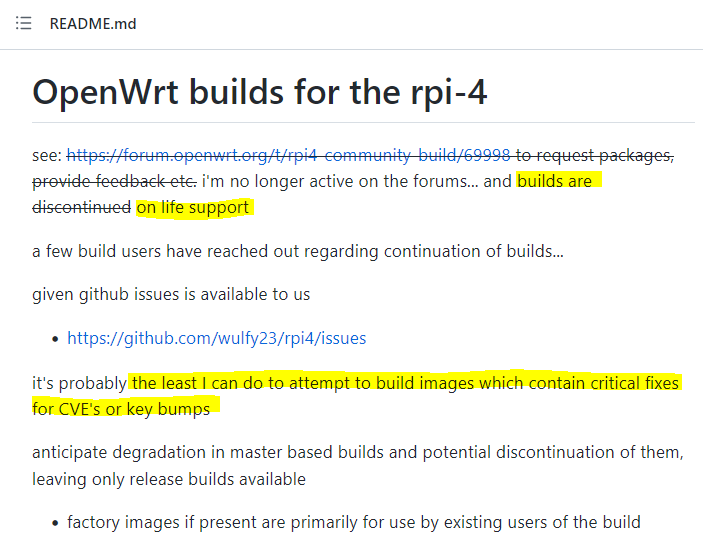
I just now realised that this project seems to be somehow "frozen"! ![]()
I am very sad with that since it is/was a GREAT firmware for my RPi4 router.
The facts are not great since the last issue is from 1/jul and that last code commit is from 25/jun.
Nevertheless, many thanks to wulfy23 and hope he can explain what "... builds are on life support" really means!
Does anyone here know why SquashFS images won't boot?
Hi,
Is this firmware still going to get updates?
No i dont think this will get any updates.
Pls keep this build alive
Agreed
It. Just. Works. Awesomely too.