Sounds to me like your looking for a testing tool to itemise key resources under load.
BASELINE + ( controlledTEST x A ) = QUANTITATIVE
ACTUAL@controlledTESTxA = QUALITATIVE
DISCLAIMER: I am discussing LOW LEVEL OS performance debugging. You can take lots of meaningful measurements without this level of interaction..... But you have to work very hard to control the environment.
assume UPSTREAM NETWORK conditions are NOT STATIC
did you use local servers / media to download from?
When you select one or several SPECIFIC measurement parameter results under CONTROLLED conditions they can be your BENCHMARK.
softirq increases are a CONSEQUENCE of CPU consumption.
Read up on them.... but on their own, they are not quantifyable without a narrower context.
If you ran the EXACT same tests, with another operating system version aka 18.06.02..... Then you would have a usable BENCHMARK on your hands and because you have narrowed test parameters.
Look into perf and compiling an image with symbols.....
With perf you can itemise low level OS functions where they matter.... because CPU usage is not just about the actual TRAFFIC that is passing through a device.....
Is it in the driver, the interrupts, the network stack..... ?
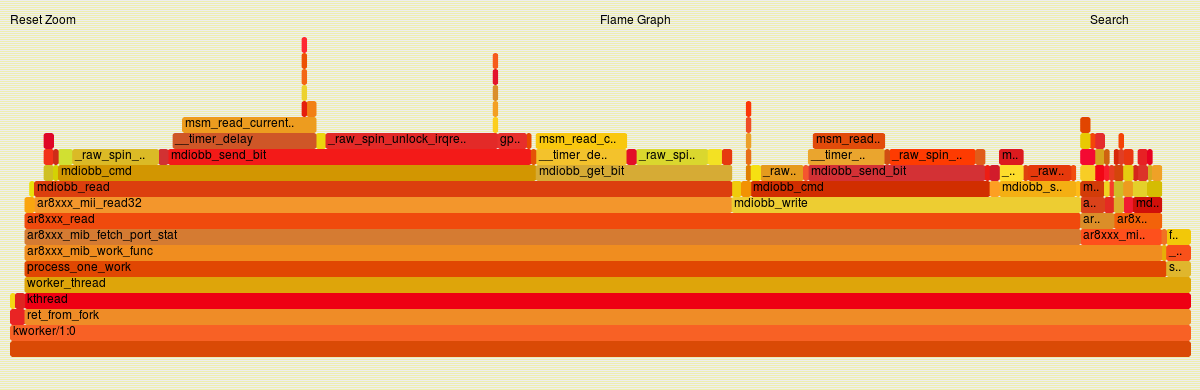
If you manage to get perf setup.... you can create nice graphs like;
Listen very carefully@11:20 ... think about time and what influence it plays.....
Also@26:46....
I'm sure others will let you know of some better / easier ways to gather more about the bigger picture..... before you zoom in on one exact thing......