Yepp, it can however be interesting when problems show up to look at say CPU usage or ping results.
I’m writing a post on my blog on how to obtain a full report via mail of your hardware and network data, few days and it will be online, the final result is
This from a webpage
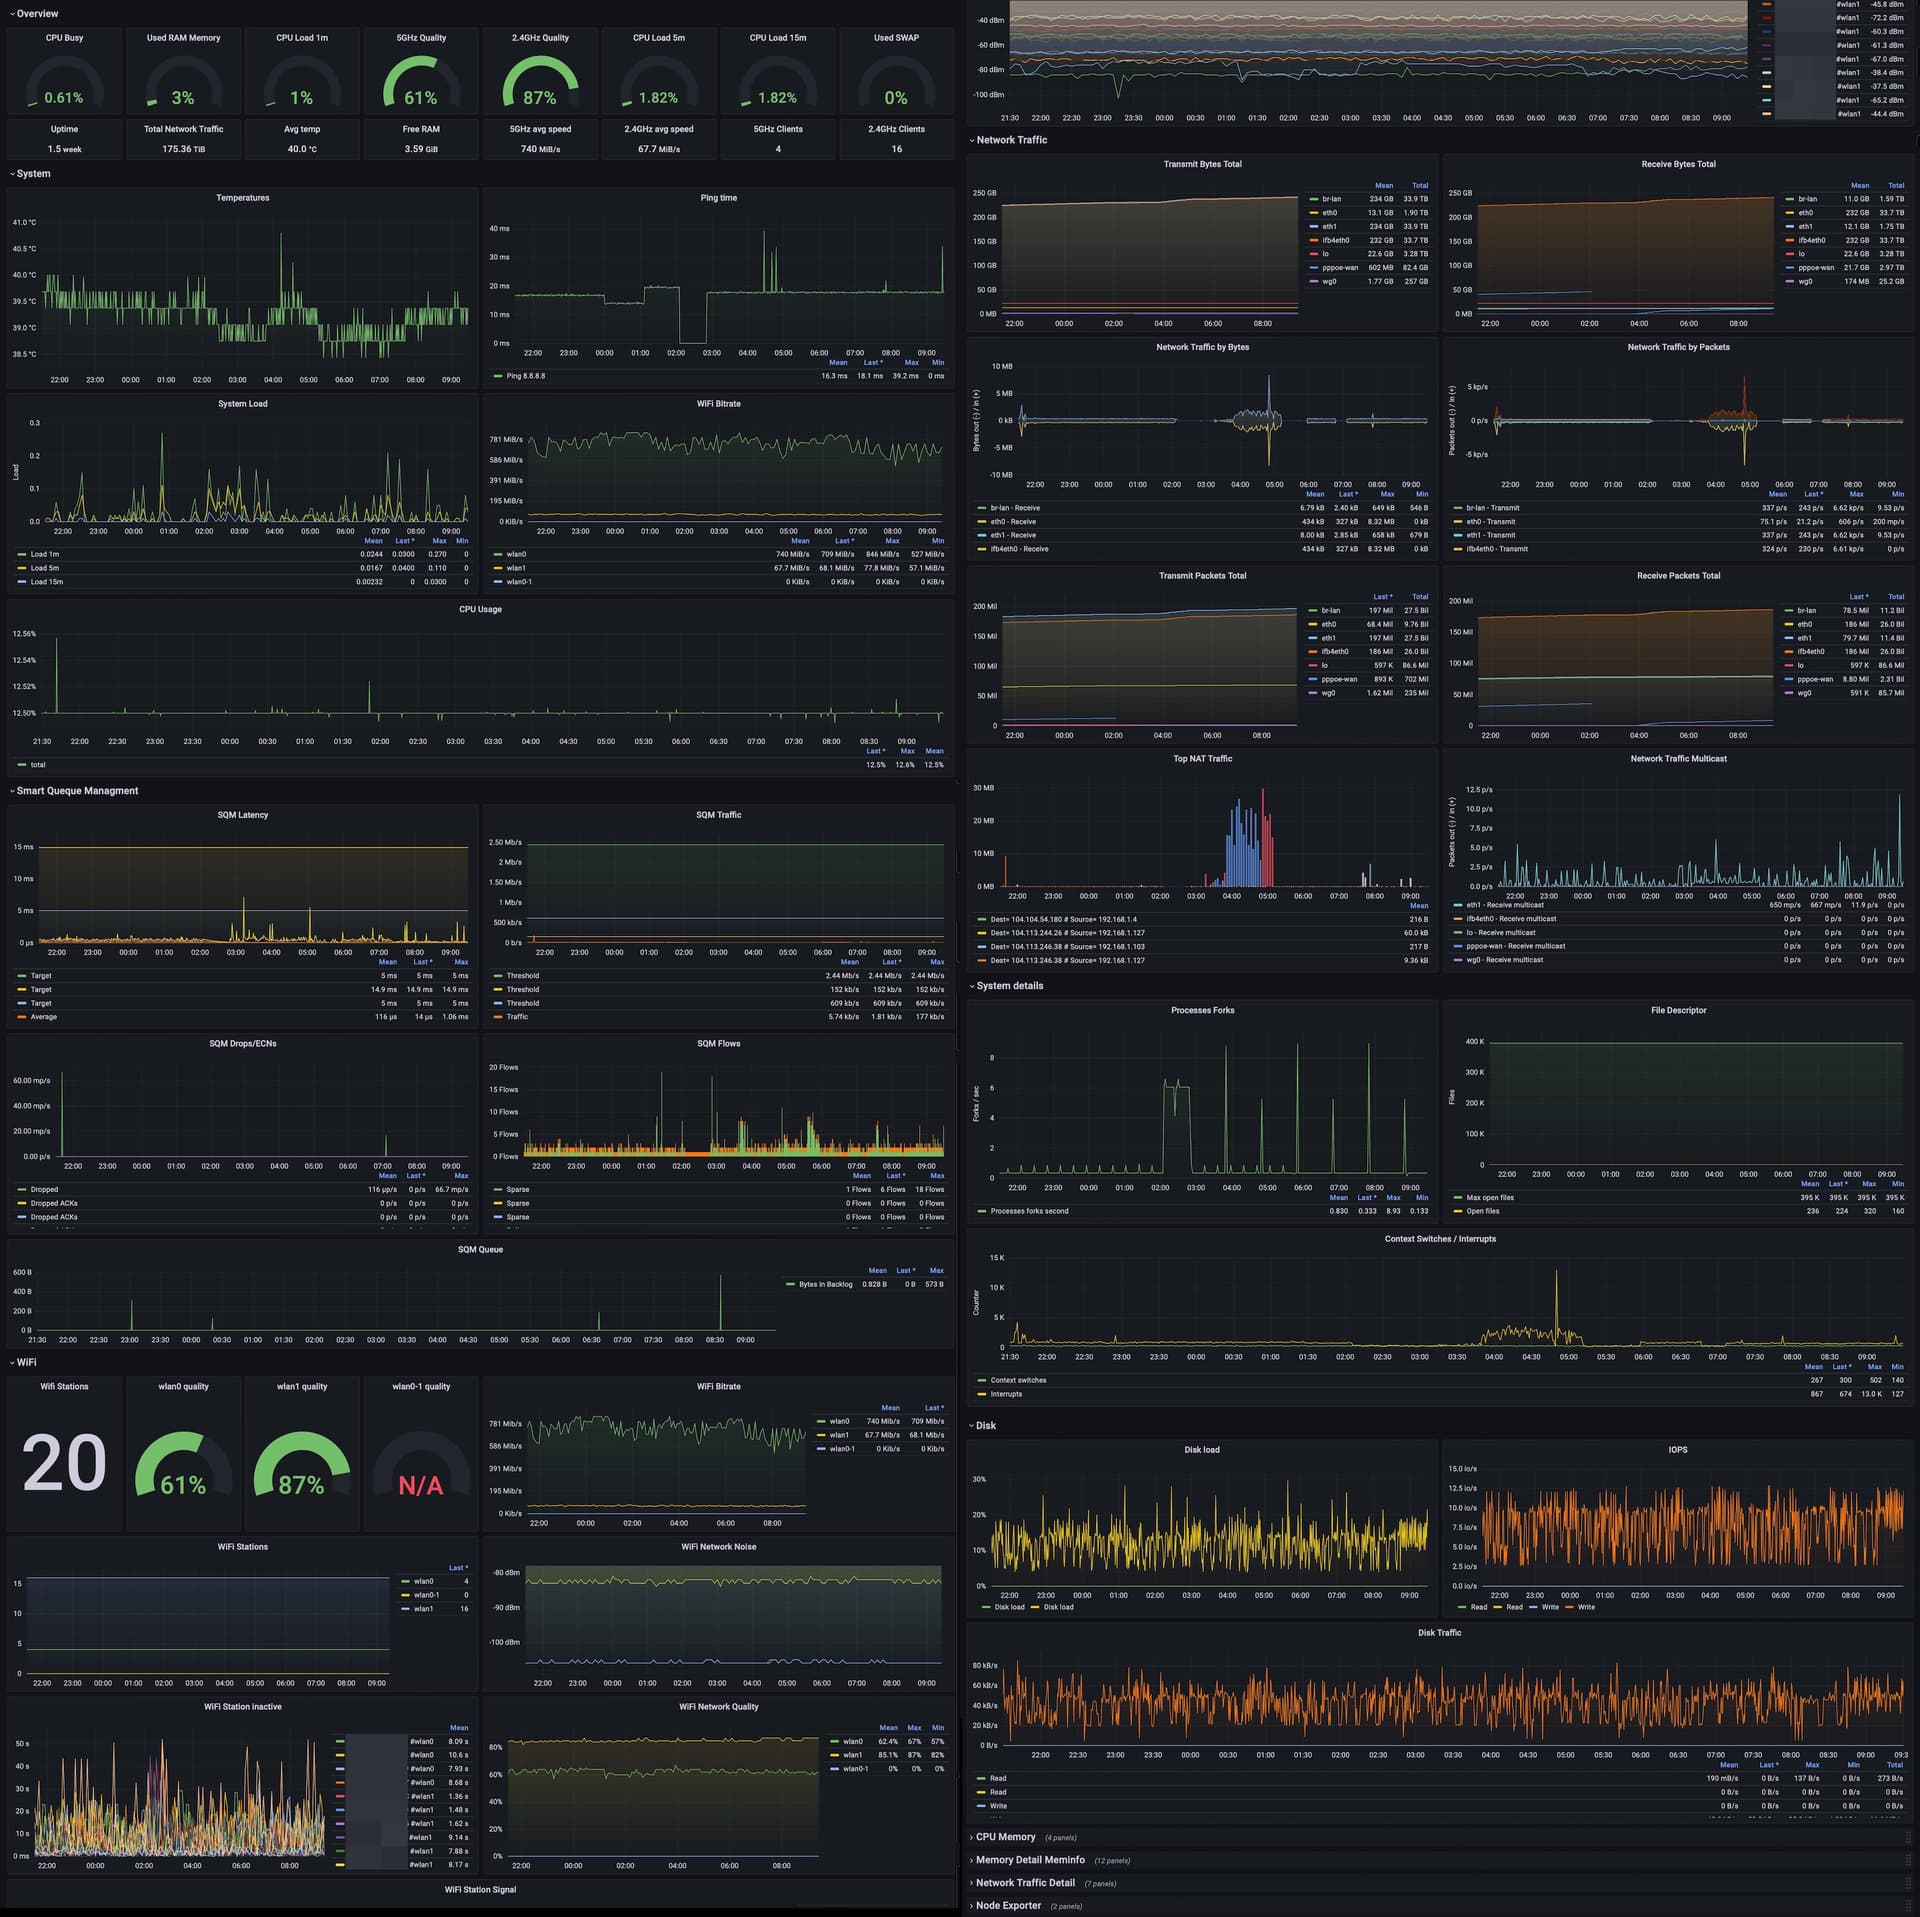
And this is the daily pdf/report (obviously it’s customizable)
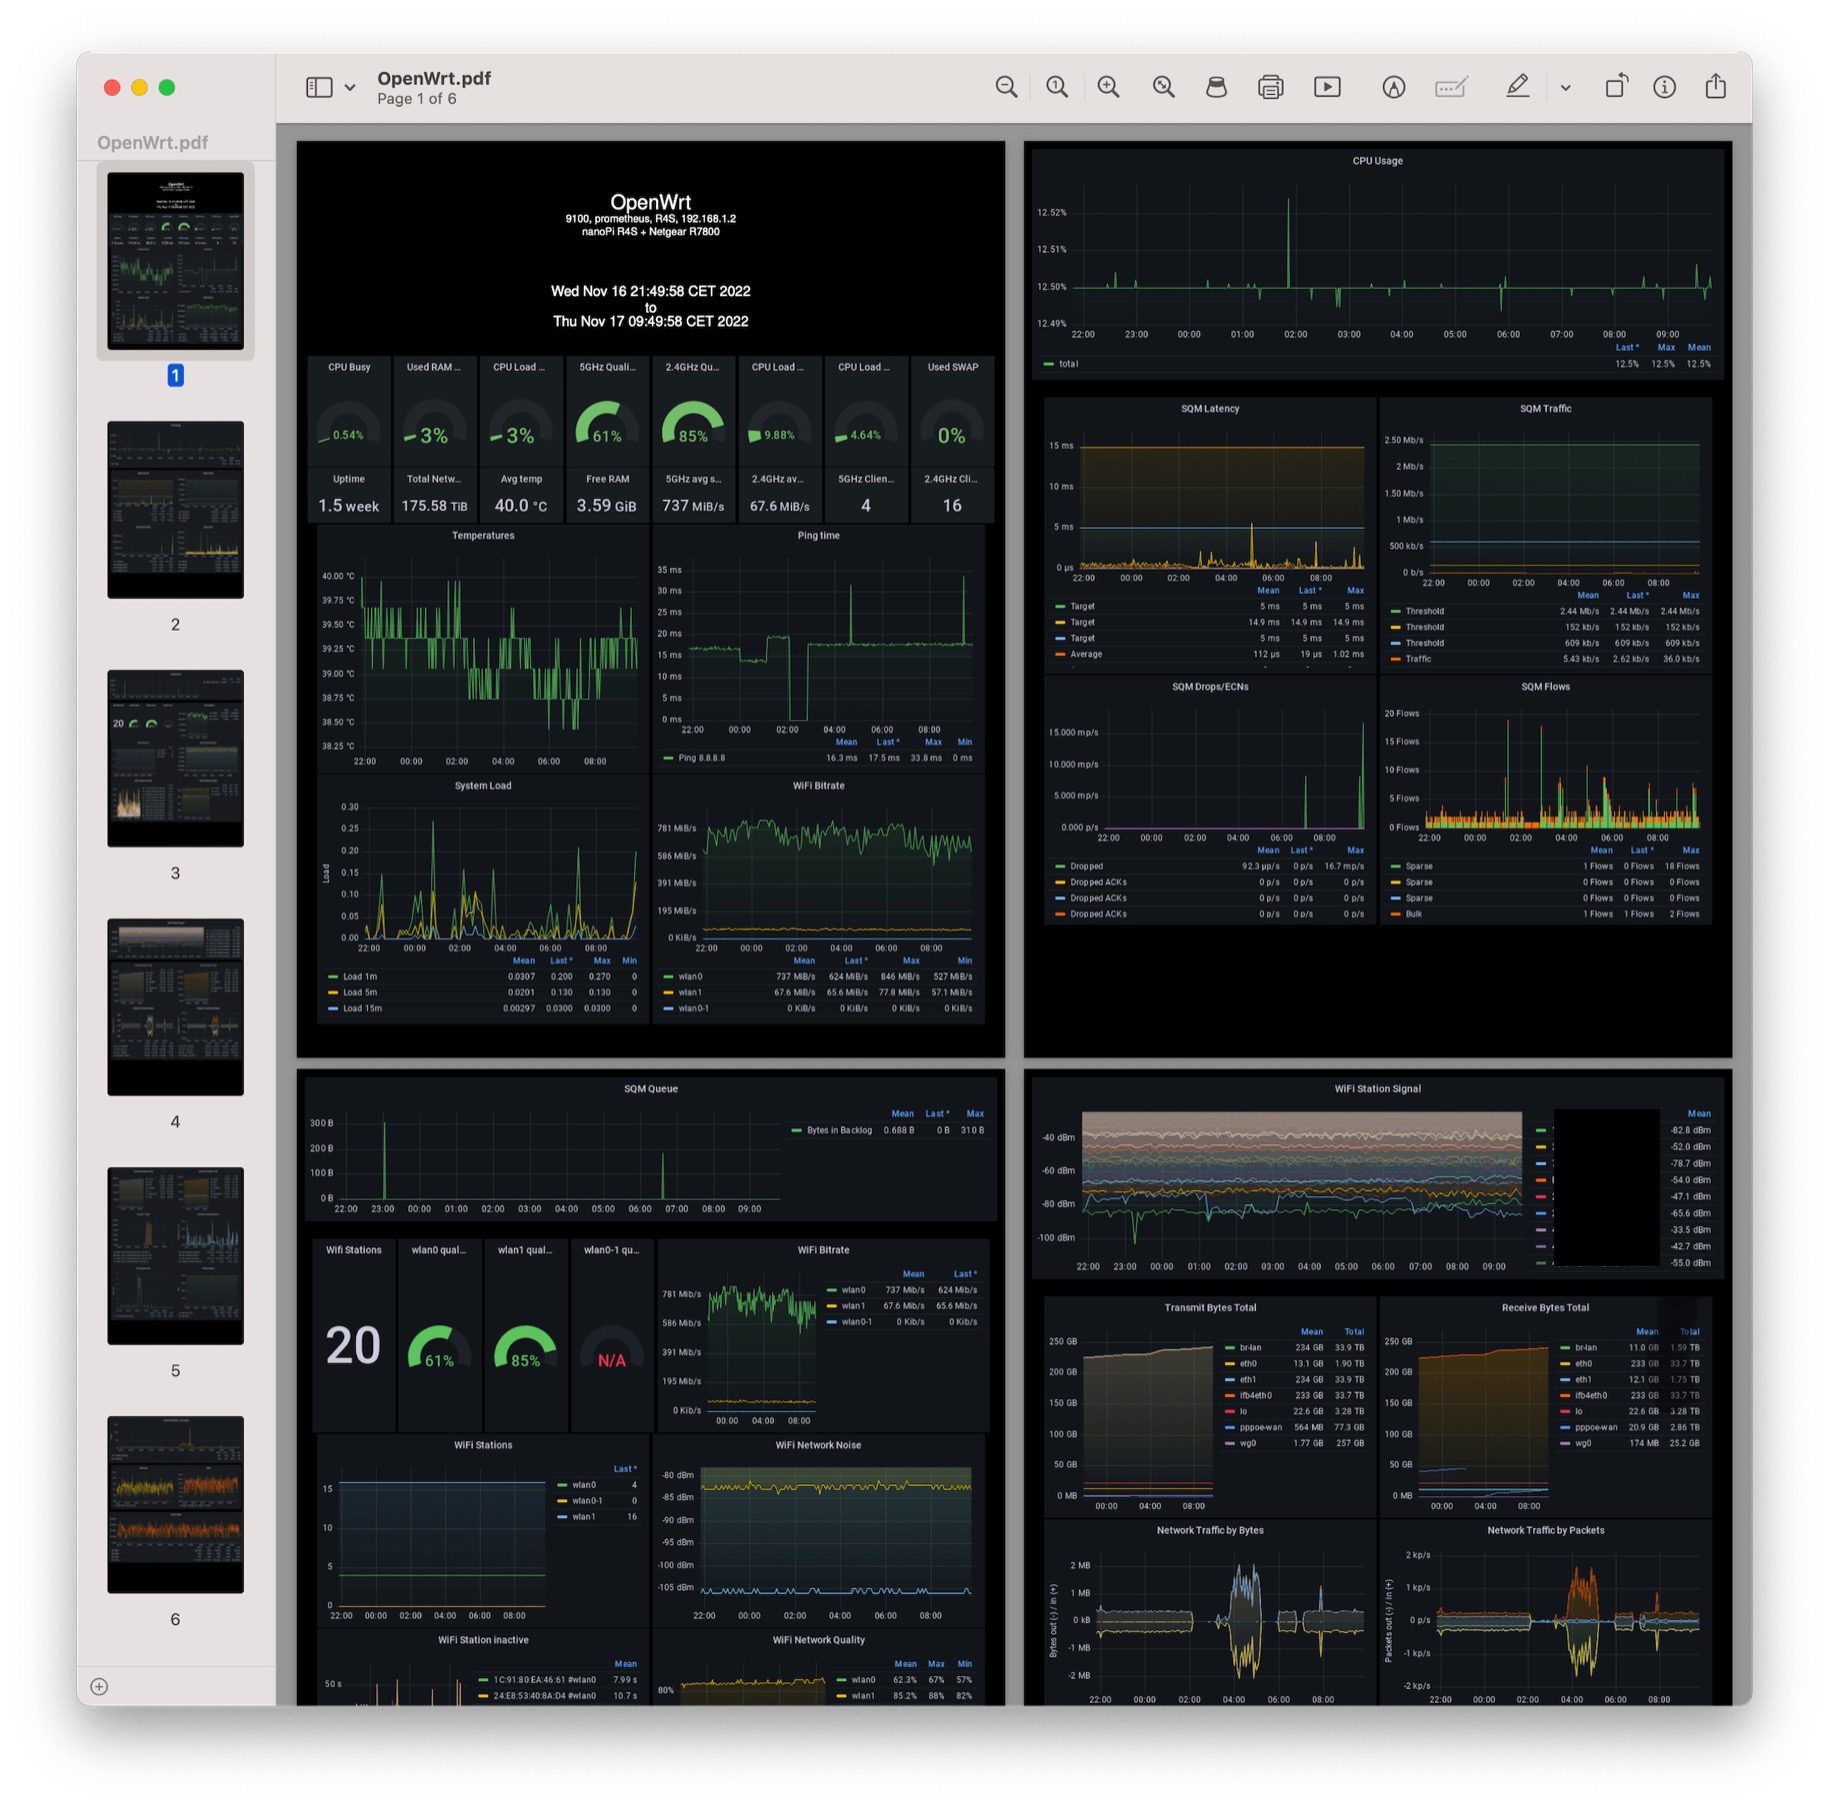
I’m getting it also from my Weather Station and Pi-hole


3 Likes
For monitoring, I tend to be more interested in seeing trends over time than instantaneous loads. It's helpful for answering the inevitable question: "Has it always been like this?"
To that end, I use https://munin-monitoring.org/ to good effect.
It's older (runs on PERL) and not as much eye-candy as the newer stuff, but it was originally designed by and for network engineers who needed to know at a glance if something was overloaded.
It presents as a webpage, so with a few clicks you can be seeing anything from today's numbers to a year-long trendline for a large number of system stats.
You can use Grafana for retrieve stats every day/week/month/year…
Indeed I’m using 3 reports day/week/month and your point is exactly why I thought about a pdf report automatically delivered to my inbox.
…the incipit of the article I’m writing is:
I spent the last few days in a long -but cool- project: a way to receive the stats of my home network, my Netatmo Weather Station, my Pi-Hole ads blocked, my servers hardware, etc…from my Grafana server delivered automatically to my inbox every $number of day/hour (usually every 24h or every week and month).
Why? Because the stats that Grafana builds are beautiful and they’re very useful if you give a glance at them regularly, in order to understand your habits and what is changing in your environment. But after few weeks of “hype” I totally forgot to see them. And this makes those beautiful dashboards, well almost useless, or less useful and interesting.
FYI: As I mentioned before, I've ordered the TP-link RJ-45 interface and as part of a hobby/work, I wanted to use a RP4 as monitoring device. It would be nice to learn. But a second reason for monitoring is, an acquaintance of me, is sure, his texts he prints, are sent over the internet to somebody who's the 'almighty'. Other than that, he's a nice guy but has weird fantasies. Therefore I would like a graphical interface who monitors in and outgoing traffic. I've seen lots of X86 devices with graphical monitoring software but I'm not investing lots of euros to prove somebody else his faults. The RP4 is redundant at the moment.
Have a great weekend.
This CM4 carrier board from DFRobot has two Gigabit ports with the second on the PCIe lane
If I could just get my hands on a CM4...
If money is no object, buy a seeedstudio cm4 router. They always seem to be in stock and come with a decent cm4
Sure, it has dual nic but one is usb, so, not suitable for gigabit internet
Not sure about seeedstudio's USB ethernet, but USB3 allows gigabit ethernet...
Oh, it's a gigabit ethernet device
but you won't get gigabit speed .. .maybe 700mbit - as opposed to 930+ on the DFRobot
I also forgot to mention, you also buy a dfrobot router board - they don't come with the CM4
That's what I did, bought the seedstudio just because it was the only way I could get a CM4 in a timely manner ![]()
1 Like