ACwifidude, do you have instructions on how to get your build that has NSS support? I’m using latest vanilla build right now, and with fq codel it can’t use the full speed my ISP provides (400mbps). I assume with NSS this speed is obtainable with fq codel?
Yep!
NSS PPPoE driver is in - give it a whirl and see what you think.
1 Like
Thank you! I got my 1GB speed back now on wired. 
I even did a factory reset to make sure. I tested default ondemand govenor and got line speed as well.
1 Like
Just tested ACwifidude out-of-the-box last release build.
Speed, tested via cli-speedtest, reachs 950 Mbps on a gigabit line... great!
New Wireguard tests: packages and configs work easily. It seems to be a little slower - around 10% - than hnyman build, but it may depend on too many factors (I'm doing tests with a cheap vps in the other part of the world). In both cases, i5 5200u with aes-ni almost doubled the speed (70% more).
1 Like
Anyone else seeing wifi upload throughput being about 100Mbps lower than download (from the perspective of a wifi client connected to the R7800)?
I run my R7800 in AP mode, there's another wired router and e.g. on a 250/250Mbps fiber I get 260/260 wired but on wifi I get about 260/160 down/up. Same if I run an iperf3 test between a wifi client and a wired Linux server, depending on the distance to the AP, I get about 500/400 down/up.
The 100Mbps asymmetry is curious and it seems to be about consistent at various throughput rates. Does it have anything to do with WMM or similar that favors downloads maybe? Though the tests are not doing download/upload at the same time.
Anyone else able to replicate the above?
I ran a new UDP test using iperf3 (wired Linux server, 2018 MacBook Pro wifi client), I can get about 530Mbps down and 800Mbps up, close enough to the router so the link speed is 1300Mbps. Not sure why one direction is that much slower than the other and when using iperf3, and it is download that is slower than upload (from the wifi client perspective).
Might be because usually encrypting takes more CPU cycles than decrypting, and the router's CPU / NSS chip is more resource-constrained when the routers encrypts and uploads data for you (to be downloaded by your wifi client) ???
That could be the case, the explanation does make sense. Didn't realize the device was not capable of full line speed encryption. I suppose I could turn WPA2 off and try it.
It's strange though that when doing an Internet speed test, I see the opposite 260/160 down/up, the upload is slower than the download. Max internet speed is 260/260 (based on wired tests) and that's well below the 500Mbps that I can see the router can handle from the iperf3 tests.
Nope, it's not encryption. I turned off WPA2, just using an unencrypted wifi connection, the results are slightly higher (perhaps within measurement error), but still a 270Mbps difference between up and down in iperf3 UDP tests.
1 Like
What about with TCP testing? Same results?
Yeah, same asymmetry.
Can someone else try to replicate? You need one wired side that runs iperf3 -s and then from the wifi client run iperf3 -c <server_or_ip> -P2 and iperf3 -c <server_or_ip> -P2 -R
For UDP I run something like iperf3 -c <server_or_ip> -u -b 800m (you can decrease the 800m until there's no or very little packet loss)
Just for fun, I updated to hnyman's latest 21.02 build (owrt2102-r15986-cc51d97200-20210410), kept the -ct driver and firmware and ran the same iperf3 TCP tests. Upload seems fine, I consistently get ~700Mbps in TCP tests close to the router (link speed 1300Mbps). But download ... it varies wildly between tests, from 130Mbps to 450Mbps.
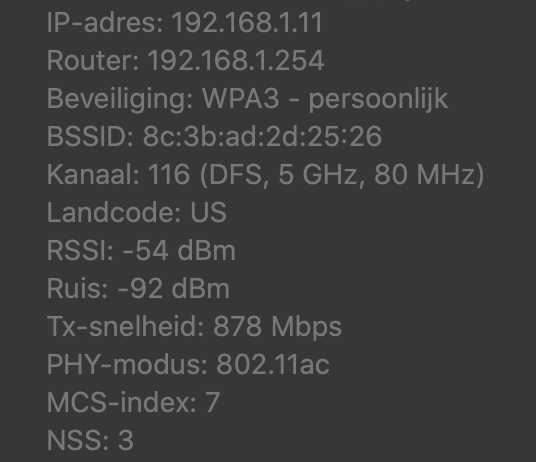
Here your go (server is a NAS running Ubuntu, client is a 15" MacBook Pro 2015)
Running on hnyman's R7800-owrt1907-r11328 with old mainline ath10k driver and firmware (from kvalo's repo).
Sitting at the kitchen table while the R7800 is in the hallway, same floor about 4meters away with a wall in between:
d43m0n@MacBookPro Downloads % ./iperf3 -c 192.168.1.9 -P2
Connecting to host 192.168.1.9, port 5201
[  6] local 192.168.1.11 port 51961 connected to 192.168.1.9 port 5201
[  8] local 192.168.1.11 port 51962 connected to 192.168.1.9 port 5201
[ ID] Interval           Transfer     Bandwidth
[  6]   0.00-1.00   sec  48.1 MBytes   403 Mbits/sec
[  8]   0.00-1.00   sec  33.5 MBytes   281 Mbits/sec
[SUM]   0.00-1.00   sec  81.7 MBytes   684 Mbits/sec
- - - - - - - - - - - - - - - - - - - - - - - - -
[  6]   1.00-2.00   sec  40.5 MBytes   340 Mbits/sec
[  8]   1.00-2.00   sec  36.2 MBytes   304 Mbits/sec
[SUM]   1.00-2.00   sec  76.8 MBytes   644 Mbits/sec
- - - - - - - - - - - - - - - - - - - - - - - - -
[  6]   2.00-3.01   sec  42.3 MBytes   353 Mbits/sec
[  8]   2.00-3.01   sec  39.0 MBytes   325 Mbits/sec
[SUM]   2.00-3.01   sec  81.3 MBytes   678 Mbits/sec
- - - - - - - - - - - - - - - - - - - - - - - - -
[  6]   3.01-4.00   sec  50.8 MBytes   429 Mbits/sec
[  8]   3.01-4.00   sec  26.4 MBytes   223 Mbits/sec
[SUM]   3.01-4.00   sec  77.2 MBytes   652 Mbits/sec
- - - - - - - - - - - - - - - - - - - - - - - - -
[  6]   4.00-5.00   sec  36.0 MBytes   302 Mbits/sec
[  8]   4.00-5.00   sec  40.4 MBytes   339 Mbits/sec
[SUM]   4.00-5.00   sec  76.4 MBytes   641 Mbits/sec
- - - - - - - - - - - - - - - - - - - - - - - - -
[  6]   5.00-6.00   sec  34.0 MBytes   285 Mbits/sec
[  8]   5.00-6.00   sec  39.8 MBytes   333 Mbits/sec
[SUM]   5.00-6.00   sec  73.8 MBytes   618 Mbits/sec
- - - - - - - - - - - - - - - - - - - - - - - - -
[  6]   6.00-7.00   sec  36.1 MBytes   303 Mbits/sec
[  8]   6.00-7.00   sec  41.7 MBytes   351 Mbits/sec
[SUM]   6.00-7.00   sec  77.8 MBytes   654 Mbits/sec
- - - - - - - - - - - - - - - - - - - - - - - - -
[  6]   7.00-8.00   sec  31.5 MBytes   264 Mbits/sec
[  8]   7.00-8.00   sec  45.8 MBytes   384 Mbits/sec
[SUM]   7.00-8.00   sec  77.3 MBytes   648 Mbits/sec
- - - - - - - - - - - - - - - - - - - - - - - - -
[  6]   8.00-9.00   sec  24.3 MBytes   204 Mbits/sec
[  8]   8.00-9.00   sec  33.5 MBytes   282 Mbits/sec
[SUM]   8.00-9.00   sec  57.8 MBytes   486 Mbits/sec
- - - - - - - - - - - - - - - - - - - - - - - - -
[  6]   9.00-10.00  sec  2.52 MBytes  21.1 Mbits/sec
[  8]   9.00-10.00  sec  3.53 MBytes  29.5 Mbits/sec
[SUM]   9.00-10.00  sec  6.05 MBytes  50.5 Mbits/sec
- - - - - - - - - - - - - - - - - - - - - - - - -
[ ID] Interval           Transfer     Bandwidth
[  6]   0.00-10.00  sec   346 MBytes   290 Mbits/sec                  sender
[  6]   0.00-10.00  sec   345 MBytes   289 Mbits/sec                  receiver
[  8]   0.00-10.00  sec   340 MBytes   285 Mbits/sec                  sender
[  8]   0.00-10.00  sec   338 MBytes   284 Mbits/sec                  receiver
[SUM]   0.00-10.00  sec   686 MBytes   575 Mbits/sec                  sender
[SUM]   0.00-10.00  sec   683 MBytes   573 Mbits/sec                  receiver

iperf Done.
and:
d43m0n@MacBookPro Downloads % ./iperf3 -c 192.168.1.9 -P2 -R
Connecting to host 192.168.1.9, port 5201
Reverse mode, remote host f12.thuis is sending
[  6] local 192.168.1.11 port 51985 connected to 192.168.1.9 port 5201
[  8] local 192.168.1.11 port 51986 connected to 192.168.1.9 port 5201
[ ID] Interval           Transfer     Bandwidth
[  6]   0.00-1.00   sec  41.7 MBytes   350 Mbits/sec
[  8]   0.00-1.00   sec  41.7 MBytes   350 Mbits/sec
[SUM]   0.00-1.00   sec  83.5 MBytes   700 Mbits/sec
- - - - - - - - - - - - - - - - - - - - - - - - -
[  6]   1.00-2.00   sec  41.0 MBytes   344 Mbits/sec
[  8]   1.00-2.00   sec  41.0 MBytes   344 Mbits/sec
[SUM]   1.00-2.00   sec  81.9 MBytes   687 Mbits/sec
- - - - - - - - - - - - - - - - - - - - - - - - -
[  6]   2.00-3.00   sec  41.3 MBytes   346 Mbits/sec
[  8]   2.00-3.00   sec  41.3 MBytes   346 Mbits/sec
[SUM]   2.00-3.00   sec  82.6 MBytes   693 Mbits/sec
- - - - - - - - - - - - - - - - - - - - - - - - -
[  6]   3.00-4.00   sec  42.3 MBytes   355 Mbits/sec
[  8]   3.00-4.00   sec  42.1 MBytes   353 Mbits/sec
[SUM]   3.00-4.00   sec  84.4 MBytes   708 Mbits/sec
- - - - - - - - - - - - - - - - - - - - - - - - -
[  6]   4.00-5.00   sec  41.7 MBytes   350 Mbits/sec
[  8]   4.00-5.00   sec  41.7 MBytes   349 Mbits/sec
[SUM]   4.00-5.00   sec  83.4 MBytes   699 Mbits/sec
- - - - - - - - - - - - - - - - - - - - - - - - -
[  6]   5.00-6.00   sec  41.7 MBytes   350 Mbits/sec
[  8]   5.00-6.00   sec  41.8 MBytes   350 Mbits/sec
[SUM]   5.00-6.00   sec  83.5 MBytes   700 Mbits/sec
- - - - - - - - - - - - - - - - - - - - - - - - -
[  6]   6.00-7.00   sec  42.5 MBytes   356 Mbits/sec
[  8]   6.00-7.00   sec  42.5 MBytes   357 Mbits/sec
[SUM]   6.00-7.00   sec  85.0 MBytes   713 Mbits/sec
- - - - - - - - - - - - - - - - - - - - - - - - -
[  6]   7.00-8.00   sec  42.8 MBytes   359 Mbits/sec
[  8]   7.00-8.00   sec  42.7 MBytes   358 Mbits/sec
[SUM]   7.00-8.00   sec  85.5 MBytes   717 Mbits/sec
- - - - - - - - - - - - - - - - - - - - - - - - -
[  6]   8.00-9.00   sec  42.7 MBytes   358 Mbits/sec
[  8]   8.00-9.00   sec  42.3 MBytes   355 Mbits/sec
[SUM]   8.00-9.00   sec  85.0 MBytes   713 Mbits/sec
- - - - - - - - - - - - - - - - - - - - - - - - -
[  6]   9.00-10.00  sec  41.7 MBytes   350 Mbits/sec
[  8]   9.00-10.00  sec  41.8 MBytes   350 Mbits/sec
[SUM]   9.00-10.00  sec  83.5 MBytes   700 Mbits/sec
- - - - - - - - - - - - - - - - - - - - - - - - -
[ ID] Interval           Transfer     Bandwidth       Retr
[  6]   0.00-10.00  sec   430 MBytes   361 Mbits/sec    0             sender
[  6]   0.00-10.00  sec   421 MBytes   353 Mbits/sec                  receiver
[  8]   0.00-10.00  sec   430 MBytes   361 Mbits/sec    0             sender
[  8]   0.00-10.00  sec   421 MBytes   353 Mbits/sec                  receiver
[SUM]   0.00-10.00  sec   860 MBytes   722 Mbits/sec    0             sender
[SUM]   0.00-10.00  sec   842 MBytes   706 Mbits/sec                  receiver

iperf Done.
and:
d43m0n@MacBookPro Downloads % ./iperf3 -c 192.168.1.9 -u -b 800m
Connecting to host 192.168.1.9, port 5201
[  4] local 192.168.1.11 port 58342 connected to 192.168.1.9 port 5201
[ ID] Interval           Transfer     Bandwidth       Total Datagrams
[  4]   0.00-1.00   sec  88.2 MBytes   738 Mbits/sec  11288
[  4]   1.00-2.00   sec  95.1 MBytes   798 Mbits/sec  12174
[  4]   2.00-3.00   sec  95.4 MBytes   802 Mbits/sec  12215
[  4]   3.00-4.01   sec  95.3 MBytes   796 Mbits/sec  12200
[  4]   4.01-5.00   sec  95.0 MBytes   799 Mbits/sec  12161
[  4]   5.00-6.00   sec  96.2 MBytes   807 Mbits/sec  12313
[  4]   6.00-7.00   sec  94.9 MBytes   796 Mbits/sec  12143
[  4]   7.00-8.00   sec  95.5 MBytes   800 Mbits/sec  12218
[  4]   8.00-9.00   sec  95.5 MBytes   802 Mbits/sec  12230
[  4]   9.00-10.00  sec  95.3 MBytes   800 Mbits/sec  12193
- - - - - - - - - - - - - - - - - - - - - - - - -
[ ID] Interval           Transfer     Bandwidth       Jitter    Lost/Total Datagrams
[  4]   0.00-10.00  sec   946 MBytes   794 Mbits/sec  0.063 ms  16654/69850 (24%)
[  4] Sent 69850 datagrams

iperf Done.
and:
d43m0n@MacBookPro Downloads % ./iperf3 -c 192.168.1.9 -u -b 600m
Connecting to host 192.168.1.9, port 5201
[  4] local 192.168.1.11 port 59704 connected to 192.168.1.9 port 5201
[ ID] Interval           Transfer     Bandwidth       Total Datagrams
[  4]   0.00-1.00   sec  65.7 MBytes   551 Mbits/sec  8411
[  4]   1.00-2.00   sec  71.8 MBytes   601 Mbits/sec  9189
[  4]   2.00-3.00   sec  71.5 MBytes   601 Mbits/sec  9157
[  4]   3.00-4.00   sec  71.1 MBytes   597 Mbits/sec  9103
[  4]   4.00-5.00   sec  71.6 MBytes   600 Mbits/sec  9163
[  4]   5.00-6.00   sec  71.5 MBytes   599 Mbits/sec  9147
[  4]   6.00-7.00   sec  71.5 MBytes   600 Mbits/sec  9155
[  4]   7.00-8.00   sec  71.5 MBytes   599 Mbits/sec  9157
[  4]   8.00-9.00   sec  71.6 MBytes   602 Mbits/sec  9171
[  4]   9.00-10.00  sec  71.5 MBytes   599 Mbits/sec  9151
- - - - - - - - - - - - - - - - - - - - - - - - -
[ ID] Interval           Transfer     Bandwidth       Jitter    Lost/Total Datagrams
[  4]   0.00-10.00  sec   709 MBytes   595 Mbits/sec  0.074 ms  5262/90803 (5.8%)
[  4] Sent 90803 datagrams

iperf Done.
and finally:
d43m0n@MacBookPro Downloads % ./iperf3 -c 192.168.1.9 -u -b 500m
Connecting to host 192.168.1.9, port 5201
[  4] local 192.168.1.11 port 65267 connected to 192.168.1.9 port 5201
[ ID] Interval           Transfer     Bandwidth       Total Datagrams
[  4]   0.00-1.00   sec  54.8 MBytes   458 Mbits/sec  7020
[  4]   1.00-2.00   sec  59.3 MBytes   499 Mbits/sec  7596
[  4]   2.00-3.00   sec  59.8 MBytes   502 Mbits/sec  7655
[  4]   3.00-4.00   sec  59.5 MBytes   499 Mbits/sec  7611
[  4]   4.00-5.00   sec  59.6 MBytes   500 Mbits/sec  7629
[  4]   5.00-6.00   sec  59.7 MBytes   501 Mbits/sec  7643
[  4]   6.00-7.00   sec  59.3 MBytes   497 Mbits/sec  7585
[  4]   7.00-8.00   sec  59.9 MBytes   502 Mbits/sec  7670
[  4]   8.00-9.00   sec  59.6 MBytes   500 Mbits/sec  7625
[  4]   9.00-10.00  sec  59.7 MBytes   500 Mbits/sec  7637
- - - - - - - - - - - - - - - - - - - - - - - - -
[ ID] Interval           Transfer     Bandwidth       Jitter    Lost/Total Datagrams
[  4]   0.00-10.00  sec   591 MBytes   496 Mbits/sec  0.000 ms  0/0 (0%)
[  4] Sent 0 datagrams

iperf Done.
And reversed UDP:
d43m0n@MacBookPro Downloads % ./iperf3 -c 192.168.1.9 -u -b 800m -R
Connecting to host 192.168.1.9, port 5201
Reverse mode, remote host 192.168.1.9 is sending
[  4] local 192.168.1.11 port 60970 connected to 192.168.1.9 port 5201
[ ID] Interval           Transfer     Bandwidth       Jitter    Lost/Total Datagrams
[  4]   0.00-1.00   sec  81.6 MBytes   685 Mbits/sec  0.118 ms  1192/11642 (10%)
[  4]   1.00-2.00   sec  80.6 MBytes   676 Mbits/sec  0.135 ms  1860/12178 (15%)
[  4]   2.00-3.00   sec  80.6 MBytes   677 Mbits/sec  0.173 ms  1965/12288 (16%)
[  4]   3.00-4.00   sec  80.5 MBytes   675 Mbits/sec  0.157 ms  1746/12051 (14%)
[  4]   4.00-5.00   sec  80.5 MBytes   675 Mbits/sec  0.124 ms  1977/12282 (16%)
[  4]   5.00-6.00   sec  80.6 MBytes   677 Mbits/sec  0.137 ms  1925/12248 (16%)
[  4]   6.00-7.00   sec  77.2 MBytes   648 Mbits/sec  0.110 ms  2287/12169 (19%)
[  4]   7.00-8.00   sec  80.7 MBytes   677 Mbits/sec  0.162 ms  1883/12215 (15%)
[  4]   8.00-9.00   sec  77.9 MBytes   653 Mbits/sec  0.126 ms  2246/12216 (18%)
[  4]   9.00-10.00  sec  76.8 MBytes   644 Mbits/sec  0.135 ms  2358/12185 (19%)
- - - - - - - - - - - - - - - - - - - - - - - - -
[ ID] Interval           Transfer     Bandwidth       Jitter    Lost/Total Datagrams
[  4]   0.00-10.00  sec   957 MBytes   803 Mbits/sec  0.138 ms  19676/122487 (16%)
[  4] Sent 122487 datagrams

iperf Done.
and:
d43m0n@MacBookPro Downloads % ./iperf3 -c 192.168.1.9 -u -b 600m -R
Connecting to host 192.168.1.9, port 5201
Reverse mode, remote host 192.168.1.9 is sending
[  4] local 192.168.1.11 port 62092 connected to 192.168.1.9 port 5201
[ ID] Interval           Transfer     Bandwidth       Jitter    Lost/Total Datagrams
[  4]   0.00-1.00   sec  71.4 MBytes   599 Mbits/sec  0.133 ms  0/9140 (0%)
[  4]   1.00-2.00   sec  70.7 MBytes   593 Mbits/sec  0.130 ms  0/9054 (0%)
[  4]   2.00-3.00   sec  72.4 MBytes   607 Mbits/sec  0.170 ms  0/9269 (0%)
[  4]   3.00-4.00   sec  71.5 MBytes   600 Mbits/sec  0.161 ms  0/9155 (0%)
[  4]   4.00-5.00   sec  71.4 MBytes   599 Mbits/sec  0.149 ms  2/9139 (0.022%)
[  4]   5.00-6.00   sec  71.6 MBytes   601 Mbits/sec  0.145 ms  0/9170 (0%)
[  4]   6.00-7.00   sec  71.5 MBytes   600 Mbits/sec  0.155 ms  0/9153 (0%)
[  4]   7.00-8.00   sec  69.6 MBytes   584 Mbits/sec  0.148 ms  254/9160 (2.8%)
[  4]   8.00-9.00   sec  71.4 MBytes   599 Mbits/sec  0.114 ms  0/9145 (0%)
[  4]   9.00-10.00  sec  71.6 MBytes   601 Mbits/sec  0.151 ms  0/9166 (0%)
- - - - - - - - - - - - - - - - - - - - - - - - -
[ ID] Interval           Transfer     Bandwidth       Jitter    Lost/Total Datagrams
[  4]   0.00-10.00  sec   715 MBytes   600 Mbits/sec  0.142 ms  256/91578 (0.28%)
[  4] Sent 91578 datagrams

iperf Done.
and finally:
d43m0n@MacBookPro Downloads % ./iperf3 -c 192.168.1.9 -u -b 500m -R
Connecting to host 192.168.1.9, port 5201
Reverse mode, remote host 192.168.1.9 is sending
[  4] local 192.168.1.11 port 64446 connected to 192.168.1.9 port 5201
[ ID] Interval           Transfer     Bandwidth       Jitter    Lost/Total Datagrams
[  4]   0.00-1.00   sec  59.2 MBytes   496 Mbits/sec  0.186 ms  44/7619 (0.58%)
[  4]   1.00-2.00   sec  58.1 MBytes   488 Mbits/sec  0.192 ms  25/7468 (0.33%)
[  4]   2.00-3.00   sec  60.7 MBytes   509 Mbits/sec  0.160 ms  26/7797 (0.33%)
[  4]   3.00-4.00   sec  59.6 MBytes   500 Mbits/sec  0.140 ms  0/7630 (0%)
[  4]   4.00-5.00   sec  59.6 MBytes   500 Mbits/sec  0.158 ms  0/7629 (0%)
[  4]   5.00-6.00   sec  59.6 MBytes   500 Mbits/sec  0.238 ms  0/7629 (0%)
[  4]   6.00-7.00   sec  59.6 MBytes   500 Mbits/sec  0.131 ms  5/7630 (0.066%)
[  4]   7.00-8.00   sec  59.5 MBytes   499 Mbits/sec  0.131 ms  14/7628 (0.18%)
[  4]   8.00-9.00   sec  59.6 MBytes   500 Mbits/sec  0.141 ms  4/7633 (0.052%)
[  4]   9.00-10.00  sec  59.6 MBytes   500 Mbits/sec  0.122 ms  0/7626 (0%)
- - - - - - - - - - - - - - - - - - - - - - - - -
[ ID] Interval           Transfer     Bandwidth       Jitter    Lost/Total Datagrams
[  4]   0.00-10.00  sec   596 MBytes   500 Mbits/sec  0.162 ms  118/76313 (0.15%)
[  4] Sent 76313 datagrams

iperf Done.
And to make notice of the reverse direction, I get quit a few times this:
d43m0n@MacBookPro Downloads % ./iperf3 -c 192.168.1.9 -u -b 800m -R
Connecting to host 192.168.1.9, port 5201
Reverse mode, remote host 192.168.1.9 is sending
[  4] local 192.168.1.11 port 56341 connected to 192.168.1.9 port 5201
[ ID] Interval           Transfer     Bandwidth       Jitter    Lost/Total Datagrams
[  4]   0.00-1.00   sec  88.5 MBytes   742 Mbits/sec  0.104 ms  382/11707 (3.3%)
[  4]   1.00-2.00   sec  89.6 MBytes   752 Mbits/sec  0.086 ms  724/12199 (5.9%)
[  4]   2.00-3.00   sec  92.1 MBytes   772 Mbits/sec  0.123 ms  431/12214 (3.5%)
[  4]   3.00-4.00   sec  90.8 MBytes   762 Mbits/sec  0.093 ms  583/12208 (4.8%)
[  4]   4.00-5.00   sec  88.9 MBytes   746 Mbits/sec  0.138 ms  804/12187 (6.6%)
iperf3: OUT OF ORDER - incoming packet = 348 and received packet = 65883 AND SP = 4
iperf3: OUT OF ORDER - incoming packet = 528 and received packet = 66063 AND SP = 4
iperf3: OUT OF ORDER - incoming packet = 696 and received packet = 66231 AND SP = 4
iperf3: OUT OF ORDER - incoming packet = 1030 and received packet = 66565 AND SP = 4
iperf3: OUT OF ORDER - incoming packet = 1366 and received packet = 66901 AND SP = 4
iperf3: OUT OF ORDER - incoming packet = 1536 and received packet = 67071 AND SP = 4
This happened with -b 800m, 600m and 500m in combination with -R. Is that:
iperf3: OUT OF ORDER - incoming packet = 528 and received packet = 66063 AND SP = 4
what you're looking for?
Interesting, you are seeing a difference also between up and down though it's closer depending on the run, but it's the opposite of what I'm seeing. Go figure. Wifi is all over the place.
FWIW, you can repeat the UDP tests with the -R flag, to test the other direction.
You're right, I've added that to my post above.
Anyone noticed if yoiur wifi speeds degrades over time? I have that feeling, if I reboot the router everything is fast again.
It could just be one of my wifi > eth bridge adapters.
Maybe you have this problem?
I'm really curious whether others are seeing terrible performance with the ct firmware vs the mainline firmware.
No, not really in an iperf test with ath10k or ath10k-ct. Mainly stability and a noticeable lag on quick response. This latter one needs a bit of explaining.
The stability is something that happens not only on my MacBook Pro, but also on the Windows 10 laptop my wife is working on from home. After about 7 hours working from home, we both experience WiFi issues. Other devices, like the iPads of iPhones might not have that immediately, but soon will experience that too.
The noticeable lag is best described by how I see this happening on the Twitter app on my iPhone, or how the Teams app on my MacBook Pro behaves:
Twitter behavior
With ath10k-ct: when browsing the timeline, I open a tweet that has responses, each time I want to view other responses, it takes a few seconds before they are loaded by the Twitter app. When I switch driver and firmware to mainline ath10k responses load “instantly”. I can reproduce this every time. It has become my test method to determine whether ath10k-ct has been improved or not.
Teams behavior
With ath10k-ct: when chatting with someone directly you get this feedback when a message is delivered, read or when someone is typing. You also see a status indicator if someone is available, in a meeting, presenting or is away. I’ve found that this type of feedback often doesn’t work or not reliably. The Teams app is unable to recover this, unless I close and start the app again. I’ve asked others whether they have the same experience at the same time or wether there are Azure issues but the answer is no. When I switch driver and firmware to mainline ath10k these issues don’t come back.
From what I can make of it, with the -ct driver and firmware; once a large stream (download or an active video call) is active the performance is okay, bit with tiny requests it takes a long time (a few seconds with the Twitter app) or the request simply times out (the Teams app on my MBP).