Qosify: new package for DSCP marking + cake

The thick black line is the average goodput, to get to the aggregate goodput (which still ignores headers) you need to multiply that number with the number of testing flows, so in your first test
Download: ~33*4 = 132 Mbps
Upload: ~33.6*4 = 134.4 Mbps
in the second test I see:
Download: ~32*4 = 128 Mbps
Upload: ~33*4 = 132 Mbps

With your shaper settings you can expect at best a IPv4/TCP goodput of:
144 * ((1500-20-20)/(1500+38)) = 136.7 Mbps

I would respectfully argue that your measured numbers are not really that low :wink:

2 Likes

Ah. Well then I learned something new today, and that’s awesome @moeller0.

Can I add a question to the result and overhead. My isp do have a vlan and reading the cake man, it’s referring to adding 4 to the overhead. I’m not using this vlan tho.

Should I change my overhead to 42 instead of 38?

This is a somewhat tricky question to answer, as it really dpends on the exact stack your link uses. Fiber 150/150 can be anything from GPON/EPON, true ethernet, and for some honesty-challenged ISPs even G.fast with fiber-uplink.

However from a latency perspective the throughput cost of making an error and assuming an overhead 4 bytes too large will be hard to measure with speed tests, while getting the overhead 4 bytes to small can already result in measurable increases in latency under load (measurable does not mean that on casual use one will notice). The point is for overhead it is better to err on the side of too large than too little.

That seems like the safe thing to do with little side-effects.

1 Like

Thanks, I'll try that and do some more testing :+1:

This got me curious. So i did some searching and this fiber is AON (Active Optical Network). In the bridge (box) there is a fiber SC port (AXGE-1651) TX(1310nm)/RX(1550nm), that converts to Ethernet with MDI/MDIX support, to my APU2E4. That's all I know, so I'm sorry I can't give more input here. My ping to 1.1.1.1 is 2ms btw. But the flent server is not so close so it's around 15-ish.

And one thing I noticed, or I think it is, that download and upload have different overhead and mpu. Is that plain stupid or could that be?

But thanks for giving feedback on these questions. Really interesting :slight_smile:

In networking almost everything you can imagine is possible... how likely asymmetric solutions are is a different question, but possible certainly. What makes you think you need to specify different overheads per direction though? (Currently sqm-scripts is not really prepared for that, so you would need to configure it with the maximum of the up- and download direction overhead and mpu values).

That part seems to be designed for 1000BASE-BX10 so that would be plain old ethernet encapsulation, great! In that case 38 bytes or 42 bytes with a VLAN seem to be the correct values to configure... (that said for GPON even though we do not know the exact overhead 38/42 still are pretty useful/conservative values to start with).

The flent-gui has a few dozen output plots. This is the one that shows the most detail. Others include totals, and box or bar charts. Really, really nice result here! You can try turning on ecn support on your client.

Thank you. I think I'm done now, and after too many test I've settled with the following. I'm not 100% satisfied, but I recon it's good enough. And yes, you are right. There is so many test, and I don't know what 50% of them do. :slightly_smiling_face:

Here is some data for you. I know you like data...

===== interface wan: active =====
egress status:
qdisc cake 808b: root refcnt 9 bandwidth 145Mbit diffserv4 dual-srchost nat nowash no-ack-filter no-split-gso rtt 100ms noatm overhead 38 mpu 76
 Sent 1064974934 bytes 1050206 pkt (dropped 485, overlimits 969815 requeues 7)
 backlog 0b 0p requeues 7
 memory used: 682752b of 7250000b
 capacity estimate: 145Mbit
 min/max network layer size:           28 /    1500
 min/max overhead-adjusted size:       76 /    1538
 average network hdr offset:           14

                   Bulk  Best Effort        Video        Voice
  thresh       9062Kbit      145Mbit    72500Kbit    36250Kbit
  target            5ms          5ms          5ms          5ms
  interval        100ms        100ms        100ms        100ms
  pk_delay       6.06ms        684us          0us        613us
  av_delay       1.96ms        375us          0us        330us
  sp_delay         38us          5us          0us          6us
  backlog            0b           0b           0b           0b
  pkts           114258       190084            0       277080
  bytes        65951436    729809782            0    270662680
  way_inds            0            0            0            0
  way_miss            2           53            0          189
  way_cols            0            0            0            0
  drops             195           30            0          260
  marks               0            0            0            0
  ack_drop            0            0            0            0
  sp_flows            1            1            0            3
  bk_flows            0            1            0            0
  un_flows            0            0            0            0
  max_len          7570        24224            0        18168
  quantum           300         1514         1514         1106


ingress status:
qdisc cake 808c: root refcnt 2 bandwidth 145Mbit diffserv4 dual-dsthost nat nowash ingress no-ack-filter no-split-gso rtt 100ms noatm overhead 46 mpu 92
 Sent 1058422342 bytes 884617 pkt (dropped 313, overlimits 1385952 requeues 0)
 backlog 0b 0p requeues 0
 memory used: 716544b of 7250000b
 capacity estimate: 145Mbit
 min/max network layer size:           46 /    1500
 min/max overhead-adjusted size:       92 /    1546
 average network hdr offset:           14

                   Bulk  Best Effort        Video        Voice
  thresh       9062Kbit      145Mbit    72500Kbit    36250Kbit
  target            5ms          5ms          5ms          5ms
  interval        100ms        100ms        100ms        100ms
  pk_delay          0us        118us          0us         82us
  av_delay          0us         35us          0us          2us
  sp_delay          0us          6us          0us          2us
  backlog            0b           0b           0b           0b
  pkts                0       884918            0           12
  bytes               0   1058895354            0          870
  way_inds            0            0            0            0
  way_miss            0           57            0            5
  way_cols            0            0            0            0
  drops               0          313            0            0
  marks               0            0            0            0
  ack_drop            0            0            0            0
  sp_flows            0            1            0            1
  bk_flows            0            1            0            0
  un_flows            0            0            0            0
  max_len             0         1514            0           90
  quantum           300         1514         1514         1106

On the download image the text is wrong, it's the same as the 60 second test. And to be honest I dunno why no-split-gso works better overall. And is probably against all common sense. But it's more "stable". I also think my ISP is removing DSCP from ingress looking at the results. They should split up like upload?

option ingress_options "overhead 46 mpu 92 no-split-gso"
option egress_options "overhead 38 mpu 76 no-split-gso"

2023-09-26-2005-download

2023-09-26-2005

Can I ask you a question @dtaht. Is it possible to use another ping server while doing tests?

1 Like

yes, it seems likely your ISP is washing out dscp on the download.

yes, other ping servers can be used, but I forget how @tohojo , and support may not be in this test! grepping through the sources might help, reading the man page or web site... I have not touched flent in 7 years or so!

GSO-splitting is cpu intensive, and at the rates you are running at, less needed than it used to be. Also modern stacks send less data at a time, your results seem to indicate that the most that ever arrives in a burst is twice as big as an IW10 window. At 150mbit, unless my math is off, that is less than 2ms of induced delay from that burst, which is fine. Also the rrul test does not really test for voip traffic as well as I would like, which is where gso-splitting helps.

Ah, thanks for the information. There's is one thing that bothers me, just plain simple browser stuff doesn't feel snappy anymore. Using Opnsense and dnsmasq was snappy, but Opnsense and unbound was not. It's hard to know why and what. But that's what I'm aiming for.

But I'll see what I can do with that.

Again, thanks for the input :slightly_smiling_face:

hi how you obtain this graphics please ? thanks

Hello. I'm using https://flent.org/
Just follow the instructions on the page :slightly_smiling_face:

1 Like

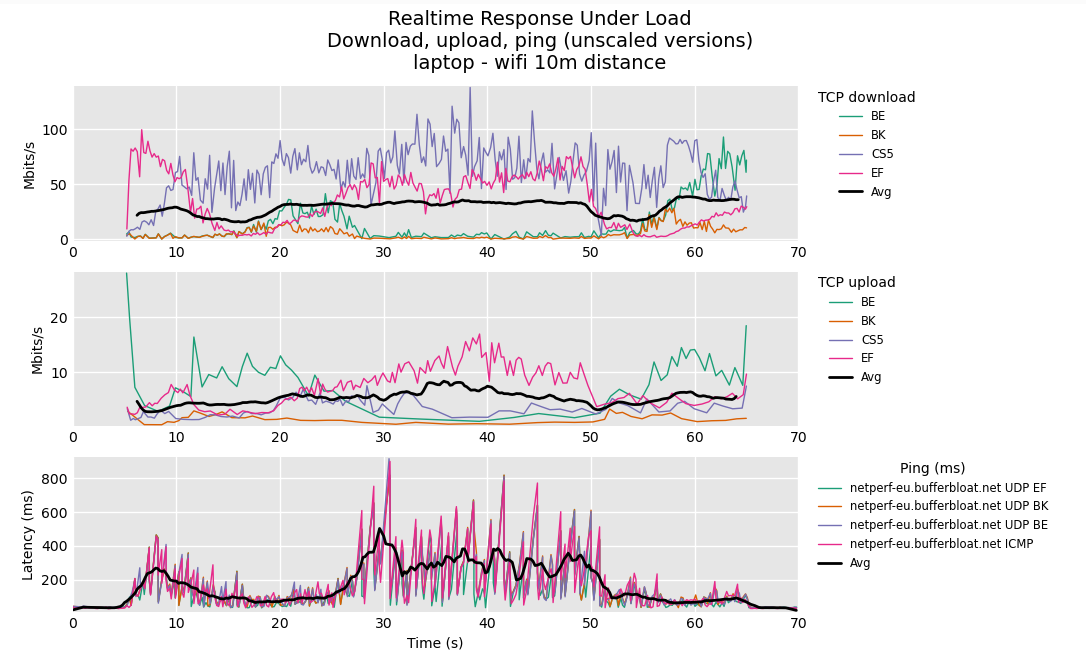
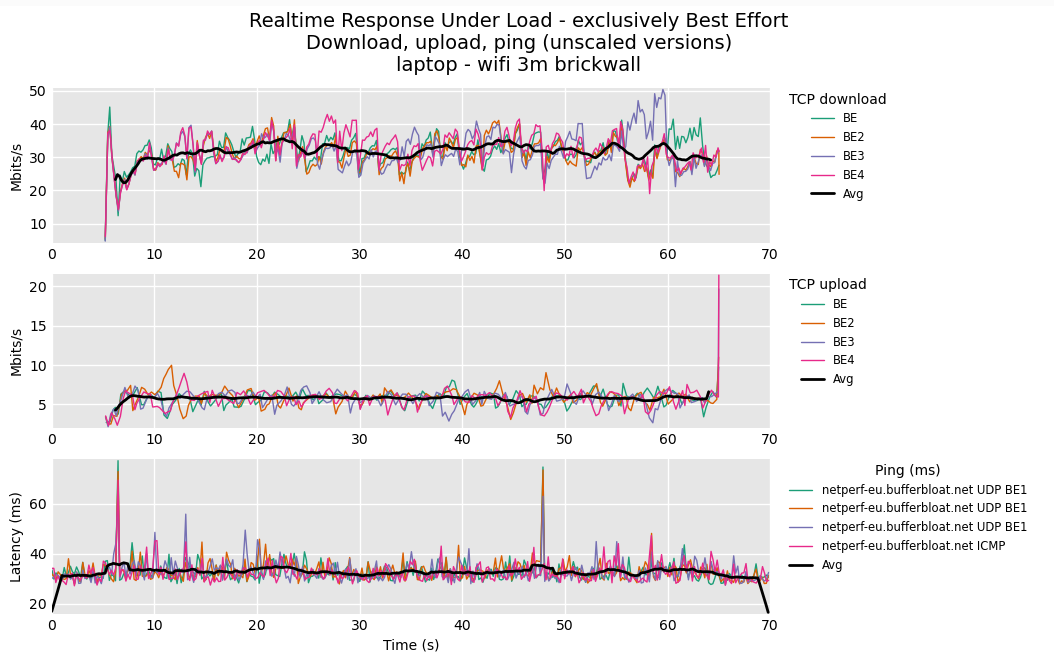
I recently switched from rrul over to rrul_var, so I can easily change the number of flows as well as the DSCPs per flow:

echo "IPv4" ; date ; ping -c 10 netperf-eu.bufferbloat.net ; ./run-flent --ipv4 -l 60 -H netperf-eu.bufferbloat.net rrul_var --remote-metadata=root@192.168.42.1 --test-parameter=cpu_stats_hosts=root@192.168.42.1 --socket-stats --step-size=.05 --test-parameter bidir_streams=8 --test-parameter markings=CS0,CS1,CS2,CS3,CS4,CS5,CS6,CS7 --test-parameter ping_hosts=1.1.1.1 -D . -t IPv4_DUT_2_netperf-eu.bufferbloat.net --log-file

ping -c 10 netperf-eu.bufferbloat.net:
This just collects unloaded RTT data to give an idea what to expect

-l 60:
Run for a minute, IMHO running tests longer than the typical 10-20 seconds can be quite revealing, but when using infrastructure payed for by others I think it courteous not to go over board here.

--test-parameter=cpu_stats_hosts=root@192.168.42.1:
This will get CPU usage information from the router, useful to diagnose CPU overload, although it currently only reports total CPU usage, which for multicore routers is less useful.

--step-size=.05:
If the rate is high enough this allows nicer plots.

--socket-stats:
Will only work if flent is run under Linux, but will record relevant per flow/connection information like the sRTT for TCP flows, can be quite interesting (as it gives an idea about intra-flow or self-congestion)

--test-parameter bidir_streams=8:
What is says, the number of flows per direction

--test-parameter markings=CS0,CS1,CS2,CS3,CS4,CS5,CS6,CS7:
Set the DSCP marking for each flow, either use the few known symbolic names, or use numbers (decimal TOS numbers, if you work from decimal DSCP numbers, just multiply by 4 to make up for the 2 bit difference in length)
markings=0,32,64,96,128,160,192,224 should be equivalent to markings=CS0,CS1,CS2,CS3,CS4,CS5,CS6,CS7

--test-parameter ping_hosts=1.1.1.1:
Also ping this specific host... can be useful for reference

--remote-metadata=root@192.168.42.1:
192.168.42.1 is my router running sqm, this will collect the tc -s qdisc output from before ans after the test, replace with the IP of your own router

--log-file:
Also create a log file for a flent run, can be useful for debugging.

4 Likes

Awesome that you share this @moeller0.

I'm taking a brake from qos for now and settle with what my APU2 can do. Did a quick test with Wifi. It's 5GHz@40MHz. RSSI -55dBm.

This is my result.
2023-10-01-speedtest

And data from speedtest:

Idle Latency:     4.64 ms   (jitter: 0.21ms, low: 4.54ms, high: 4.94ms)
    Download:   141.24 Mbps (data used: 63.8 MB)
                  5.46 ms   (jitter: 0.94ms, low: 3.43ms, high: 8.44ms)
      Upload:   143.33 Mbps (data used: 70.0 MB)
                  4.90 ms   (jitter: 0.56ms, low: 4.05ms, high: 7.22ms)
 Packet Loss:     0.0%
2 Likes

I ran a Flent rrul test on my laptop (wifi 5Ghz connected) but my graphs do not look that pretty (especially compared to Spacebar) - any idea what I should improve here?

ISP & hardware & software

  • ISP: Docsis 3.1 max down: 214mbit, max up: 32mbit
  • modem: Arris TG3492LG-ZG
  • router: Raspberry Pi CM4 + DFRobot Routerboard (OpenWrt 23.05-rc4)
  • accesspoint: TP-Link EAP615 (OpenWrt 23.05-rc4)
cat /etc/config/qosify
config defaults
	list defaults /etc/qosify/*.conf
	option dscp_prio video
	option dscp_icmp +besteffort
	option dscp_default_udp besteffort
	option prio_max_avg_pkt_len 500

config class besteffort
	option ingress CS0
	option egress CS0

config class bulk
	option ingress LE
	option egress LE

config class video
	option ingress AF41
	option egress AF41

config class voice
	option ingress CS6
	option egress CS6
	option bulk_trigger_pps 100
	option bulk_trigger_timeout 5
	option dscp_bulk CS0

config interface wan
	option name wan
	option disabled 0
	option bandwidth_up 29mbit
	option bandwidth_down 192mbit
	option overhead_type docsis
	# defaults:
	option ingress 1
	option egress 1
	option mode diffserv4
	option nat 1
	option host_isolate 1
	option autorate_ingress 0
	option ingress_options ""
	option egress_options ""
	option options "overhead 22"
cat /etc/qosify/00-defaults.conf
# DNS
tcp:53		voice
tcp:5353	voice
udp:53		voice
udp:5353	voice

# NTP
udp:123		voice

# SSH
tcp:22		+video

# HTTP/QUIC
tcp:80		+besteffort
tcp:443		+besteffort
udp:80		+besteffort
udp:443		+besteffort
qosify-status after flent test
===== interface wan: active =====
egress status:
qdisc cake 800b: root refcnt 2 bandwidth 29Mbit diffserv4 dual-srchost nat nowash no-ack-filter split-gso rtt 100ms noatm overhead 22 mpu 64 
 Sent 166399099 bytes 380640 pkt (dropped 107, overlimits 607761 requeues 0) 
 backlog 0b 0p requeues 0
 memory used: 550080b of 4Mb
 capacity estimate: 29Mbit
 min/max network layer size:           28 /    1500
 min/max overhead-adjusted size:       64 /    1522
 average network hdr offset:           14

                   Bulk  Best Effort        Video        Voice
  thresh       1812Kbit       29Mbit    14500Kbit     7250Kbit
  target           10ms          5ms          5ms          5ms
  interval        105ms        100ms        100ms        100ms
  pk_delay       4.65ms        133us          0us       14.5ms
  av_delay       1.88ms         29us          0us        7.4ms
  sp_delay        140us          3us          0us          8us
  backlog            0b           0b           0b           0b
  pkts            18182       208027            0       154538
  bytes        11461660     51996427            0    103098149
  way_inds            0          260            0            0
  way_miss            2          751            0          174
  way_cols            0            0            0            0
  drops              33           10            0           64
  marks               0            0            0            0
  ack_drop            0            0            0            0
  sp_flows            1            1            0            1
  bk_flows            0            1            0            0
  un_flows            0            0            0            0
  max_len         10598        15140            0        24224
  quantum           300          885          442          300


ingress status:
qdisc cake 800c: root refcnt 2 bandwidth 192Mbit diffserv4 dual-dsthost nat nowash ingress no-ack-filter split-gso rtt 100ms noatm overhead 22 mpu 64 
 Sent 1452959475 bytes 1046478 pkt (dropped 33, overlimits 1503323 requeues 0) 
 backlog 0b 0p requeues 0
 memory used: 1064512b of 9375Kb
 capacity estimate: 192Mbit
 min/max network layer size:           46 /    1500
 min/max overhead-adjusted size:       68 /    1522
 average network hdr offset:           14

                   Bulk  Best Effort        Video        Voice
  thresh         12Mbit      192Mbit       96Mbit       48Mbit
  target            5ms          5ms          5ms          5ms
  interval        100ms        100ms        100ms        100ms
  pk_delay        644us       1.15ms          2us         18us
  av_delay        157us        550us          0us          3us
  sp_delay          3us         16us          0us          1us
  backlog            0b           0b           0b           0b
  pkts            44252       545238            1       457020
  bytes        61700804    750004930           65    641301848
  way_inds            0           72            0            0
  way_miss            2          802            1           18
  way_cols            0            0            0            0
  drops               6            8            0           19
  marks               0            0            0            0
  ack_drop            0            0            0            0
  sp_flows            1            1            0            0
  bk_flows            0            1            0            0
  un_flows            0            0            0            0
  max_len          6056        46934           65        22710
  quantum           366         1514         1514         1464

The cake stats show no meaningful number of drops from the test and no increased xx_delay values, so in all likelihood what you see there is not your internet access link, but issues with WiFi...

we have never looked at fq_codeling the rpi wifi driver. I am not even sure it can be fixed. You might get a better result from the rrul_be test?

Then...
If you move even further away from the ap here on that test, what happens?

I had thought that the pi is only used as wired router here and that WiFi is handled by the AP, but I might have gotten that wrong?

Indeed, the RPi is wired only.

A test on my laptop with ethernet (100mbit) connection shows following

and another test with wifi at 10m distance from accesspoint shows following

I will do some more tests this week for comparison on a wired desktop pc (instead of the laptop) and also using sqm (instead of qosify)

Yes, this does indeed look better (I think)

For comparison I wanted to switch to sqm so I stopped/removed qosify service and tried to start sqm but then got this failure - is there anything needed to cleanup old settings?

SQM: Starting SQM script: layer_cake.qos on eth1, in: 192000 Kbps, out: 29000 Kbps
SQM: ERROR: cmd_wrapper: tc: FAILURE (2): /sbin/tc qdisc add dev eth1 handle ffff: ingress
SQM: ERROR: cmd_wrapper: tc: LAST ERROR: Error: Exclusivity flag on, cannot modify.
SQM: ERROR: cmd_wrapper: tc: FAILURE (2): /sbin/tc filter add dev eth1 parent ffff: protocol all prio 10 u32 match u32 0 0 flowid 1:1 action mirred egress redirect dev ifb4eth1
SQM: ERROR: cmd_wrapper: tc: LAST ERROR: RTNETLINK answers: Invalid argument
We have an error talking to the kernel
SQM: WARNING: sqm_start_default: layer_cake.qos lacks an ingress() function
SQM: layer_cake.qos was started on eth1 successfully
Output from tc qdisc ls
qdisc noqueue 0: dev lo root refcnt 2 
qdisc mq 0: dev eth0 root 
qdisc fq_codel 0: dev eth0 parent :5 limit 10240p flows 1024 quantum 1514 target 5ms interval 100ms memory_limit 4Mb ecn drop_batch 64 
qdisc fq_codel 0: dev eth0 parent :4 limit 10240p flows 1024 quantum 1514 target 5ms interval 100ms memory_limit 4Mb ecn drop_batch 64 
qdisc fq_codel 0: dev eth0 parent :3 limit 10240p flows 1024 quantum 1514 target 5ms interval 100ms memory_limit 4Mb ecn drop_batch 64 
qdisc fq_codel 0: dev eth0 parent :2 limit 10240p flows 1024 quantum 1514 target 5ms interval 100ms memory_limit 4Mb ecn drop_batch 64 
qdisc fq_codel 0: dev eth0 parent :1 limit 10240p flows 1024 quantum 1514 target 5ms interval 100ms memory_limit 4Mb ecn drop_batch 64 
qdisc cake 801b: dev eth1 root refcnt 2 bandwidth 29Mbit diffserv3 triple-isolate nonat nowash no-ack-filter split-gso rtt 100ms noatm overhead 22 
qdisc clsact ffff: dev eth1 parent ffff:fff1 
qdisc noqueue 0: dev br-lan root refcnt 2 
qdisc fq_codel 0: dev ifb-dns root refcnt 2 limit 10240p flows 1024 quantum 1514 target 5ms interval 100ms memory_limit 4Mb ecn drop_batch 64 
qdisc cake 801c: dev ifb4eth1 root refcnt 2 bandwidth 192Mbit besteffort triple-isolate nonat wash no-ack-filter split-gso rtt 100ms noatm overhead 22