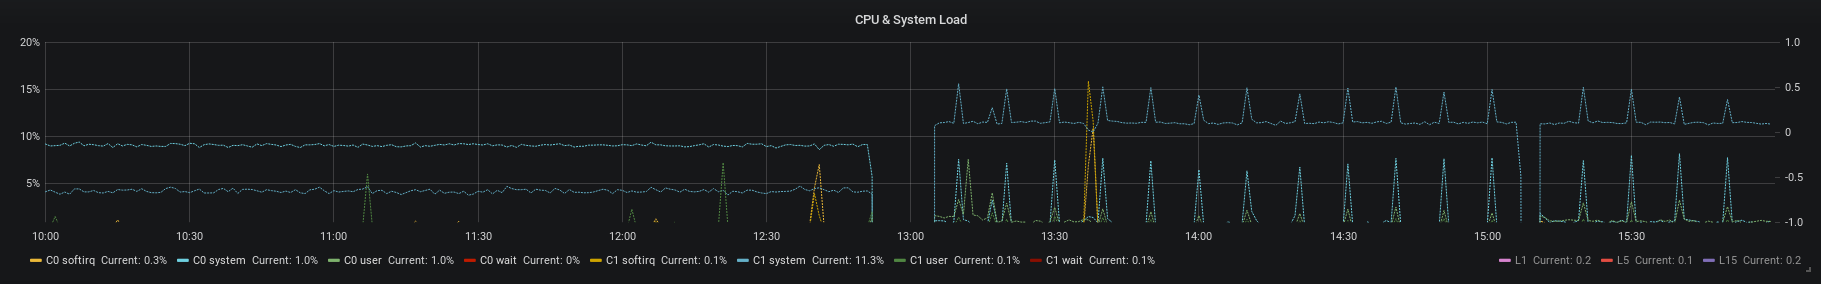
I noticed spikes in processor usage after upgrading my C2600 from 18.06.0 to 18.06.1 every 10 minutes. Here is a screenshot from my Grafana (Collectd) but you can also see it in Statistics → Graphs → Processor for the last hour.
Did anyone else notice this? Any advice how to investigate further? I checked logread but couldn't find anything suspicious.
I had hope there was a better or more automated way to do this, in the end looking a bit on StackExchange I used this:
while sleep 1; do date >> top.txt; top -b -n1 | head >> top.txt; done
I checked the log and mostly found kworker processes:
Sat Aug 18 00:28:22 CEST 2018
Mem: 143260K used, 336156K free, 6184K shrd, 19092K buff, 32624K cached
CPU:   0% usr  28% sys   0% nic  71% idle   0% io   0% irq   0% sirq
Load average: 0.10 0.21 0.19 2/108 13324
  PID  PPID USER     STAT   VSZ %VSZ %CPU COMMAND
   15     2 root     IW       0   0%  22% [kworker/1:0]
13323 26405 root     R     1116   0%   3% top -b -n1
    8     2 root     IW       0   0%   3% [rcu_sched]

Sat Aug 18 00:24:00 CEST 2018
Mem: 142936K used, 336480K free, 6184K shrd, 19020K buff, 32448K cached
CPU:   4% usr  31% sys   0% nic  63% idle   0% io   0% irq   0% sirq
Load average: 0.44 0.31 0.21 2/109 10116
  PID  PPID USER     STAT   VSZ %VSZ %CPU COMMAND
   15     2 root     IW       0   0%  32% [kworker/1:0]
 3787     1 tor      S    23544   5%   0% /usr/sbin/tor --runasdaemon 0

Sat Aug 18 00:24:39 CEST 2018
Mem: 142440K used, 336976K free, 6184K shrd, 19036K buff, 32476K cached
CPU:   0% usr  26% sys   0% nic  73% idle   0% io   0% irq   0% sirq
Load average: 0.46 0.34 0.22 1/109 12226
  PID  PPID USER     STAT   VSZ %VSZ %CPU COMMAND
   15     2 root     IW       0   0%  22% [kworker/1:0]
12222 26405 root     R     1116   0%   4% top -b -n1
 3787     1 tor      S    23544   5%   0% /usr/sbin/tor --runasdaemon 0


Sat Aug 18 00:34:35 CEST 2018
Mem: 147500K used, 331916K free, 6184K shrd, 19188K buff, 32852K cached
CPU:   0% usr  31% sys   0% nic  68% idle   0% io   0% irq   0% sirq
Load average: 0.46 0.26 0.20 2/112 17091
  PID  PPID USER     STAT   VSZ %VSZ %CPU COMMAND
   15     2 root     RW       0   0%  23% [kworker/1:0]
17090 26405 root     R     1116   0%   5% top -b -n1
 3787     1 tor      S    23544   5%   0% /usr/sbin/tor --runasdaemon 0


Sat Aug 18 00:34:45 CEST 2018
Mem: 147420K used, 331996K free, 6184K shrd, 19200K buff, 32856K cached
CPU:   0% usr  39% sys   0% nic  60% idle   0% io   0% irq   0% sirq
Load average: 0.39 0.25 0.20 3/112 17142
  PID  PPID USER     STAT   VSZ %VSZ %CPU COMMAND
   15     2 root     RW       0   0%  26% [kworker/1:0]
17141 26405 root     R     1116   0%   9% top -b -n1
 3787     1 tor      S    23544   5%   0% /usr/sbin/tor --runasdaemon 0
I checked scheduled tasks and found nothing. It can't be a cron job as it has drifted from 0:00 to 4:30 every 10 minutes now.
The environment did not change, it only happens after the upgrade. I tried rebooting but that had no effect, I could try downgrading to the older version.
I left the room and shut down almost all hosts except the collectd & grafana server machine and the spikes are still there. I checked which clients are on the network at the moment. Also from my knowledge of watching this graph when clients are very busy on the network it is usually softirq that goes up, not system.
Stop collected and turn off grafana machine.
And try testing again.
Collectd transmits results in ten second bursts but maybe it is doing some house keeping every ten minutes