when you say you've got 1.0 load, can you show the output of top -d 1 during that period?
Sure, waiting it to happen 
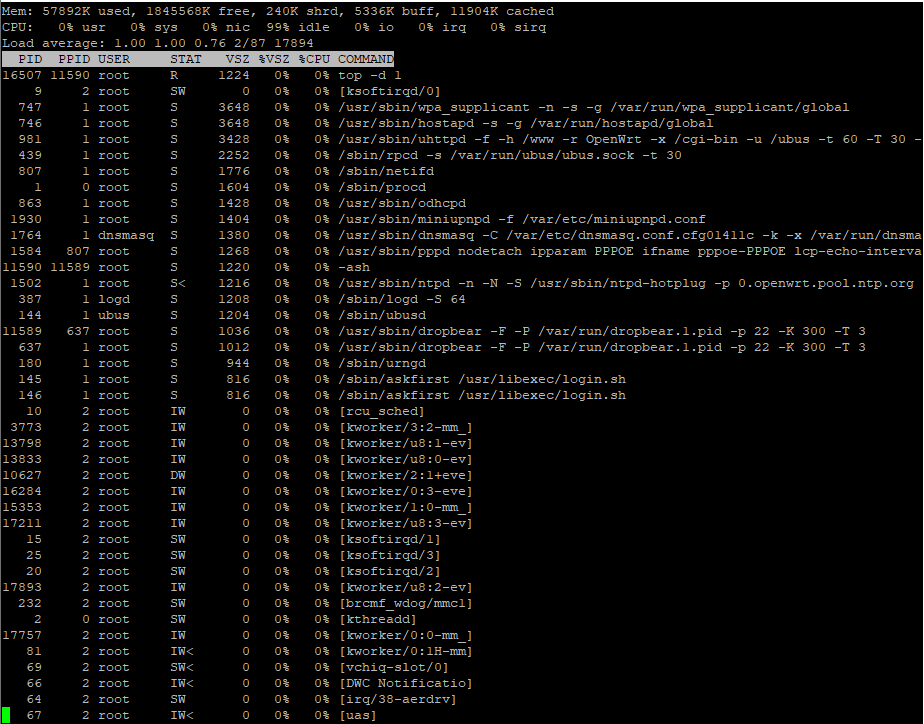
how about show output "before" so we have a comparison
Another interesting observation:
When doing a speedtest on fast.com I have ksoftirqd/0 and sirq at around 5-7% on download and
18-25 % on upload
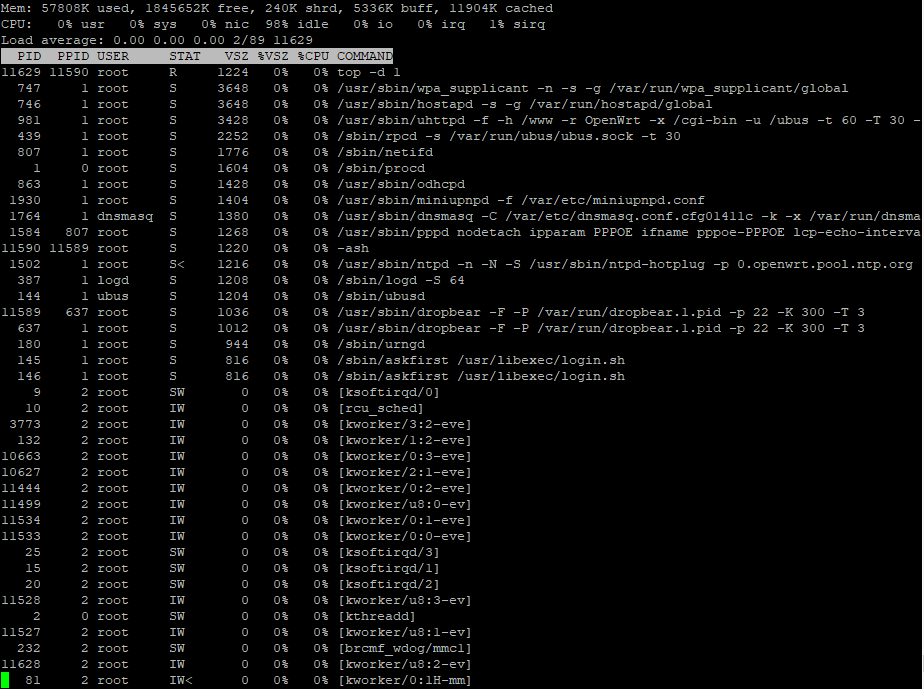
after
CPU load counter stays at 1.00 untill the rest (5min, 15 min) catch up.
Performance drops after few hours (400-500mbps), after restart everything's back to normal (800-900mbps)
your CPU is still 99% idle, this does not indicate excessive cpu usage.
1 Like
Yes, I relied on the gui indicator.
Altho performance drops significantly after few hours.
wait until performance is actually dropping, and then do the top -d 1 at that time. Ignore the "load avg" which is more or less meaningless.
I took those screenshots at the time when performance dropped.
Somehow that 1.0 load coincides in time when actually im getting poor performance.
99% idle cpu indicates performance drop is not due to excessive CPU usage.
How were you measuring "performance drop"?
Nothing "fancy" just a speedtest
which speedtest? what were the results?
The "load average 1.0" basically indicates "you've been running top for a long time" so that's not it.
That 1.0 load stays there even after tens of minutes of inactivity. (99% idle)
Haven't used anything which would bump it up to 1.0
top, it's just top
99% idle is actually the meaningful statistics, and it indicates your cpu is not doing anything.
@fosix Hi back, for now (uptime 7h 37m) I'm not encountering the issue you have.
When performance drops, before you restart, can you type dmesg to check the kernel log? If you have an issue that reduces your bandwidth, but no "top" usage, for example if it's about the USB3 link going USB2 (which would limit the bandwidth to around 300~400 Mbps), there is some chances a message appears into the kernel log, about something gone wrong.
For "ksoftirqd/0", having too high usage (and bandwidth limitation because of it) means you may try to enable the things I finally found about performance dropping above 2GB RAM, and about "SMP Packet Steering" that can be enabled into "Global network options" tab, as this thing (or an equivalent) was automatically enabled on old OpenWrt version, and is no longer automatically enabled on modern OpenWrt snapshots (when disabled ksoftirqd/0 usage is really high). See my summary post (I tagged it as "solution" to be easier to found).
I have the 2GB model so that's not the issue. I enabled packet steering, let's see how it goes.
After 20hours uptime still no problem
I tried disconnecting USB3 NIC to place it on USB2 port, just to see what happen:
Into dmesg:
[72628.125913] usb 2-2: USB disconnect, device number 2
[72628.131439] xhci_hcd 0000:01:00.0: WARN Set TR Deq Ptr cmd failed due to incorrect slot or ep state.
[72631.445862] usb 1-1.4: new high-speed USB device number 3 using xhci_hcd
[72631.550834] usb 1-1.4: New USB device found, idVendor=2357, idProduct=0601, bcdDevice=30.00
[72631.559217] usb 1-1.4: New USB device strings: Mfr=1, Product=2, SerialNumber=6
[72631.566546] usb 1-1.4: Product: USB 10/100/1000 LAN
[72631.571438] usb 1-1.4: Manufacturer: TP-LINK
[72631.575720] usb 1-1.4: SerialNumber: 000001000000
[72631.662203] usb 1-1.4: reset high-speed USB device number 3 using xhci_hcd
[72631.802872] r8152 1-1.4:1.0 eth1: v1.10.11
[72634.568719] IPv6: ADDRCONF(NETDEV_CHANGE): eth1: link becomes ready
[72634.575471] r8152 1-1.4:1.0 eth1: carrier on
Then the maximum download rate is 320 Mbps and max upload rate is 280 Mbps, which is way below the rate you described (400~500 Mbps). So the issue you're encountering probably isn't USB3 link becoming USB2
I believe I found your issue, as I encountered the same
Into dmesg, I have the following message that appeared after few hours:
[11310.260222] raspberrypi-firmware soc:firmware: mbox_send_message returned -62
[11310.267387] raspberrypi-clk firmware-clocks: Failed to change pllb frequency: -62
I didn't encountered the issue on the rev 1.4 board. I'm now using 5.4.96 kernel on the rev 1.1 board.
I cannot access the cpu frequency anymore, as the command
cat /sys/devices/system/cpu/cpu0/cpufreq/cpuinfo_cur_freq
Is hanging (and cannot be killed). At Full duplex, I cannot receive more than 600 Mbps while sending 400 Mbps (I was able to do much much more yesterday) : I believe the CPU frequency is stuck because of that.
However with packet steering enabled, I'm still able to reach ~1000 Mbps at 1 single way at a time.
Its clearly another issue (at this level this is probably related to hardware/kernel/firmware), so may be creating a new thread will be more convenient.
EDIT : this thread seems to be talking about the issue
Odd I noticed those exact error messages in my kernel logs too today! Wasn’t sure what it was about.
1 Like
This topic was automatically closed 10 days after the last reply. New replies are no longer allowed.