please help me setup my SQM, am currently using what ever i have read on the forum and looking forward to improve it further, it would be nice to hear from those who use similar product and ISP, i have comcast and it usually get 170 Down and about 6 Up speed, i also need to test the bufferbloat in the best way possible. thanks
In case you are still interested in my help, I would like to sort of start fresh with first look at your current configuration and how it performs and then move on to try to improve the remaining issues. And again I can not guarantee success.
Since you now have a smewhat functional sqm configuration could you post:
-
reboot your router (you might need to also reboot the docsis modem)
-
cat /etc/config/sqm
-
tc -d qdisc
-
tc -s qdisc
-
run a speedtest (preferably the dslreports speedtest od flent's rrul/rrul_cs8)
-
from a different machine than the one running the test, log into the router and monitor the output of "top -d 1", specifically the value of the idle%
-
tc -s qdisc
This should give us a baseline on your links current performance in "synthetic" tests
If this seems to work well the next step is testing your problematic use-case, gaming with con-current traffic again...
Best Regards
in monitoring top, hit '1' after starting it so that you see the idle percentage
for each core (assuming you have a multi-core router), if any of the cores get
very low idle percentages, you can be running into cpu limitations.
1 Like
root@LEDE:~# cat /etc/config/sqm

config queue 'eth1'
        option linklayer 'none'
        option enabled '1'
        option interface 'eth0.2'
        option debug_logging '0'
        option verbosity '5'
        option qdisc 'cake'
        option script 'piece_of_cake.qos'
        option upload '5000'
        option download '100000'
        option qdisc_advanced '1'
        option squash_dscp '1'
        option squash_ingress '1'
        option ingress_ecn 'ECN'
        option egress_ecn 'NOECN'
        option qdisc_really_really_advanced '1'
        option iqdisc_opts 'nat dual-dsthost'
        option eqdisc_opts 'nat dual-srchost'

root@LEDE:~# tc -d qdisc
qdisc noqueue 0: dev lo root refcnt 2
qdisc fq_codel 0: dev eth0 root refcnt 2 limit 10240p flows 1024 quantum 1514 ta                                                                                                                                                             rget 5.0ms interval 100.0ms ecn
qdisc fq_codel 0: dev wlan0 root refcnt 2 limit 10240p flows 1024 quantum 1514 t                                                                                                                                                             arget 5.0ms interval 100.0ms ecn
qdisc fq_codel 0: dev wlan1 root refcnt 2 limit 10240p flows 1024 quantum 1514 t                                                                                                                                                             arget 5.0ms interval 100.0ms ecn
qdisc fq_codel 0: dev wlan2 root refcnt 2 limit 10240p flows 1024 quantum 1514 t                                                                                                                                                             arget 5.0ms interval 100.0ms ecn
qdisc noqueue 0: dev br-lan root refcnt 2
qdisc noqueue 0: dev eth0.1 root refcnt 2
qdisc cake 800d: dev eth0.2 root refcnt 2 bandwidth 5Mbit besteffort dual-srchos                                                                                                                                                             t nat rtt 100.0ms raw total_overhead 18 hard_header_len 18
qdisc ingress ffff: dev eth0.2 parent ffff:fff1 ----------------
qdisc cake 800e: dev ifb4eth0.2 root refcnt 2 bandwidth 100Mbit besteffort dual-                                                                                                                                                             dsthost nat wash rtt 100.0ms raw total_overhead 14 hard_header_len 14
root@LEDE:~# tc -s qdisc
qdisc noqueue 0: dev lo root refcnt 2
 Sent 0 bytes 0 pkt (dropped 0, overlimits 0 requeues 0)
 backlog 0b 0p requeues 0
qdisc fq_codel 0: dev eth0 root refcnt 2 limit 10240p flows 1024 quantum 1514 ta                                                                                                                                                             rget 5.0ms interval 100.0ms ecn
 Sent 11064382 bytes 38887 pkt (dropped 0, overlimits 0 requeues 2)
 backlog 0b 0p requeues 2
  maxpacket 1514 drop_overlimit 0 new_flow_count 168 ecn_mark 0
  new_flows_len 0 old_flows_len 0
qdisc fq_codel 0: dev wlan0 root refcnt 2 limit 10240p flows 1024 quantum 1514 t                                                                                                                                                             arget 5.0ms interval 100.0ms ecn
 Sent 1137206 bytes 3437 pkt (dropped 0, overlimits 0 requeues 0)
 backlog 0b 0p requeues 0
  maxpacket 538 drop_overlimit 0 new_flow_count 9 ecn_mark 0
  new_flows_len 1 old_flows_len 0
qdisc fq_codel 0: dev wlan1 root refcnt 2 limit 10240p flows 1024 quantum 1514 t                                                                                                                                                             arget 5.0ms interval 100.0ms ecn
 Sent 277153222 bytes 193987 pkt (dropped 0, overlimits 0 requeues 0)
 backlog 0b 0p requeues 0
  maxpacket 2893 drop_overlimit 0 new_flow_count 439 ecn_mark 0
  new_flows_len 1 old_flows_len 4
qdisc fq_codel 0: dev wlan2 root refcnt 2 limit 10240p flows 1024 quantum 1514 t                                                                                                                                                             arget 5.0ms interval 100.0ms ecn
 Sent 880697 bytes 2965 pkt (dropped 0, overlimits 0 requeues 0)
 backlog 0b 0p requeues 0
  maxpacket 226 drop_overlimit 0 new_flow_count 14 ecn_mark 0
  new_flows_len 1 old_flows_len 0
qdisc noqueue 0: dev br-lan root refcnt 2
 Sent 0 bytes 0 pkt (dropped 0, overlimits 0 requeues 0)
 backlog 0b 0p requeues 0
qdisc noqueue 0: dev eth0.1 root refcnt 2
 Sent 0 bytes 0 pkt (dropped 0, overlimits 0 requeues 0)
 backlog 0b 0p requeues 0
qdisc cake 800d: dev eth0.2 root refcnt 2 bandwidth 5Mbit besteffort dual-srchos                                                                                                                                                             t nat rtt 100.0ms raw total_overhead 18 hard_header_len 18
 Sent 3151210 bytes 26367 pkt (dropped 17, overlimits 7528 requeues 0)
 backlog 0b 0p requeues 0
 memory used: 192192b of 4Mb
 capacity estimate: 5Mbit
                  Tin 0
  thresh          5Mbit
  target          5.0ms
  interval      100.0ms
  pk_delay        4.8ms
  av_delay        343us
  sp_delay          2us
  pkts            26384
  bytes         3170916
  way_inds          605
  way_miss          609
  way_cols            0
  drops              17
  marks               0
  sp_flows            0
  bk_flows            1
  un_flows            0
  max_len          1636

qdisc ingress ffff: dev eth0.2 parent ffff:fff1 ----------------
 Sent 270674373 bytes 188965 pkt (dropped 0, overlimits 0 requeues 0)
 backlog 0b 0p requeues 0
qdisc cake 800e: dev ifb4eth0.2 root refcnt 2 bandwidth 100Mbit besteffort dual-                                                                                                                                                             dsthost nat wash rtt 100.0ms raw total_overhead 14 hard_header_len 14
 Sent 273763746 bytes 188928 pkt (dropped 37, overlimits 131233 requeues 0)
 backlog 0b 0p requeues 0
 memory used: 408272b of 5000000b
 capacity estimate: 100Mbit
                  Tin 0
  thresh        100Mbit
  target          5.0ms
  interval      100.0ms
  pk_delay        5.9ms
  av_delay        977us
  sp_delay         82us
  pkts           188965
  bytes       273816435
  way_inds            0
  way_miss          667
  way_cols            0
  drops              37
  marks               0
  sp_flows            0
  bk_flows            1
  un_flows            0
  max_len         33482
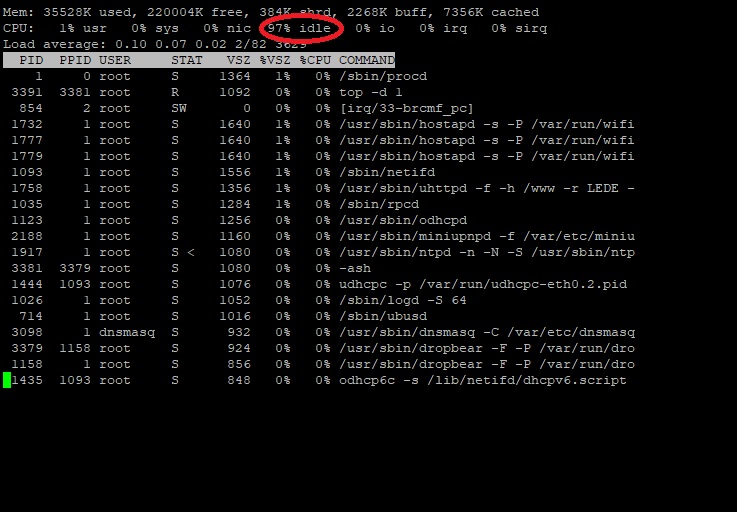
that red circle never reached lower than 47%, that was the lowest even when 2 tests were running at the same time.
test results on PC with Ethernet hooked directly to the Router
This looks reasonable, except for the missing overhead accounting, you might want to add the following:
option linklayer 'ethernet'
option overhead '34'
option linklayer_advanced '1'
option tcMTU '2047'
option tcTSIZE '128'
option tcMPU '64'
option linklayer_adaptation_mechanism 'cake'
option iqdisc_opts 'nat dual-dsthost ingress mpu 64'
option eqdisc_opts 'nat dual-srchost mpu 64'
Note the added "mpu 64" for iqdisc_opts and eqdisc_opts, to account for the fact that DOCSIS will enforce the minimum ethernet frame size of 64 bytes, by virtue of transmitting the ethernet frame check sequence (FCS).
The tc output looks nominal, but I note these are only from before running the speedtest, correct?
Okay, that indicates that your router does not seem to be overwhelmed by the shaping duty and should still have cycles left to spare for wifi. But I note from https://wikidevi.com/wiki/Netgear_R8000 that your router has two CPUs, so did you follow @dlang's instructions to make top display the usage for each CPU separately? From the screen shot it certainly does not look this way, but my gut feeling is that busybox's top might not actually support that. This seems relevant though, as with a dual core router 50% idle might well mean one core is fully maxed out and assuming a critical process like sqm is running on that =maxed out core you might already be CPU limited even tough on cursory look it does not show up. Now if with a single test idle stays well above 50% you could rule that out...
The speedtest's bufferbloat plots indicate strongly that you still have too much undermanaged buffers in play on the ingress/downloading side, upload/egress seems fine.
Could you please repeat the speedtest with the shaper set to say 50000/5000? To aim is to see whether the latency spikes go away, and if they do we should try to figure out at what bandwidth they do re-appear.
Great, I also assume that no other machines were in active use during the test? (The endgoal is to make concurrent use work satisfactory, but in the spirit of going little step by little step it is nice to start with the easiest condition and work our way up from there).
with 32 streams
with 16 streams
with 50 Down and 5 Up
with 25 Down and 5 Up
with 50 Down and 2.5 Up
http://www.dslreports.com/speedtest/31836798
as of right now it looks like that, high spikes still exist. i did not quite understand when to press 1, do i suppose to press 1 on keyboard right after i hit enter on “top -d 1”? if that's the case, i already did that and did not notice anything different or new.
with above recomended setting and with this, test looks quite bad
nat dual-dsthost mpu 64
nat dual-srchost mpu 64
http://www.dslreports.com/speedtest/31837575
Also try
cat /proc/loadavg
and
cat /proc/cpuinfo
root@LEDE:~# cat /proc/loadavg
0.08 0.09 0.05 1/87 2672
root@LEDE:~# cat /proc/cpuinfo
processor : 0
model name : ARMv7 Processor rev 0 (v7l)
BogoMIPS : 1594.16
Features : half thumb fastmult edsp tls
CPU implementer : 0x41
CPU architecture: 7
CPU variant : 0x3
CPU part : 0xc09
CPU revision : 0
processor : 1
model name : ARMv7 Processor rev 0 (v7l)
BogoMIPS : 1594.16
Features : half thumb fastmult edsp tls
CPU implementer : 0x41
CPU architecture: 7
CPU variant : 0x3
CPU part : 0xc09
CPU revision : 0
Hardware : BCM5301X
Revision : 0000
Serial : 0000000000000000
root@LEDE:~#
Cool, so you know you have two corse (processor: 0 and 1 )
You also have base loadavg , now run your speedtest for long period (upto 15 minutes, at least 1 minute) then check loadavg again a couple of times during and at end of test period.
i think highest i could run is about 60 sec and then repeat the test again. anyways this is the results with 40 Down and 4.5 Up, i also downgraded my internet, as there was no point paying for extra download speed anyways, so my real speed is 60 Down and 5 up now.
for now this test showed one huge spike and rest stayed stable or decent, but still not acceptable.
Did you check the loadavg immediately at the end of each speedtest phase?
60+ secs is fine, just note the duration of the test.
root@LEDE:~# cat /proc/loadavg
0.00 0.00 0.00 1/80 3436
root@LEDE:~# cat /proc/loadavg
0.00 0.00 0.00 1/80 3437
root@LEDE:~# cat /proc/loadavg
0.00 0.00 0.00 1/80 3438
root@LEDE:~# cat /proc/loadavg
0.00 0.00 0.00 1/80 3439
root@LEDE:~# cat /proc/loadavg
0.00 0.00 0.00 1/80 3440
root@LEDE:~# cat /proc/loadavg
0.00 0.00 0.00 1/80 3441
root@LEDE:~# cat /proc/loadavg
0.00 0.00 0.00 1/80 3442
root@LEDE:~# cat /proc/loadavg
0.00 0.00 0.00 1/80 3443
i did that while test was running and at the end of the test as well
54 Down and 4.5 Up
probably the best test so far
but it only lasted for the first test and now started to fail again
Doesn't look like CPU load is an issue.
Well, most of these tests look mostly okay (that is the 50/5 looks the best bufferbloat wise). Sure not all spikes are gone, but they are relatively rare now.
It seems that the busybox's top that openwrt normally uses does not support the display of usage values for each individual cpu (what full top gives you when you press "1" while it is running). You might want to use "opkg update ; opkg install htop" as htop seems to at least show a visual display of the current load for each CPU, as well as allowing shorter sampling periods (-d N: top interprets N as seconds, while htop interprets N as seconds/10). Could I convince you to give that a try?
Also it might be a good idea to temporarily disable both wlan radios before doing a wired test to see whether we can get an idea where the spikes might be coming from.
This is rather odd, as for this specific test the mpu64 should have no discernable effect whatsoever. But it might incur a slightly higher CPU cost which might indicate some local bottleneck.
Note that in the last idle phase there is also a nasty 100ms delay spike. Honestly this does not indicate a normal "sqm is overwhelming the CPU" issue this looks like some other odd things are going on.
i thought i share the update with new hardware, with WRT3200 i got the following:
even with the new hardware, things started going downhill quite fast, recently i went back to stock firmware and was never able to install the LEDE firmware that was previously installed, router wouldn't take the same lede firmware any longer, this also apply to other firmware as well, such as dd wrt or even the older stock version and it seems to only take the latest stock firmware and only accept that. winscp and putty force update firmware doesn't work as i tried several times and currently it accept the OpenWrt SNAPSHOT r6775-afdca53ace / LuCI Master (git-18.118.21533-00d2429) version only and reject all other lede