Indeed, I remember however I prefer to keep it at hand rather than to refresh my memory on the file system structure 
In order to include htt version while compiling firmware based on your scripts is it enough to switch to ath10k-firmware-qca9984-ct-htt in make menuconfig?
Question on CPU use please. Running top always shows this process at the top with 3-5% CPU use:
/usr/sbin/hostapd -s -n phy1 -g /var/run/hostapd-phy1/global
phy1 is the 2.4GHz radio which is interesting because not a lot should be going on there, just a few IoT devices that don't do much, I looked at the bandwidth monitor and there's barely any traffic from these.
phy0 is the 5GHz radio where laptops, tablets, heavy streamers are, but the corresponding hostapd process for phy0 barely registers in top.
Any ideas why phy1 hostapd is much busier than phy0?
3-5% seams to be a lot. Here are my stats from R7800 running both 2.4 and 5GHz radios with similar purpose per frequency:
R S CPU% MEM%   TIME+  Command
4 S  0.0  0.5  2:12.93 /usr/sbin/collectd -C /tmp/collectd.conf -f
4 S  0.0  0.5  0:46.27 /usr/sbin/collectd -C /tmp/collectd.conf -f
0 S  0.0  0.2  0:43.25 /usr/sbin/nlbwmon -o /var/lib/nlbwmon -i 24h -r 30s -p /u
4 S  0.0  0.5  0:37.67 /usr/sbin/collectd -C /tmp/collectd.conf -f
8 S  0.0  0.5  0:23.19 /usr/sbin/hostapd -d -s -n phy1 -g /var/run/hostapd-phy1/
4 S  0.0  0.5  0:18.38 /usr/sbin/hostapd -d -s -n phy0 -g /var/run/hostapd-phy0/
4 S  0.0  0.5  0:14.24 /usr/sbin/collectd -C /tmp/collectd.conf -f
4 S  0.0  0.5  0:13.63 /usr/sbin/collectd -C /tmp/collectd.conf -f
0 R  2.0  0.2  0:13.39 htop
2 S  0.0  0.2  0:09.79 /sbin/netifd
0 S  0.0  3.3  0:07.29 /usr/sbin/dnscrypt-proxy -config /etc/dnscrypt-proxy2/dns
4 S  0.0  0.2  0:03.91 /sbin/procd
6 S  0.0  1.5  0:03.87 /usr/sbin/nmbd -F
4 S  0.0  0.5  0:03.71 /usr/sbin/collectd -C /tmp/collectd.conf -f
4 S  0.0  0.5  0:03.53 /usr/sbin/collectd -C /tmp/collectd.conf -f
4 S  0.0  0.5  0:03.49 /usr/sbin/collectd -C /tmp/collectd.conf -f
Is there a way to trace the process see what it is busy doing?
I would start checking log optionally together with increase logging level of hostapd. See debugging part of that post: https://www.reddit.com/r/openwrt/comments/515oea/finally_got_80211r_roaming_working/
Any good news on hardware flow offload? I've been seeing these in recent kernel bumps...
target/linux/generic/pending-4.14/640-netfilter-nf_flow_table-add-hardware-offload-support.patch
target/linux/generic/pending-4.14/642-net-8021q-support-hardware-flow-table-offload.patch
I installed strace and ran a trace for hostapd for phy0 and phy1. They both look similar except the calls for phy1 happen at a much faster rate, something happens on phy1 much more frequently, but not sure what.
recvmsg(20, {msg_name={sa_family=AF_NETLINK, nl_pid=0, nl_groups=00000000}, msg_namelen=12, msg_iov=[{iov_base={{len=260, type=0x17 /* NLMSG_??? */, flags=0, seq=0, pid=0}, "\x3b\x01...
clock_gettime(CLOCK_BOOTTIME, {tv_sec=33075, tv_nsec=251671109}) = 0
clock_gettime(CLOCK_BOOTTIME, {tv_sec=33075, tv_nsec=252021349}) = 0
_newselect(23, [4 8 9 11 13 14 15 16 17 18 19 20 21 22], [], [], {tv_sec=3, tv_usec=297456}) = 1 (in [20], left {tv_sec=3, tv_usec=297418})
clock_gettime(CLOCK_BOOTTIME, {tv_sec=33075, tv_nsec=254632233}) = 0
recvmsg(20, {msg_name={sa_family=AF_NETLINK, nl_pid=0, nl_groups=00000000}, msg_namelen=12, msg_iov=[{iov_base={{len=276, type=0x17 /* NLMSG_??? */, flags=0, seq=0, pid=0}, "\x3b\x01...
What is really interesting is that I changed the SSID for phy1/2.4GHz so that no client can connect, verified there are no clients connected, and hostapd for phy1 is still busy. Something is not right.
This is the wireless config in case some setting may be causing it:
config wifi-device 'radio1'
        option type 'mac80211'
        option hwmode '11g'
        option path 'soc/1b700000.pci/pci0001:00/0001:00:00.0/0001:01:00.0'
        option htmode 'HT20'
        option channel '6'
        option country 'US'
        option legacy_rates '0'
        option noscan '1'

config wifi-iface 'default_radio1'
        option device 'radio1'
        option network 'lan'
        option mode 'ap'
        option ssid '...'
        option encryption 'psk2+ccmp'
        option key '...'
        option wps_pushbutton '0'
        option short_preamble '1'

config wifi-iface 'guest'
        option device 'radio1'
        option mode 'ap'
        option ssid '...'
        option encryption 'psk2+ccmp'
        option key '...'
        option wps_pushbutton '0'
        option isolate '1'
        option network 'guest'
        option short_preamble '1'
        option disabled '0'
I also tried it with both CT and old ath10k firmware, same behavior.
I tried disabling the Guest network - no difference. Only if I set both interfaces to disabled hostapd quiets down.
If nothing specific in the logs maybe you can try turning off all but one client and add them gradually? I suspect client incompatibility/issue.
Are you using maybe channel that is overcrowded?
Edit: have read your post again and it is complete mystery
Interestingly enough, my first impression of the HTT firmware is very good. It (unscientifically) feels to have made the wifi way faster and smoother. I have deployed the latest version now to test drive, but I wish I used htt all along.
There are 3-4 other APs that come and go on ch 6 plus others that seem to be well separated on ch 1 and 11. Even if it's overcrowded, wouldn't traffic that doesn't belong to my SSIDs be ignored somewhere at the hardware level? It shouldn't make it to hostapd, or should it?
You are right but still for the sake of test maybe you can switch temporarily to a different channel? Have you tried that already? Having no client connected but process still fairly busy - the only other thing that comes is hardware issue.
What is your version of hostapd?
I'll be damn! I just tried various channels, on the busiest ones the load goes even higher to 6-7%. On the ones that have no other APs, e.g. ch 8 (though there is interference on them from the neighboring channels) the load drops to about 0.7%. Does this make any sense? Why does hostapd, in user space, need to look at traffic that's not even intended for my SSIDs?
So the load does correlate with how busy a channel is, though that doesn't make any sense to me. Do you think this might be a bug?
hostapd v2.9 on hnyman build r12050-cf2f1fc687
Thanks @perceival, very good detective work!
1 Like
I have too little knowledge of data flows between processes and the way hostapd works.
Considering you are using it mostly for IoT I would go for ch 8.
1, 6, and 11 should be used to avoid interference. There should be no issue with hostapd consuming a little cpu.
1 Like
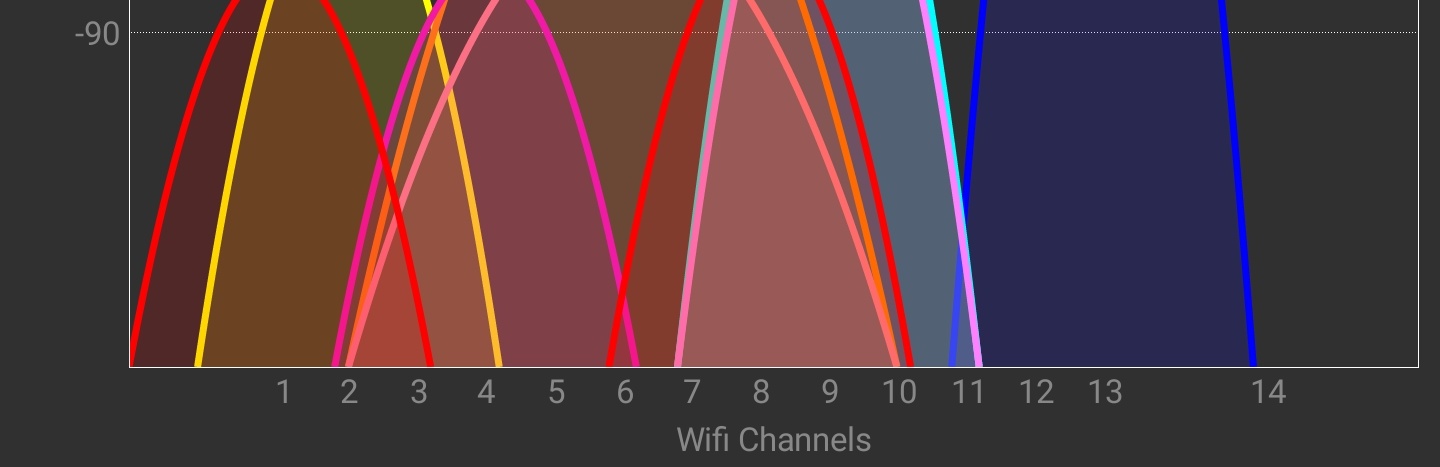
That would be the ideal setup (anyway for Europe better would be 1 5 9 13). But at least for my location the reality is 2.4GHz is a trash can. There is constant interference (see attached).
To determine that the packets are not intended for your SSIDs?
I assume the hardware can handle that before decrypting a packet, MAC addresses/BSSID are not encrypted, the hardware should know which clients are associated and just drop the rest of the traffic. Why pass everything to user space just to ignore it?
Some update for the 5.4 kernel port...
nand driver works good (the config simbol has changed)
I think the eth port not working is related to the change to the stmmac driver (that got converted to phylink and had lots of change). I notice that the driver doesn't attach to the mii bus. Still searching if this expected or not.
1 Like
Will never happen.
You should choose the least crowded channel because you cannot transmit when a node with a different SSID but still on the same channel is transmitting. This will only be fixed with Spatial Frequency Reuse in WiFi 6. This is why mesh / pod systems are popular. By being very bad at receiving wifi signals, the tiny pod does not notice any other networks on the same channel and is always free to transmit.