intdev
April 6, 2019, 10:10am
1538
There are no diffrences my R7800 device and other users. And testing environment is clean/reset state. So, there is no other factors to involve. (Also, I disconnected WAN connection. No diffs.)
Your screen: 87% idle, 6% kworker --> This is not normal. And same with me.
Can you try 'htop -d1'?
It's easy to test. Install: opkg update && opkg install htop
Then, Every 2sec. CPU 1 will touch 100%.
P.S.: 100% or 20% is NOT IMPORTANT. Important thing is something consumes processor power and this will make some slowdown. Furthermore, Only happens on OpenWRT.
I see what you mean yes. I guess one could try and find the issue with perf record command but I can't find it with opkg.
I ran it, here's the summary
Average:      UID       PID    %usr %system  %guest   %wait    %CPU   CPU  Command
Average:        0         5    0.00    0.01    0.00    0.00    0.01     -  kworker/u4:0
Average:        0         7    0.00    0.05    0.00    0.00    0.05     -  ksoftirqd/0
Average:        0         8    0.00    0.08    0.00    0.00    0.08     -  rcu_preempt
Average:        0       810    0.01    0.02    0.00    0.00    0.03     -  netifd
Average:        0       921    0.00    0.01    0.00    0.00    0.01     -  odhcpd
Average:        0      1498    0.01    0.09    0.00    0.00    0.10     -  hostapd
Average:        0      1715    0.02    0.02    0.00    0.00    0.04     -  nlbwmon
Average:        0      1775    0.03    0.03    0.00    0.00    0.07     -  collectd
Average:        0      1918    0.02    0.11    0.00    0.00    0.13     -  hostapd
Average:        0      2256    0.01    0.01    0.00    0.00    0.02     -  irqbalance
Average:      453      3021    0.14    0.00    0.00    0.00    0.14     -  dnsmasq
Average:        0      3530    0.00   13.68    0.00    0.00   13.68     -  kworker/0:0
Average:        0      3549    0.03    0.07    0.00    0.00    0.10     -  dropbear
Average:        0      3572    0.00    0.01    0.00    0.00    0.01     -  kworker/u4:2
Average:        0      3736    0.00    0.09    0.00    0.00    0.09     -  kworker/1:1
Average:        0      3831    0.15    0.42    0.00    0.00    0.58     -  pidstat
here's the sysreq output, i seem to get the same every time:
[ 8530.210232] Sending NMI from CPU 1 to CPUs 0:
[ 8530.210365] NMI backtrace for cpu 0
[ 8530.210368] CPU: 0 PID: 0 Comm: swapper/0 Not tainted 4.14.109 #0
[ 8530.210369] Hardware name: Generic DT based system
[ 8530.210371] task: c0b06cc0 task.stack: c0b00000
[ 8530.210372] PC is at arch_cpu_idle+0x38/0x44
[ 8530.210375] LR is at arch_cpu_idle+0x34/0x44
[ 8530.210376] pc : [<c0308930>]    lr : [<c030892c>]    psr: 60000013
[ 8530.210377] sp : c0b01f98  ip : c0b01f90  fp : 00000000
[ 8530.210379] r10: 00000000  r9 : c0a28a28  r8 : 00000000
[ 8530.210380] r7 : 00000000  r6 : c0b03c70  r5 : c0b03cbc  r4 : ffffe000
[ 8530.210382] r3 : c03152a0  r2 : 00000000  r1 : 00000000  r0 : 00000001
[ 8530.210383] Flags: nZCv  IRQs on  FIQs on  Mode SVC_32  ISA ARM  Segment none
[ 8530.210385] Control: 10c5787d  Table: 5b7c806a  DAC: 00000051
[ 8530.210386] CPU: 0 PID: 0 Comm: swapper/0 Not tainted 4.14.109 #0
[ 8530.210388] Hardware name: Generic DT based system
[ 8530.210389] [<c030f478>] (unwind_backtrace) from [<c030b644>] (show_stack+0x14/0x20)
[ 8530.210391] [<c030b644>] (show_stack) from [<c079e4b8>] (dump_stack+0x88/0x9c)
[ 8530.210394] [<c079e4b8>] (dump_stack) from [<c07a4644>] (nmi_cpu_backtrace+0xac/0xd8)
[ 8530.210395] [<c07a4644>] (nmi_cpu_backtrace) from [<c030e738>] (handle_IPI+0x154/0x194)
[ 8530.210397] [<c030e738>] (handle_IPI) from [<c03014b8>] (gic_handle_irq+0x9c/0xb8)
[ 8530.210398] [<c03014b8>] (gic_handle_irq) from [<c030c20c>] (__irq_svc+0x6c/0xa8)
[ 8530.210400] Exception stack(0xc0b01f48 to 0xc0b01f90)
[ 8530.210401] 1f40:                   00000001 00000000 00000000 c03152a0 ffffe000 c0b03cbc
[ 8530.210403] 1f60: c0b03c70 00000000 00000000 c0a28a28 00000000 00000000 c0b01f90 c0b01f98
[ 8530.210404] 1f80: c030892c c0308930 60000013 ffffffff
[ 8530.210406] [<c030c20c>] (__irq_svc) from [<c0308930>] (arch_cpu_idle+0x38/0x44)
[ 8530.210408] [<c0308930>] (arch_cpu_idle) from [<c0359a5c>] (do_idle+0xe8/0x1bc)
[ 8530.210409] [<c0359a5c>] (do_idle) from [<c0359dd4>] (cpu_startup_entry+0x1c/0x20)
[ 8530.210411] [<c0359dd4>] (cpu_startup_entry) from [<c0a00ce8>] (start_kernel+0x414/0x420)
1 Like
Apologies for posting about the r7500v2 in the r7800 thread, but I have noticed similar symptoms as well.
The elevated load average/spikiness was not present in 'OpenWrt SNAPSHOT r9545-9c216fbbde' (kernel 4.14.104) but I do observe it in OpenWrt SNAPSHOT r9739-b2152c8e6b (kernel 4.14.108).
output of pidstat -H 2:
root@OpenWrt:~/local# pidstat -H 2
Linux 4.14.108 (OpenWrt) 	04/06/19 	_armv7l_	(2 CPU)

1554550697    UID       PID    %usr %system  %guest   %wait    %CPU   CPU  Command
1554550699      0      6139    0.00    0.49    0.00    0.00    0.49     1  kworker/1:2
1554550699      0      6884    0.00    1.48    0.00    0.00    1.48     0  pidstat
1554550699      0     30027    0.00   21.18    0.00    0.00   21.18     0  kworker/0:1

1554550699    UID       PID    %usr %system  %guest   %wait    %CPU   CPU  Command
1554550701      0         8    0.00    0.50    0.00    0.00    0.50     1  rcu_sched
1554550701      0        14    0.00    0.50    0.00    0.00    0.50     1  ksoftirqd/1
1554550701      0      6139    0.00    0.50    0.00    0.00    0.50     1  kworker/1:2
1554550701      0      6621    0.00    0.50    0.00    0.00    0.50     1  dropbear
1554550701      0      6884    0.50    0.50    0.00    0.00    0.99     0  pidstat
1554550701      0     30027    0.00   20.79    0.00    0.00   20.79     0  kworker/0:1

1554550701    UID       PID    %usr %system  %guest   %wait    %CPU   CPU  Command
1554550703      0         7    0.00    0.50    0.00    0.00    0.50     0  ksoftirqd/0
1554550703      0        14    0.00    1.00    0.00    0.00    1.00     1  ksoftirqd/1
1554550703      0      6139    0.00    0.50    0.00    0.00    0.50     1  kworker/1:2
1554550703      0      6884    1.49    0.50    0.00    0.00    1.99     0  pidstat
1554550703      0     30027    0.00   20.40    0.00    0.00   20.40     0  kworker/0:1

1554550703    UID       PID    %usr %system  %guest   %wait    %CPU   CPU  Command
1554550705      0         8    0.00    0.50    0.00    0.00    0.50     1  rcu_sched
1554550705      0       667    0.00    1.00    0.00    0.00    1.00     1  logd
1554550705      0      3009    0.00    0.50    0.00    0.00    0.50     0  hostapd
1554550705      0      6139    0.00    0.50    0.00    0.00    0.50     1  kworker/1:2
1554550705      0      6884    0.50    0.50    0.00    0.00    1.00     1  pidstat
1554550705      0     30027    0.00   15.00    0.00    0.00   15.00     0  kworker/0:1

1554550705    UID       PID    %usr %system  %guest   %wait    %CPU   CPU  Command
1554550707      0        14    0.00    0.98    0.00    0.00    0.98     1  ksoftirqd/1
1554550707      0      3273    0.00    0.49    0.00    0.00    0.49     1  hostapd
1554550707      0      6139    0.00    0.98    0.00    0.00    0.98     1  kworker/1:2
1554550707      0      6621    0.00    0.49    0.00    0.00    0.49     1  dropbear
1554550707      0      6884    0.98    0.98    0.00    0.00    1.96     1  pidstat
1554550707      0     30027    0.00    5.88    0.00    0.00    5.88     0  kworker/0:1

1554550707    UID       PID    %usr %system  %guest   %wait    %CPU   CPU  Command
1554550709      0      3064    0.50    0.00    0.00    0.00    0.50     1  charon
1554550709      0      6621    0.50    0.00    0.00    0.00    0.50     1  dropbear
1554550709      0      6884    0.00    1.50    0.00    0.00    1.50     1  pidstat
1554550709      0     30027    0.00   21.00    0.00    0.00   21.00     0  kworker/0:1

1554550709    UID       PID    %usr %system  %guest   %wait    %CPU   CPU  Command
1554550711      0         8    0.00    0.50    0.00    0.00    0.50     1  rcu_sched
1554550711      0        14    0.00    1.00    0.00    0.00    1.00     1  ksoftirqd/1
1554550711      0       696    0.00    0.50    0.00    0.00    0.50     1  irqbalance
1554550711      0      6139    0.00    0.50    0.00    0.00    0.50     1  kworker/1:2
1554550711      0      6884    0.50    1.00    0.00    0.00    1.50     1  pidstat
1554550711      0     30027    0.00   20.00    0.00    0.00   20.00     0  kworker/0:1

1554550711    UID       PID    %usr %system  %guest   %wait    %CPU   CPU  Command
1554550713      0         7    0.00    0.50    0.00    0.00    0.50     0  ksoftirqd/0
1554550713      0        14    0.00    0.50    0.00    0.00    0.50     1  ksoftirqd/1
1554550713      0      2681    0.50    2.00    0.00    0.00    2.50     1  collectd
1554550713      0      6139    0.00    0.50    0.00    0.00    0.50     1  kworker/1:2
1554550713      0      6621    0.00    0.50    0.00    0.00    0.50     1  dropbear
1554550713      0      6884    0.50    0.50    0.00    0.00    1.00     1  pidstat
1554550713      0     29484    0.00    0.50    0.00    0.00    0.50     1  kworker/u4:0
1554550713      0     30027    0.00   20.50    0.00    0.00   20.50     0  kworker/0:1

1554550713    UID       PID    %usr %system  %guest   %wait    %CPU   CPU  Command
1554550715      0        14    0.00    0.50    0.00    0.00    0.50     1  ksoftirqd/1
1554550715      0       667    0.50    0.50    0.00    0.00    1.00     0  logd
1554550715      0       841    0.00    0.50    0.00    0.00    0.50     1  netifd
1554550715      0      2572    0.00    0.50    0.00    0.00    0.50     0  odhcpd
1554550715      0      6139    0.00    0.50    0.00    0.00    0.50     1  kworker/1:2
1554550715      0      6621    0.00    0.50    0.00    0.00    0.50     1  dropbear
1554550715      0      6884    0.00    1.00    0.00    0.00    1.00     1  pidstat
1554550715      0     30027    0.00   21.00    0.00    0.00   21.00     0  kworker/0:1

1554550715    UID       PID    %usr %system  %guest   %wait    %CPU   CPU  Command
1554550717      0         8    0.00    0.50    0.00    0.00    0.50     1  rcu_sched
1554550717      0        14    0.00    0.50    0.00    0.00    0.50     1  ksoftirqd/1
1554550717      0      6139    0.00    0.50    0.00    0.00    0.50     1  kworker/1:2
1554550717      0      6621    0.00    0.50    0.00    0.00    0.50     1  dropbear
1554550717      0      6884    0.50    1.00    0.00    0.00    1.50     1  pidstat

1554550717    UID       PID    %usr %system  %guest   %wait    %CPU   CPU  Command
1554550719      0      3009    0.00    0.50    0.00    0.00    0.50     0  hostapd
1554550719      0      6139    0.00    0.50    0.00    0.00    0.50     1  kworker/1:2
1554550719      0      6621    0.00    0.50    0.00    0.00    0.50     1  dropbear
1554550719      0      6884    0.00    1.50    0.00    0.00    1.50     1  pidstat
1554550719      0     30027    0.00   21.00    0.00    0.00   21.00     0  kworker/0:1

1554550719    UID       PID    %usr %system  %guest   %wait    %CPU   CPU  Command
1554550721      0         7    0.00    0.50    0.00    0.00    0.50     0  ksoftirqd/0
1554550721      0        14    0.00    1.00    0.00    0.00    1.00     1  ksoftirqd/1
1554550721      0      6139    0.00    0.50    0.00    0.00    0.50     1  kworker/1:2
1554550721      0      6621    0.00    0.50    0.00    0.00    0.50     1  dropbear
1554550721      0      6884    0.50    1.50    0.00    0.00    2.00     0  pidstat
1554550721      0     30027    0.00   21.00    0.00    0.00   21.00     0  kworker/0:1

1554550721    UID       PID    %usr %system  %guest   %wait    %CPU   CPU  Command
1554550723      0         8    0.00    0.50    0.00    0.00    0.50     1  rcu_sched
1554550723      0        14    0.00    0.50    0.00    0.00    0.50     1  ksoftirqd/1
1554550723      0      6139    0.00    0.50    0.00    0.00    0.50     1  kworker/1:2
1554550723      0      6884    0.99    0.00    0.00    0.00    0.99     0  pidstat
1554550723      0     30027    0.00   20.79    0.00    0.00   20.79     0  kworker/0:1

1554550723    UID       PID    %usr %system  %guest   %wait    %CPU   CPU  Command
1554550725      0         7    0.00    0.50    0.00    0.00    0.50     0  ksoftirqd/0
1554550725      0        14    0.00    1.00    0.00    0.00    1.00     1  ksoftirqd/1
1554550725      0       667    0.50    0.50    0.00    0.00    1.00     0  logd
1554550725    453      4680    0.00    0.50    0.00    0.00    0.50     1  dnsmasq
1554550725      0      6139    0.00    1.00    0.00    0.00    1.00     1  kworker/1:2
1554550725      0      6884    0.00    1.00    0.00    0.00    1.00     0  pidstat
1554550725      0     30027    0.00   19.00    0.00    0.00   19.00     0  kworker/0:1

1554550725    UID       PID    %usr %system  %guest   %wait    %CPU   CPU  Command
1554550727      0         8    0.00    0.50    0.00    0.00    0.50     1  rcu_sched
1554550727    453      4680    0.50    0.00    0.00    0.00    0.50     1  dnsmasq
1554550727      0      6884    0.00    1.00    0.00    0.00    1.00     1  pidstat
1554550727      0     29484    0.00    0.50    0.00    0.00    0.50     1  kworker/u4:0
1554550727      0     30027    0.00    5.50    0.00    0.00    5.50     0  kworker/0:1
^C

Average:      UID       PID    %usr %system  %guest   %wait    %CPU   CPU  Command
Average:        0         7    0.00    0.13    0.00    0.00    0.13     -  ksoftirqd/0
Average:        0         8    0.00    0.20    0.00    0.00    0.20     -  rcu_sched
Average:        0        14    0.00    0.50    0.00    0.00    0.50     -  ksoftirqd/1
Average:        0       667    0.07    0.13    0.00    0.00    0.20     -  logd
Average:        0       696    0.00    0.03    0.00    0.00    0.03     -  irqbalance
Average:        0       841    0.00    0.03    0.00    0.00    0.03     -  netifd
Average:        0      2572    0.00    0.03    0.00    0.00    0.03     -  odhcpd
Average:        0      2681    0.03    0.13    0.00    0.00    0.17     -  collectd
Average:        0      3009    0.00    0.07    0.00    0.00    0.07     -  hostapd
Average:        0      3064    0.03    0.00    0.00    0.00    0.03     -  charon
Average:        0      3273    0.00    0.03    0.00    0.00    0.03     -  hostapd
Average:      453      4680    0.03    0.03    0.00    0.00    0.07     -  dnsmasq
Average:        0      6139    0.00    0.50    0.00    0.00    0.50     -  kworker/1:2
Average:        0      6621    0.03    0.23    0.00    0.00    0.27     -  dropbear
Average:        0      6884    0.43    0.93    0.00    0.00    1.36     -  pidstat
Average:        0     29484    0.00    0.07    0.00    0.00    0.07     -  kworker/u4:0
Average:        0     30027    0.00   16.87    0.00    0.00   16.87     -  kworker/0:100:
Suggestions to further help identify the root cause are welcome.
One note, I had 21+ days uptime on 9545 and only stopped to "upgrade." A few days before the update, I started using strongswan and cake/piece of cake. Still, the load average did not start spiking like it does on 9739. I also observed the following stack trace (once not long after boot - current uptime is 8+ days) in 9739 but I don't know if its related:
[94921.246407] ------------[ cut here ]------------
[94921.246484] WARNING: CPU: 1 PID: 2760 at backports-4.19.23-1/net/wireless/util.c:1146 cfg80211_calculate_bitrate+0x1cc/0x254 [cfg80211]
[94921.250209] invalid rate bw=0, mcs=15, nss=4
[94921.262068] Modules linked in: pppoe ppp_async ath10k_pci ath10k_core ath rndis_host pppox ppp_generic nf_conntrack_ipv6 mac80211 iptable_nat ipt_REJECT ipt_MASQUERADE cfg80211 cdc_ether xt_time xt_tcpudp xt_tcpmss xt_statistic xt_state xt_recent xt_policy xt_nat xt_multiport xt_mark xt_mac xt_limit xt_length xt_hl xt_helper xt_esp xt_ecn xt_dscp xt_conntrack xt_connmark xt_connlimit xt_connbytes xt_comment xt_TCPMSS xt_REDIRECT xt_LOG xt_HL xt_FLOWOFFLOAD xt_DSCP xt_CT xt_CLASSIFY usbnet ums_usbat ums_sddr55 ums_sddr09 ums_karma ums_jumpshot ums_isd200 ums_freecom ums_datafab ums_cypress ums_alauda slhc nf_reject_ipv4 nf_nat_redirect nf_nat_masquerade_ipv4 nf_conntrack_ipv4 nf_nat_ipv4 nf_nat nf_log_ipv4 nf_flow_table_hw nf_flow_table nf_defrag_ipv6 nf_defrag_ipv4 nf_conntrack_rtcache iptable_raw
[94921.314901]  iptable_mangle iptable_filter ipt_ah ipt_ECN ip_tables crc_itu_t crc_ccitt compat sch_cake nf_conntrack sch_tbf sch_ingress sch_htb sch_hfsc em_u32 cls_u32 cls_tcindex cls_route cls_matchall cls_fw cls_flow cls_basic act_skbedit act_mirred ledtrig_usbport nf_log_ipv6 nf_log_common ip6table_mangle ip6table_filter ip6_tables ip6t_REJECT x_tables nf_reject_ipv6 ifb xfrm6_mode_tunnel xfrm6_mode_transport xfrm6_mode_beet ipcomp6 xfrm6_tunnel esp6 ah6 xfrm4_tunnel xfrm4_mode_tunnel xfrm4_mode_transport xfrm4_mode_beet ipcomp esp4 ah4 tunnel6 tunnel4 tun xfrm_user xfrm_ipcomp af_key xfrm_algo vfat fat ntfs nls_utf8 nls_iso8859_1 nls_cp437 algif_skcipher algif_hash af_alg sha1_generic md5 echainiv authenc uas usb_storage leds_gpio xhci_plat_hcd xhci_pci xhci_hcd dwc3 dwc3_of_simple ohci_platform
[94921.385467]  ohci_hcd phy_qcom_dwc3 ahci ehci_platform sd_mod ahci_platform libahci_platform libahci libata scsi_mod ehci_hcd f2fs ext4 mbcache jbd2 crc32c_generic crc32_generic
[94921.407715] CPU: 1 PID: 2760 Comm: reader#0 Not tainted 4.14.108 #0
[94921.423612] Hardware name: Generic DT based system
[94921.429712] [<c030f2b4>] (unwind_backtrace) from [<c030b490>] (show_stack+0x14/0x20)
[94921.434564] [<c030b490>] (show_stack) from [<c07c0118>] (dump_stack+0x88/0x9c)
[94921.442464] [<c07c0118>] (dump_stack) from [<c0322be8>] (__warn+0xf0/0x11c)
[94921.449491] [<c0322be8>] (__warn) from [<c0322c48>] (warn_slowpath_fmt+0x34/0x4c)
[94921.456372] [<c0322c48>] (warn_slowpath_fmt) from [<bf653b40>] (cfg80211_calculate_bitrate+0x1cc/0x254 [cfg80211])
[94921.464082] [<bf653b40>] (cfg80211_calculate_bitrate [cfg80211]) from [<bf67eb7c>] (nl80211_put_sta_rate+0x48/0x2e8 [cfg80211])
[94921.474296] [<bf67eb7c>] (nl80211_put_sta_rate [cfg80211]) from [<bf666e94>] (nl80211_update_connect_params+0x7c4/0x1078 [cfg80211])
[94921.485649] [<bf666e94>] (nl80211_update_connect_params [cfg80211]) from [<bf66fe40>] (nl80211_dump_station+0xe8/0x134 [cfg80211])
[94921.497790] [<bf66fe40>] (nl80211_dump_station [cfg80211]) from [<c06e22a8>] (genl_lock_dumpit+0x3c/0x60)
[94921.509304] [<c06e22a8>] (genl_lock_dumpit) from [<c06df5f4>] (netlink_dump+0x114/0x2a4)
[94921.518934] [<c06df5f4>] (netlink_dump) from [<c06dfcec>] (__netlink_dump_start+0xe8/0x1b4)
[94921.527095] [<c06dfcec>] (__netlink_dump_start) from [<c06e2ddc>] (genl_rcv_msg+0x194/0x3a0)
[94921.535168] [<c06e2ddc>] (genl_rcv_msg) from [<c06e1f98>] (netlink_rcv_skb+0x94/0x110)
[94921.543849] [<c06e1f98>] (netlink_rcv_skb) from [<c06e2c2c>] (genl_rcv+0x2c/0x48)
[94921.551572] [<c06e2c2c>] (genl_rcv) from [<c06e16fc>] (netlink_unicast+0x164/0x224)
[94921.559124] [<c06e16fc>] (netlink_unicast) from [<c06e1bcc>] (netlink_sendmsg+0x334/0x390)
[94921.566600] [<c06e1bcc>] (netlink_sendmsg) from [<c068a8e0>] (sock_sendmsg+0x18/0x34)
[94921.574927] [<c068a8e0>] (sock_sendmsg) from [<c068ae88>] (___sys_sendmsg+0x214/0x250)
[94921.582824] [<c068ae88>] (___sys_sendmsg) from [<c068be08>] (__sys_sendmsg+0x48/0x78)
[94921.590637] [<c068be08>] (__sys_sendmsg) from [<c0307da0>] (ret_fast_syscall+0x0/0x54)
[94921.598620] ---[ end trace 0ea683e995b5dbc4 ]---
intdev
April 6, 2019, 12:14pm
1543
My Result, Below:
Linux 4.14.109 (OpenWrt_QCA9984)        04/06/19        _armv7l_        (2 CPU)

1554552409    UID       PID    %usr %system  %guest   %wait    %CPU   CPU  Command
1554552412      0       981    0.00    0.50    0.00    0.00    0.50     1  kworker/1:3
1554552412      0      1375    0.50    0.00    0.00    0.00    0.50     0  hostapd
1554552412      0      1536    0.00   20.79    0.00    0.00   20.79     0  kworker/0:0
1554552412      0      4957    0.00    1.49    0.00    0.00    1.49     1  pidstat

1554552412    UID       PID    %usr %system  %guest   %wait    %CPU   CPU  Command
1554552414      0         7    0.00    0.50    0.00    0.00    0.50     0  ksoftirqd/0
1554552414      0      1536    0.00   21.00    0.00    0.00   21.00     0  kworker/0:0
1554552414      0      3958    0.50    0.00    0.00    0.00    0.50     1  dropbear
1554552414      0      4957    0.00    1.00    0.00    0.00    1.00     1  pidstat

1554552414    UID       PID    %usr %system  %guest   %wait    %CPU   CPU  Command
1554552416      0         8    0.00    0.50    0.00    0.00    0.50     0  rcu_sched
1554552416      0      1375    0.50    0.00    0.00    0.00    0.50     0  hostapd
1554552416      0      1536    0.00    4.98    0.00    0.00    4.98     0  kworker/0:0
1554552416      0      4957    0.00    1.00    0.00    0.00    1.00     1  pidstat

1554552416    UID       PID    %usr %system  %guest   %wait    %CPU   CPU  Command
1554552418      0       548    0.00    0.50    0.00    0.00    0.50     0  netifd
1554552418      0       981    0.00    0.50    0.00    0.00    0.50     1  kworker/1:3
1554552418      0      1536    0.00   15.50    0.00    0.00   15.50     0  kworker/0:0
1554552418      0      4957    0.00    1.50    0.00    0.00    1.50     1  pidstat

1554552418    UID       PID    %usr %system  %guest   %wait    %CPU   CPU  Command
1554552420      0      1031    0.50    0.00    0.00    0.00    0.50     0  udhcpc
1554552420      0      1536    0.00   20.50    0.00    0.00   20.50     0  kworker/0:0
1554552420      0      4957    0.50    0.50    0.00    0.00    1.00     1  pidstat

1554552420    UID       PID    %usr %system  %guest   %wait    %CPU   CPU  Command
1554552422      0       981    0.00    0.50    0.00    0.00    0.50     1  kworker/1:3
1554552422      0      1375    0.00    0.50    0.00    0.00    0.50     0  hostapd
1554552422      0      1536    0.00   21.00    0.00    0.00   21.00     0  kworker/0:0
1554552422      0      4957    1.00    0.50    0.00    0.00    1.50     1  pidstat

1554552422    UID       PID    %usr %system  %guest   %wait    %CPU   CPU  Command
1554552424      0      1536    0.00   21.00    0.00    0.00   21.00     0  kworker/0:0
1554552424      0      3958    0.00    0.50    0.00    0.00    0.50     1  dropbear
1554552424      0      4957    1.00    0.50    0.00    0.00    1.50     1  pidstat

1554552424    UID       PID    %usr %system  %guest   %wait    %CPU   CPU  Command
1554552426      0      1375    0.00    0.50    0.00    0.00    0.50     0  hostapd
1554552426      0      1536    0.00   10.00    0.00    0.00   10.00     0  kworker/0:0
1554552426      0      4957    1.00    0.00    0.00    0.00    1.00     1  pidstat

1554552426    UID       PID    %usr %system  %guest   %wait    %CPU   CPU  Command
1554552428      0         8    0.00    0.50    0.00    0.00    0.50     1  rcu_sched
1554552428      0       981    0.00    0.50    0.00    0.00    0.50     1  kworker/1:3
1554552428      0      1536    0.00   11.00    0.00    0.00   11.00     0  kworker/0:0
1554552428      0      3958    0.50    0.00    0.00    0.00    0.50     1  dropbear
1554552428      0      4957    0.50    0.50    0.00    0.00    1.00     1  pidstat

1554552428    UID       PID    %usr %system  %guest   %wait    %CPU   CPU  Command
1554552430      0       192    0.00    0.50    0.00    0.00    0.50     1  kworker/u4:2
1554552430      0      1536    0.00   21.00    0.00    0.00   21.00     0  kworker/0:0
1554552430      0      4957    0.00    1.50    0.00    0.00    1.50     1  pidstat

1554552430    UID       PID    %usr %system  %guest   %wait    %CPU   CPU  Command
1554552432      0       981    0.00    0.50    0.00    0.00    0.50     1  kworker/1:3
1554552432      0      1375    0.00    0.50    0.00    0.00    0.50     0  hostapd
1554552432      0      1536    0.00   20.40    0.00    0.00   20.40     0  kworker/0:0
1554552432      0      4957    0.00    1.00    0.00    0.00    1.00     1  pidstat

1554552432    UID       PID    %usr %system  %guest   %wait    %CPU   CPU  Command
1554552434      0        14    0.00    0.50    0.00    0.00    0.50     1  ksoftirqd/1
1554552434      0      1375    0.00    0.50    0.00    0.00    0.50     0  hostapd
1554552434      0      1536    0.00   21.00    0.00    0.00   21.00     0  kworker/0:0
1554552434      0      3958    0.00    0.50    0.00    0.00    0.50     1  dropbear
1554552434      0      4957    0.50    1.00    0.00    0.00    1.50     1  pidstat

1554552434    UID       PID    %usr %system  %guest   %wait    %CPU   CPU  Command
1554552436      0      1536    0.00   13.50    0.00    0.00   13.50     0  kworker/0:0
1554552436      0      4957    1.50    0.50    0.00    0.00    2.00     1  pidstat

1554552436    UID       PID    %usr %system  %guest   %wait    %CPU   CPU  Command
1554552438      0       981    0.00    0.50    0.00    0.00    0.50     1  kworker/1:3
1554552438      0      1375    0.00    0.50    0.00    0.00    0.50     0  hostapd
1554552438      0      1536    0.00    7.00    0.00    0.00    7.00     0  kworker/0:0
1554552438      0      4957    0.00    1.00    0.00    0.00    1.00     1  pidstat

1554552438    UID       PID    %usr %system  %guest   %wait    %CPU   CPU  Command
1554552440      0      1536    0.00   21.00    0.00    0.00   21.00     0  kworker/0:0
1554552440      0      3958    0.50    0.00    0.00    0.00    0.50     1  dropbear
1554552440      0      4957    1.00    0.50    0.00    0.00    1.50     1  pidstat

1554552440    UID       PID    %usr %system  %guest   %wait    %CPU   CPU  Command
1554552442      0      1375    0.00    0.50    0.00    0.00    0.50     0  hostapd
1554552442      0      1536    0.00   20.90    0.00    0.00   20.90     0  kworker/0:0
1554552442      0      4957    0.00    1.49    0.00    0.00    1.49     1  pidstat

1554552442    UID       PID    %usr %system  %guest   %wait    %CPU   CPU  Command
1554552444      0       981    0.00    0.50    0.00    0.00    0.50     1  kworker/1:3
1554552444      0      1031    0.50    0.00    0.00    0.00    0.50     1  udhcpc
1554552444      0      1375    0.00    0.50    0.00    0.00    0.50     0  hostapd
1554552444      0      1536    0.00   20.50    0.00    0.00   20.50     0  kworker/0:0
1554552444      0      4957    0.00    1.00    0.00    0.00    1.00     1  pidstat
^C

Average:      UID       PID    %usr %system  %guest   %wait    %CPU   CPU  Command
Average:        0         7    0.00    0.03    0.00    0.00    0.03     -  ksoftirqd/0
Average:        0         8    0.00    0.06    0.00    0.00    0.06     -  rcu_sched
Average:        0        14    0.00    0.03    0.00    0.00    0.03     -  ksoftirqd/1
Average:        0       192    0.00    0.03    0.00    0.00    0.03     -  kworker/u4:2
Average:        0       548    0.00    0.03    0.00    0.00    0.03     -  netifd
Average:        0       981    0.00    0.21    0.00    0.00    0.21     -  kworker/1:3
Average:        0      1031    0.06    0.00    0.00    0.00    0.06     -  udhcpc
Average:        0      1375    0.06    0.21    0.00    0.00    0.26     -  hostapd
Average:        0      1536    0.00   17.12    0.00    0.00   17.12     -  kworker/0:0
Average:        0      3958    0.09    0.06    0.00    0.00    0.15     -  dropbear
Average:        0      4957    0.41    0.88    0.00    0.00    1.29     -  pidstat
@anon98444528 Yeah, I've seen it too, I think the warning is however unrelated to the spikes.
Btw, adding to this discussion, afaik kworker should normally be quite low in cpu usage. They are at 0% on my other running linux systems.
I suspect this commit changing MIB-counter behaviour has something to do with the CPU spikes: https://git.openwrt.org/?p=openwrt/openwrt.git;a=commit;h=d6366ce3665f010a7ae7061a557689643073040a
MIB-counters have caused some latency issues in the past on the R7800 per this post: Possible cause of R7800 latency issues
2 Likes
so i'm curios. does anyone know if the git bisect function (or just git checkout ) can be used with openwrt (i.e. is there something more I need to be concerned about related to feeds, updated toolchain, etc)? regardless i see a bunch of commits related to ar8216 and i'm assuming i'd want to bisect around all of them as a group...
Seems like they found the issue in the posts that @huaracheguarache mentioned.
hnyman
April 6, 2019, 8:11pm
1548
At least the checkout can be used quite normally. But when going back to history, you may need to rebuild the tools & toolchain, so bisecting can be time-consuming, if you use the traditional midpoint-commit bisecting.
I usually do bisecting semi-manually by trying to identify from the commit logs the possible culprit commits and checkout just before them to get the baseline.
You should also checkout package & luci feeds from the same time in order to avoid any incompatible stuff. Add complexity. In practice, easiest may be to make just a base image with only minimal extra packages, so that you could avoid the special feed checkouts.
1 Like
some debugging info.... thermal / cooling will influence......
cat /sys/devices/system/cpu/cpufreq/policy1/scaling_governor
cat /sys/devices/system/cpu/cpufreq/policy1/stats/trans_table
cat /sys/devices/system/cpu/cpufreq/policy1/scaling_cur_freq
is 3%@maxFREQ = 17%@minFREQ ?
#!/bin/sh
##################################################
PS1='[\u@\h \W]\$ '
##################################################
bash_prompt_command() {
    local pwdmaxlen=20
    local trunc_symbol=".."
    local dir=${PWD##*/}
    pwdmaxlen=$(( ( pwdmaxlen < ${#dir} ) ? ${#dir} : pwdmaxlen ))
    NEW_PWD=${PWD/#$HOME/\~}
    local pwdoffset=$(( ${#NEW_PWD} - pwdmaxlen ))
    if [ ${pwdoffset} -gt "0" ]
    then
        NEW_PWD=${NEW_PWD:$pwdoffset:$pwdmaxlen}
        NEW_PWD=${trunc_symbol}/${NEW_PWD#*/}
    fi

    TEMP="`cat /sys/devices/virtual/thermal/thermal_zone2/temp | cut -c 1,2``echo $'\xc2\xb0'`"
    NEW_PWD="${NEW_PWD} ${TEMP}"

}
#####################################################
bash_prompt() {
    case $TERM in
     xterm*|rxvt*)
         local TITLEBAR='\[\033]0;\u:${NEW_PWD}\007\]'
          ;;
     *)
        local TITLEBAR=""
          ;;
    esac
    local NONE="\[\033[0m\]"    # unsets color to term's fg color
    local K="\[\033[0;30m\]"    # black
    local R="\[\033[0;31m\]"    # red
    local G="\[\033[0;32m\]"    # green
    local Y="\[\033[0;33m\]"    # yellow
    local B="\[\033[0;34m\]"    # blue
    local M="\[\033[0;35m\]"    # magenta
    local C="\[\033[0;36m\]"    # cyan
    local W="\[\033[0;37m\]"    # white
    local EMK="\[\033[1;30m\]"
    local EMR="\[\033[1;31m\]"
    local EMG="\[\033[1;32m\]"
    local EMY="\[\033[1;33m\]"
    local EMB="\[\033[1;34m\]"
    local EMM="\[\033[1;35m\]"
    local EMC="\[\033[1;36m\]"
    local EMW="\[\033[1;37m\]"
    local BGK="\[\033[40m\]"
    local BGR="\[\033[41m\]"
    local BGG="\[\033[42m\]"
    local BGY="\[\033[43m\]"
    local BGB="\[\033[44m\]"
    local BGM="\[\033[45m\]"
    local BGC="\[\033[46m\]"
    local BGW="\[\033[47m\]"
    local UC=$G
    local VC=$Y
    [ $UID -eq "0" ] && VC=$R

    PS1="$TITLEBAR${G}[${UC}\u${VC}@${EMG}\h ${EMB}\${NEW_PWD}${G}]${UC}\\$ ${NONE}"
}

PROMPT_COMMAND=bash_prompt_command
bash_prompt
unset bash_prompt
I managed to get kworker to 0% ... did some very dirty hacks. But it's silent now. So it's indeed related to the MiB update stuff.
@fantom-x btw fyi doing this does not make kworker cpu usage go down, i thought it would at first.
const struct ar8xxx_chip ar8337_chip = {
-	.caps = AR8XXX_CAP_GIGE | AR8XXX_CAP_MIB_COUNTERS,
+ .caps = AR8XXX_CAP_GIGE /*| AR8XXX_CAP_MIB_COUNTERS*/,
2 Likes
I am surprised that this isn't incorporated in these builds because the fact is known since april 2018
intdev:
OpenWRT SNAPSHOT r9773: Every 2sec, CPU spike 100%
i was going to build at current head but reverting all the commits titled "generic: ar8216: ..." from 03.24.2019 (instead of bisecting) but it seems like you have confirmed the cause.
unfortunately, i've also complicated it in my head by asking questions for which I'm not the best user to answer so i'm going to step back for a bit
I'm in no position to make a proper fix tho', I don't know C that good.
Do you mind sharing your findings?
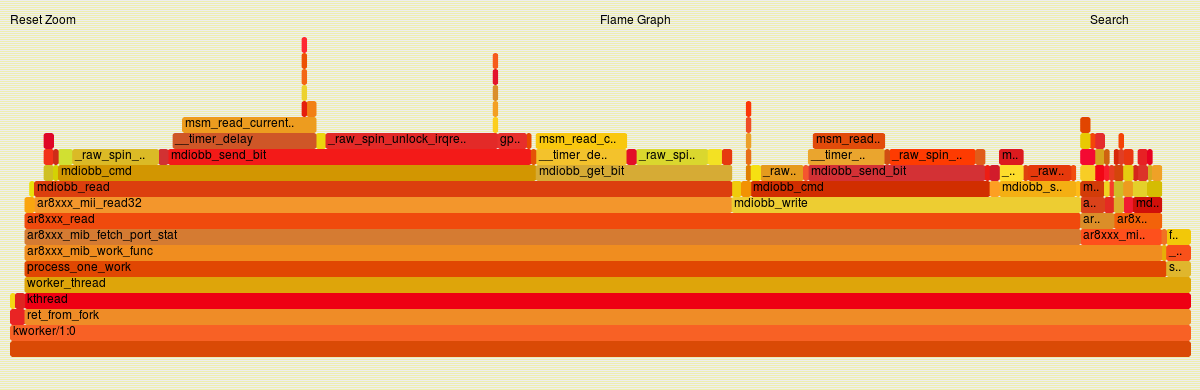
stats ( my system was at 2.5 - 3.5 % bursts - so the percantages are subsets of that 3% )
54.00% kworker/1:0  raw_spin_unlock_irqrestore
15.93% kworker/1:0  msm_read_current_timer
9.30%  kworker/1:0  timer_delay
There should probably be some sort of option that disables MIB-counters, provided that they're not critical for system functionality. This topic is relevant: MIB Counters for QCA8337 (Netgear R7800)
Well reverted the first changes I did and I've got to the point that I commented out all AR8XXX_CAP_MIB_COUNTERS (just in case).for (i = 0; i < priv->dev.ports; i++) /
There's no excessive cpu usage in the kworker process now.
Since these changes makes a full kernel recompile for some reason I've stopped there for now.
However I think swconfig dev switch0 show gives a pretty odd output, it also hangs.
Tho' it said in the old kworker forum thread the swconfig output differs from other routers, perhaps it needs investigation too.