Sorry, i have a Windows pc. Do i need tot built it or can i simply unpack and copy files to sd?
Have you read through this thread? I think you'll find the info you're looking for in some of the earlier posts. 
As for the SD card + Windows, the image is not just a file where you extract the contents to an SD card. It's literally an image of what the partitions and their contents will be when laid down onto the SD card, so it must be written at the block level of the card. I also use this tool on Mac and there's a Windows version too: https://www.balena.io/etcher/
Thanks, added in the last post: NanoPI R2S is a great OpenWrt device
1 Like
Add this to target/linux/rockchip/armv8/config-5.4 fix waits for an interactive response
CONFIG_CRYPTO_AES_ARM64_CE_BLK=y
CONFIG_CRYPTO_AES_ARM64_CE_CCM=y
CONFIG_CRYPTO_SHA512_ARM64=y
CONFIG_CRYPTO_SHA512_ARM64_CE=y
CONFIG_CRYPTO_SHA3_ARM64=y
CONFIG_CRYPTO_SM3_ARM64_CE=y
CONFIG_CRYPTO_SM4_ARM64_CE=y
CONFIG_CRYPTO_CRCT10DIF_ARM64_CE=y
CONFIG_CRYPTO_AES_ARM64_NEON_BLK=y
CONFIG_CRYPTO_AES_ARM64_BS=y
CONFIG_CRYPTO_ANSI_CPRNG=y
CONFIG_CRYPTO_CMAC=y
CONFIG_CRYPTO_ECB=y
CONFIG_CRYPTO_GHASH_ARM64_CE=y
CONFIG_CRYPTO_MD5=y
CONFIG_CRYPTO_SHA1=y
CONFIG_CRYPTO_SHA1_ARM64_CE=y
CONFIG_CRYPTO_SHA2_ARM64_CE=y
CONFIG_CRYPTO_SHA512=y
CONFIG_CRYPTO_TWOFISH=y
CONFIG_CRYPTO_USER_API_HASH=y
CONFIG_CRYPTO_USER_API_SKCIPHER=y
CONFIG_CRYPTO_DEV_ROCKCHIP=y
CONFIG_SND_SOC_ROCKCHIP=m
CONFIG_SND_SOC_ROCKCHIP_I2S=m
CONFIG_SND_SOC_ROCKCHIP_PDM=m
CONFIG_SND_SOC_ROCKCHIP_SPDIF=m
2 Likes
Update to my previous post on performance Here...
I started to find that after a day or so of operating, my device was having trouble with SQM at my speeds. While on a WebEx meeting yesterday, I ran the speedtest-netperf.sh script on another Linux host (outside of the NanoPi) and noticed some bad side effects. With my SQM + VMware based OpenWrt VM previously, I could easily run any speed test and not suffer any noticeable consequences while on web meetings. Amazing how well SQM can work, really.
Performing the same tests would max out the CPU cores on the NanoPi R2S and about 50% of the time I would literally lose audio and video on my WebEx meeting. SQM stats indicated SQM latency of 8-9 seconds and dropped ACKs between 2,000-3,500 pps over several seconds at a time.
I switched from layer_cake to piece_of_cake and noticed pretty much the same behavior. Given that I have been so spoiled by CAKE as opposed to other qdiscs, I can't imagine switching back to a "lesser" qdisc just to justify sticking with this device at the moment.
I'm not getting rid of it at this point, but I have switched back over to my OpenWrt VM. I am confident this great community will continue to tweak and tune it and it may very well reach a point where I can go back to the NanoPi.
Is anyone else having the same experience at this point?
Well, HTB+fq_codel as in simple.qos will keep latency low even under overload conditions, but it will do so at a potentially significant throughput drop. That said, if your CPUs are busy for seconds on end, SQM is going to be unhappy...
Don't do that then? You can always run a speedtest through the router from another internal host without massively increasing the router's CPU load. Hammering the router with the required netperf/netserver instances is a valid test, but simply not diagnostic for the normal routing performance.
Sorry I was not more clear on this. I do not run the speedtest-netperf.sh script on my router itself for the reasons you mentioned. I run it from another Linux host on my network so as not to consume any OpenWrt resources unnecessarily with the netperf/netserver overhead. The load on the NanoPi that I was seeing was strictly OpenWrt doing routing.
In the interest of transparency, I do have collectd, netdata, and nextdns processes running on OpenWrt, along with the usual suspects (uhttpd, dropbear, banip, and the like). But that is apples-to-apples from a config standpoint between my NanoPi and OpenWrt VM.
I did update my previous post to indicate that the speedtest script was being run outside of the NanoPi box, so as to avoid any questions around that going forward.
1 Like
Mmmh, so it was just failing hard from trying to shape more bandwidth than cake can actually stomach on that router? Too bad you switched over, because I really would like to see how fq_codel/simple.qos would behave, with and without manual tuning of /usr/lib/sqm/defaults.sh by changing the following line"
[ -z "$SHAPER_BURST_DUR_US" ] && SHAPER_BURST_DUR_US=1000
to say 10000 or 20000. This will increase the burst buffer to 10 or 20ms which both should help to recover a bit of lost throughput without completely destroying real-time performance/ latency under load.
I still have the NanoPi powered up, so I can switch my cables back over to it at some point soon (probably in about two hours) and do those tests for you.
Something I meant to mention before is that my minimum latency was slightly higher with the NanoPi with the schedutil governor. Even with my OpenWrt VM running on top of a hypervisor, it has lower minimum latency overall. Now, when I switch my NanoPi over to the performance governor, minimum latency is decreased by ~3-5 ms, but it more quickly maxes out the CPU cores, as is logical. This unfortunately leads to the side effects I mentioned before where the CPU was maxed out to the point of SQM choking hard.
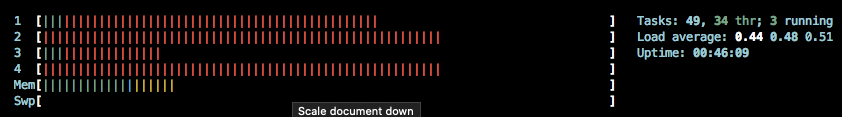
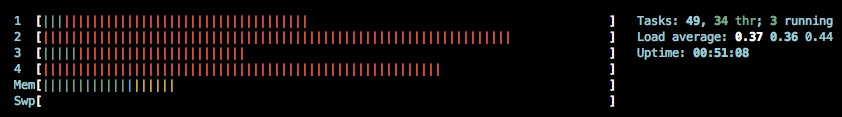
Perhaps it's worth noting for the sake of @jayanta525 and @xiaobo's efforts on this, from what I could tell the core that would max out earliest and stay pegged was the one assigned to IRQ 166 (CPU2 in my case), which if I'm not mistaken is the eth1 IRQ:
166: 2024 0 0 18571350 GICv2 99 Level xhci-hcd:usb4
IRQ 28 (eth0) would also get way up there, but only after a few seconds into a speed test when buffers started to really fill up.
1 Like
Thank you very much!
Configuring the SQM Bufferbloat Packages
The default values described below work quite well for most situations. They represent conservative estimates that may slightly overestimate the real overhead, which is generally desirable compared to under-estimating. You may be able to improve performance by experimenting with settings, see A little about tuning SQM below.
To configure SQM, choose Network → SQM QoS to see the Smart Queue Management (SQM) GUI.
- In the Basic Settings tab:
-
Check the Enable box
-
Set the Interface name: to your wide area link (usually eth0 for OpenWrt/LEDE, but check Network → Interfaces to find the name for the WAN port.)
-
Set the Download and Upload speeds to 80-95% of the speed you measured above in the Preparation.
- In the Queue Discipline tab, you can leave the settings at their default.
-
Choose cake as the Queueing Discipline
-
Choose piece_of_cake.qos as the Queue Setup Script
-
The Advanced Configuration defaults are designed to work well out of the box.
- In the Link Layer Adaptation tab, choose the kind of link you have:
-
For VDSL - Choose Ethernet , and set per packet overhead to 34 (or 26 if you know you are not using PPPoE)
-
For DSL of any other type - Choose ATM , and set per packet overhead to 44
-
For Cable - Choose Ethernet , and set per packet overhead to 22
-
For true ethernet or Fiber to the Premises - Choose Ethernet , and set per packet overhead to 44
-
When in Doubt, it's better to overestimate - Choose packet overhead 44
- Click Save & Apply . That's it!
Measure your latency again with the speed test. You should notice that the measured ping times should only be slightly larger during the downloads and uploads. Try using VoIP, Skype, Facetime, gaming, DNS, and general web browsing. They should be much more pleasant, even if someone's uploading or downloading a lot of data.
You've reduced your connection's bufferbloat!
A Little More SQM Tuning
The steps above will control latency well without additional effort. The 80-95% figures mentioned above are good first-cut estimates, but you can often gain more speed while still controlling latency by making a couple experiments to adjust the settings.
If you want to spend a few more minutes tuning, do these steps.
-
Increase the Download speed until the latency begins to increase, then go back to a slightly lower value.
-
Do the same for the Upload speed entry.
-
It may be worth your time to tweak the two a bit up and down to find a sweet spot for your connection and usage.
-
We recommend you use DSLReports Speed Test for the latency tests because it measures both speed and latency at the same time.
Note: If you have a DSL link, the experiments above may produce Download and Upload values that are actually higher than the original speed test results. This is OK: the ATM framing bytes of a DSL link add an average of 9% overhead, and these settings simply tell SQM how to make up for that overhead.
Note: If you use a cable modem, you should use a speed test that runs for a longer time. Cable modem makers have gamed speed tests thoroughly by using “Speedboost”, which usually gives you an extra 10 mbits or so for the first 10 seconds (so the speed test will look good(!)). Don't be surprised if the “right” setting for your queue rates is significantly lower than the no-SQM speed test results. You may need to tune the speeds down from your initial settings to get the latency to the point you need for your own usage of your connection.
Note: You can also experiment with the other settings (read SQM - The Details for more information), but they will not make nearly as large a difference as ensuring that the Download and Upload speeds are maximized.
Note: Also check the FAQ and Troubleshooting SQM guides.
3 Likes
I appreciate the thought behind posting all this info, but I am not new to SQM by any means. I'm quite familiar with the testing and tuning and have worked extensively to tweak and find the right values for my connection.
The point I was trying to get across is that the settings that I know are proven to work very well on my OpenWrt VM appear (and I realize there is more testing to be done) to not be handled so well by the NanoPi hardware at this time.
Admittedly, this R2S does perform better in CPU usage terms at my speeds on fq_codel/simple (as one would expect). However, the upstream latency is a good bit higher. Personally I am more of a "latency over speed" kind of person, so that's a bigger deal to me than it may be for others.
Here's a test of the R2S on fq_codel/simple where SHAPER_BURST_DUR_US=1000:
.............................................................
 Download: 427.83 Mbps
  Latency: [in msec, 60 pings, 0.00% packet loss]
      Min:  27.300
    10pct:  28.900
   Median:  31.900
      Avg:  31.965
    90pct:  36.200
      Max:  41.400
 CPU Load: [in % busy (avg +/- std dev), 59 samples]
     cpu0:   5.9 +/-  1.7
     cpu1:   6.0 +/-  1.7
     cpu2:   5.8 +/-  1.7
     cpu3:   4.4 +/-  1.5
 Overhead: [in % used of total CPU available]
  netperf:   8.6
.............................................................
   Upload:  23.32 Mbps
  Latency: [in msec, 61 pings, 0.00% packet loss]
      Min:  30.600
    10pct:  35.700
   Median:  46.600
      Avg:  47.067
    90pct:  58.300
      Max:  62.600
 CPU Load: [in % busy (avg +/- std dev), 59 samples]
     cpu0:   0.2 +/-  0.5
     cpu1:   0.1 +/-  0.3
     cpu2:   0.3 +/-  0.6
     cpu3:   0.2 +/-  0.4
 Overhead: [in % used of total CPU available]
  netperf:   0.1
SHAPER_BURST_DUR_US=10000:
.............................................................
 Download: 431.35 Mbps
  Latency: [in msec, 60 pings, 0.00% packet loss]
      Min:  28.500
    10pct:  29.200
   Median:  32.200
      Avg:  33.163
    90pct:  37.700
      Max:  43.700
 CPU Load: [in % busy (avg +/- std dev), 58 samples]
     cpu0:   5.5 +/-  1.6
     cpu1:   4.2 +/-  1.6
     cpu2:   5.3 +/-  1.6
     cpu3:   5.3 +/-  1.6
 Overhead: [in % used of total CPU available]
  netperf:   8.6
..............................................................
   Upload:  23.30 Mbps
  Latency: [in msec, 61 pings, 0.00% packet loss]
      Min:  24.500
    10pct:  32.500
   Median:  47.400
      Avg:  44.982
    90pct:  52.200
      Max:  56.500
 CPU Load: [in % busy (avg +/- std dev), 60 samples]
     cpu0:   0.1 +/-  0.4
     cpu1:   0.2 +/-  0.4
     cpu2:   0.5 +/-  0.6
     cpu3:   0.2 +/-  0.4
 Overhead: [in % used of total CPU available]
  netperf:   0.2
SHAPER_BURST_DUR_US=20000:
.............................................................
 Download: 427.92 Mbps
  Latency: [in msec, 60 pings, 0.00% packet loss]
      Min:  21.100
    10pct:  21.900
   Median:  24.900
      Avg:  25.252
    90pct:  29.300
      Max:  33.400
 CPU Load: [in % busy (avg +/- std dev), 58 samples]
     cpu0:   5.5 +/-  1.7
     cpu1:   5.3 +/-  1.5
     cpu2:   5.6 +/-  1.7
     cpu3:   4.6 +/-  1.7
 Overhead: [in % used of total CPU available]
  netperf:   8.6
.............................................................
   Upload:  23.36 Mbps
  Latency: [in msec, 61 pings, 0.00% packet loss]
      Min:  27.200
    10pct:  40.100
   Median:  48.700
      Avg:  48.570
    90pct:  54.600
      Max:  80.200
 CPU Load: [in % busy (avg +/- std dev), 59 samples]
     cpu0:   0.2 +/-  0.5
     cpu1:   0.2 +/-  0.4
     cpu2:   0.2 +/-  0.4
     cpu3:   0.3 +/-  0.5
 Overhead: [in % used of total CPU available]
  netperf:   0.1
For comparison, this is indicative of what I see with my OpenWrt VM running layer_cake:
.............................................................
 Download: 412.56 Mbps
  Latency: [in msec, 60 pings, 0.00% packet loss]
      Min:  13.300
    10pct:  14.200
   Median:  16.800
      Avg:  17.617
    90pct:  23.300
      Max:  30.800
 CPU Load: [in % busy (avg +/- std dev), 58 samples]
     cpu0:  10.2 +/-  1.8
     cpu1:  10.4 +/-  2.6
     cpu2:  10.5 +/-  2.1
     cpu3:  10.1 +/-  2.0
 Overhead: [in % used of total CPU available]
  netperf:  22.3
.................................................................
   Upload:  23.66 Mbps
  Latency: [in msec, 64 pings, 0.00% packet loss]
      Min:  14.900
    10pct:  15.400
   Median:  17.000
      Avg:  17.642
    90pct:  20.900
      Max:  24.000
 CPU Load: [in % busy (avg +/- std dev), 62 samples]
     cpu0:   0.3 +/-  0.4
     cpu1:   0.3 +/-  0.5
     cpu2:   0.2 +/-  0.4
     cpu3:   0.2 +/-  0.4
 Overhead: [in % used of total CPU available]
  netperf:   0.1
1 Like
Here's a test of cake/layer_cake with all the same configuration parameters I use on my OpenWrt VM:
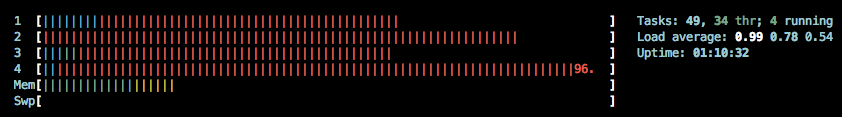
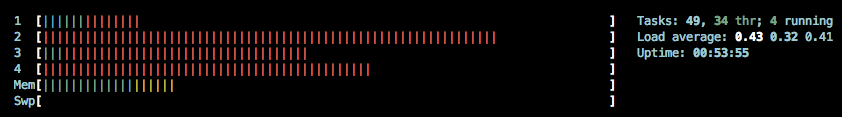
(It was hard to catch both CPU1 (eth0) and CPU3 (eth1) maxing out at the same time in a screen cap, but it does occur)
.............................................................
 Download: 300.91 Mbps
  Latency: [in msec, 56 pings, 0.00% packet loss]
      Min:  20.600
    10pct:  21.900
   Median:  26.200
      Avg: 1378.107
    90pct: 6395.000
      Max: 12523.000
 CPU Load: [in % busy (avg +/- std dev), 58 samples]
     cpu0:   3.5 +/-  2.4
     cpu1:   4.5 +/-  3.1
     cpu2:   4.5 +/-  2.9
     cpu3:   4.9 +/-  3.4
 Overhead: [in % used of total CPU available]
  netperf:   8.1
................................................................
   Upload:  23.47 Mbps
  Latency: [in msec, 64 pings, 0.00% packet loss]
      Min:  19.800
    10pct:  21.800
   Median:  23.700
      Avg:  24.923
    90pct:  28.400
      Max:  38.100
 CPU Load: [in % busy (avg +/- std dev), 62 samples]
     cpu0:   0.3 +/-  0.6
     cpu1:   0.2 +/-  0.4
     cpu2:   0.1 +/-  0.3
     cpu3:   0.2 +/-  0.4
 Overhead: [in % used of total CPU available]
  netperf:   0.1
Configuration:
root@OpenWrt-Nano:~# cat /etc/config/sqm

config queue 'eth0'
	option ingress_ecn 'ECN'
	option interface 'eth0'
	option debug_logging '0'
	option verbosity '5'
	option qdisc_advanced '1'
	option squash_dscp '1'
	option squash_ingress '1'
	option enabled '1'
	option egress_ecn 'NOECN'
	option download '450000'
	option upload '24500'
	option qdisc_really_really_advanced '1'
	option qdisc 'cake'
	option script 'layer_cake.qos'
	option iqdisc_opts 'diffserv4 docsis dual-dsthost nat ingress nowash'
	option eqdisc_opts 'diffserv4 docsis dual-srchost nat ack-filter'
	option linklayer 'none'
That is quite odd, as far as I can tell your speedtest test the directions sequentially, so the downstream carries almost no data during the upload test, so the upload RTT values for HTB-fq_codel look really odd.
Maybe I could convince you to follow this up with a flent test? Get the flent helper on the router with opkg upate ; opkg install flent-tools and then run something like the following on a Linux client with netperf and flent installed:
date ; ping -c 10 netperf-eu.bufferbloat.net ; ./run-flent --ipv4 --socket-stats -l 180 -H netperf-eu.bufferbloat.net --te=cpu_stats_hosts=root@192.168.1.1 rrul_cs8 --remote-metadata=root@192.168.1.1 -D . -t IPv4_with_CPU_stats;
This will try to collect some CPU usage data from the router as well as TCP socket statistics from the sending host (assuming the router to be 192.168.1.1).
But that is even more work than you invested in this already, so I fully understand if you pass ![]()
I don't mind at all! I already have flent set up on my Linux test box (where I speed test from) since I have been running a lot of flent tests for @dtaht around the ath10k AQL.
How would you like me to get the results to you? I can paste the stdout output here if you would like, but do you want me to e-mail you the flent file(s)?
1 Like
Flent files would be great, possibly via https://send.firefox.com ?
Please note that while I am quite intersted in that data, I can not really promise any worthwile outcome...
1 Like
Sent you a link to them via DM. One is a test against netperf-eu.bufferbloat.net and the other is flent-newark.bufferbloat.net since it's geographically closer to me.
2 Likes
Ah, that explains the difference in base RTT quite elegantly...