When I use Google Chrome (all addons disabled, cache deleted, cookies cleaned, local storage cleaned etc.), I have a massive interface lag time.
For example, loading the main Status page hangs on "Loading view" with the circular icon for a total of 41.62 seconds. By comparison, Firefox loads this page in 1.12 seconds.
Similarly, the Network-->Wireless page takes 21.38 seconds to load with Chrome and just over a second with Firefox.
This is against uhttpd. Using nginx, the interface is much faster and the wait time on Chrome decreases considerably, but a substantial gap still exists between Chrome and Firefox. Using nginx decreases the 41 second load time for the status page to a total of 3 seconds, while with Chrome to a little less than a second.
This is not a machine resource issue: my build is running on a 4-core x86_64 with 16GB of RAM and a data centre class SSD. It's also not a client PC issue: I've tested on multiple machines, wired and wireless connections and the problem is the same across all platforms.
Android versions of the browsers behave similarly, although they're both much slower to load the pages and sometimes glitch and don't load at all when using uhttpd.
My Openwrt 15.05 build running on exactly the same hardware with uhttpd as the backend loads these pages almost instantly.
Has anyone else noted this painfully slow behaviour from Chrome? I know others have already pointed out that uhttpd is very slow....
Spot on correct, thanks a ton. This reduces the load time from 41 seconds to 4.5 seconds.
So it's still not fast, but it's an order of magnitude better.
I'm still not sure why this slowdown though: looking at my /etc/config/uhttpd for my 15.05 build, it has the keepalive option at the default of 20 and the pages load instantly.
@jow Can you point me to where in the code the little circle "waiting" icon that says "Loading view" is displayed? I'd love to put in some debug code to track down what exactly is causing the blocking....
The blocking happens in uhttpd's state machine, leading to certain HTTP requests never get answered. You can easily trace that in the browser debug console.
After a little bit more testing, there are two problems: the one is the keepalive option which affects uhttpd and referenced at the beginning of this thread in the second reply.
The other problem of 3 second delays on some page loads on some pages is not uhttpd specific as it happens with a nginx backend as well.
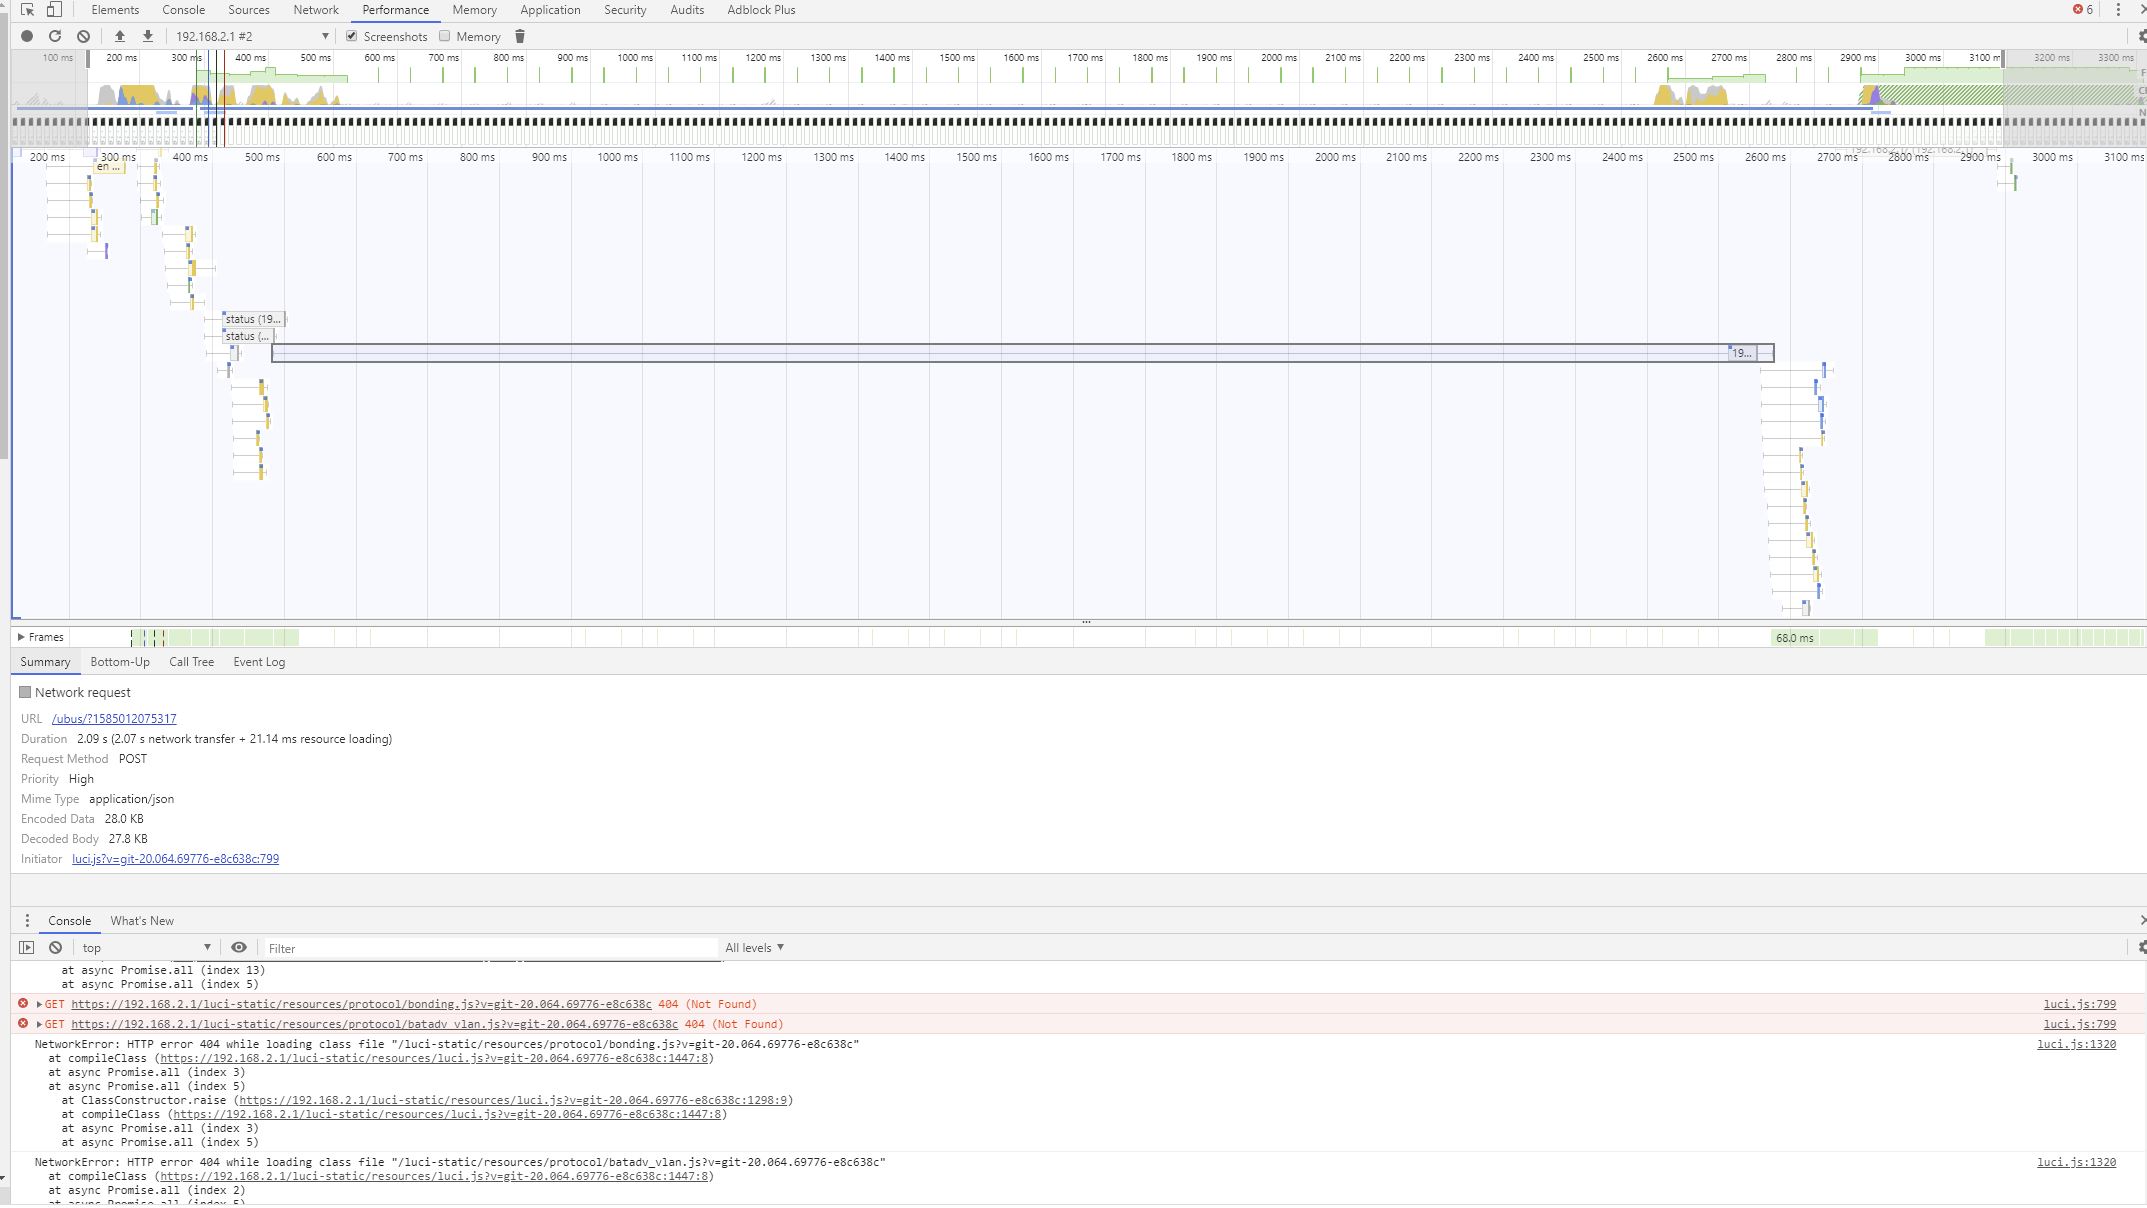
I used Chrome's performance tool to look at the timings while loading the main status overview page.
Luci tries to load several non-existent protocol .js scripts (batadv_vlan.js, for example), but these do not seem to be causing the slowdown as I created unmanaged stubs for them and still the page took the same time to load.
In one case, the blocking looks to be happening in the lua ubus shim, while in other cases it looks to be happening in some or all of the protocol .js scripts. It's not entirely consistent.
You can see the screenshot below where it shows the call to ubus idle for 2.07 seconds waiting on input (it's about double the wait when using uhttpd). The timer trigger in the lua code fires twice before it gets a reply (this is using nginx as the backend). In other cases, the ubus call returns quickly and some or all of the protocol .js scripts idle for ~2 seconds.
I exported the profiler output of multiple profile runs of this page load. You can find them here if you want to have a look at it. There's a lot of detail in it that might mean more to you than it does to me.
Just click on the Performance tab in chrome's Developer Tools and load the files using the up-arrow button.
Any suggestions on a possible debugging approach would be welcome...
Furthermore I suggest to deploy https://git.openwrt.org/052aaa7c965157ef058d168319d5e0874fabb0c8 as well to improve TLS performance with uhttpd and to install uhttpd-mod-ubus to bypass the Lua ubus shim (you need to close and reopen the LuCI tab to make it use the plugin).
What router are you testing on? On some older devices, the TLS handshake overhead is huge, adding significant delays when negotiating a new connection. Especially with chrome which always performs multiple simultaneous connection attempts.
That said, I have uhttpd-mod-ubus installed already.
And this is a big but, the profiler outputs I posted above are actually done against an nginx backend and not against uhttpd. I flipped to nginx to see if the second problem was uhttpd-specific, which it's apparently not, as it happens with nginx as well. uhttpd is just a bit slower by about a second and a half.
It's a custom built x86_64 running a 4-core 2.4Ghz Intel c2558 on a Supermicro board with 16GB of RAM and a data centre class SSD.
The Openwrt build is at the current openwrt-19.07 snapshot HEAD, commit 39405644d5b97796a633315e0ce7b65f8a1eb3ac