I am using an x86 system and I'd like to have a graph with a shorter timespan for ping, e.g. 10 minutes rather than one hour.
How can I achieve this?
I am using an x86 system and I'd like to have a graph with a shorter timespan for ping, e.g. 10 minutes rather than one hour.
How can I achieve this?
Are you talking about
Look into LuCI statistics settings for both:
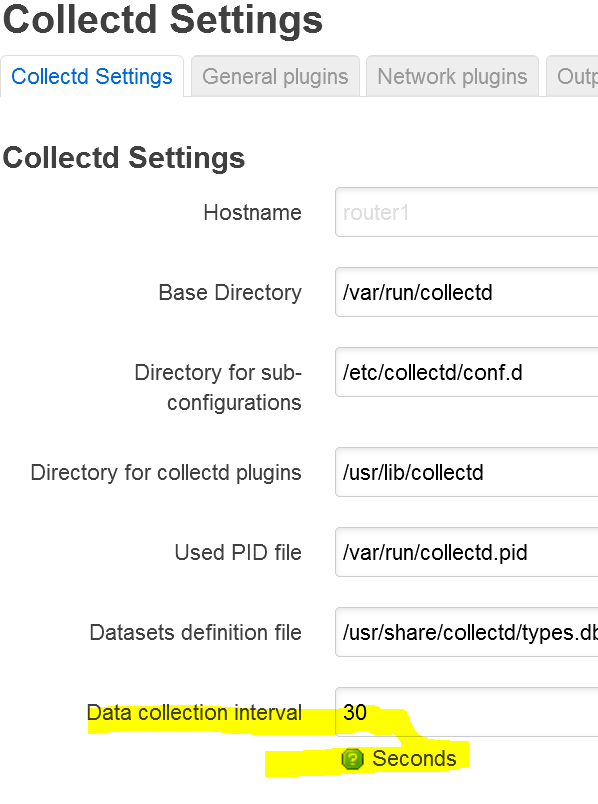
Collectd settings:
output / rrdtool:
All those values are stored in /etc/config/luci_statistics.
config statistics 'collectd'
        option BaseDir '/var/run/collectd'
        option Include '/etc/collectd/conf.d'
        option PIDFile '/var/run/collectd.pid'
        option PluginDir '/usr/lib/collectd'
        option TypesDB '/usr/share/collectd/types.db'
        option Interval '30'
        option ReadThreads '2'

config statistics 'rrdtool'
        option default_timespan '1hour'
        option image_width '600'
        option image_path '/tmp/rrdimg'

config statistics 'collectd_rrdtool'
        option enable '1'
        option DataDir '/tmp/rrd'
        option RRARows '144'
        option RRASingle '1'
        option RRATimespans '1hour 1day 1week 1month 1year'
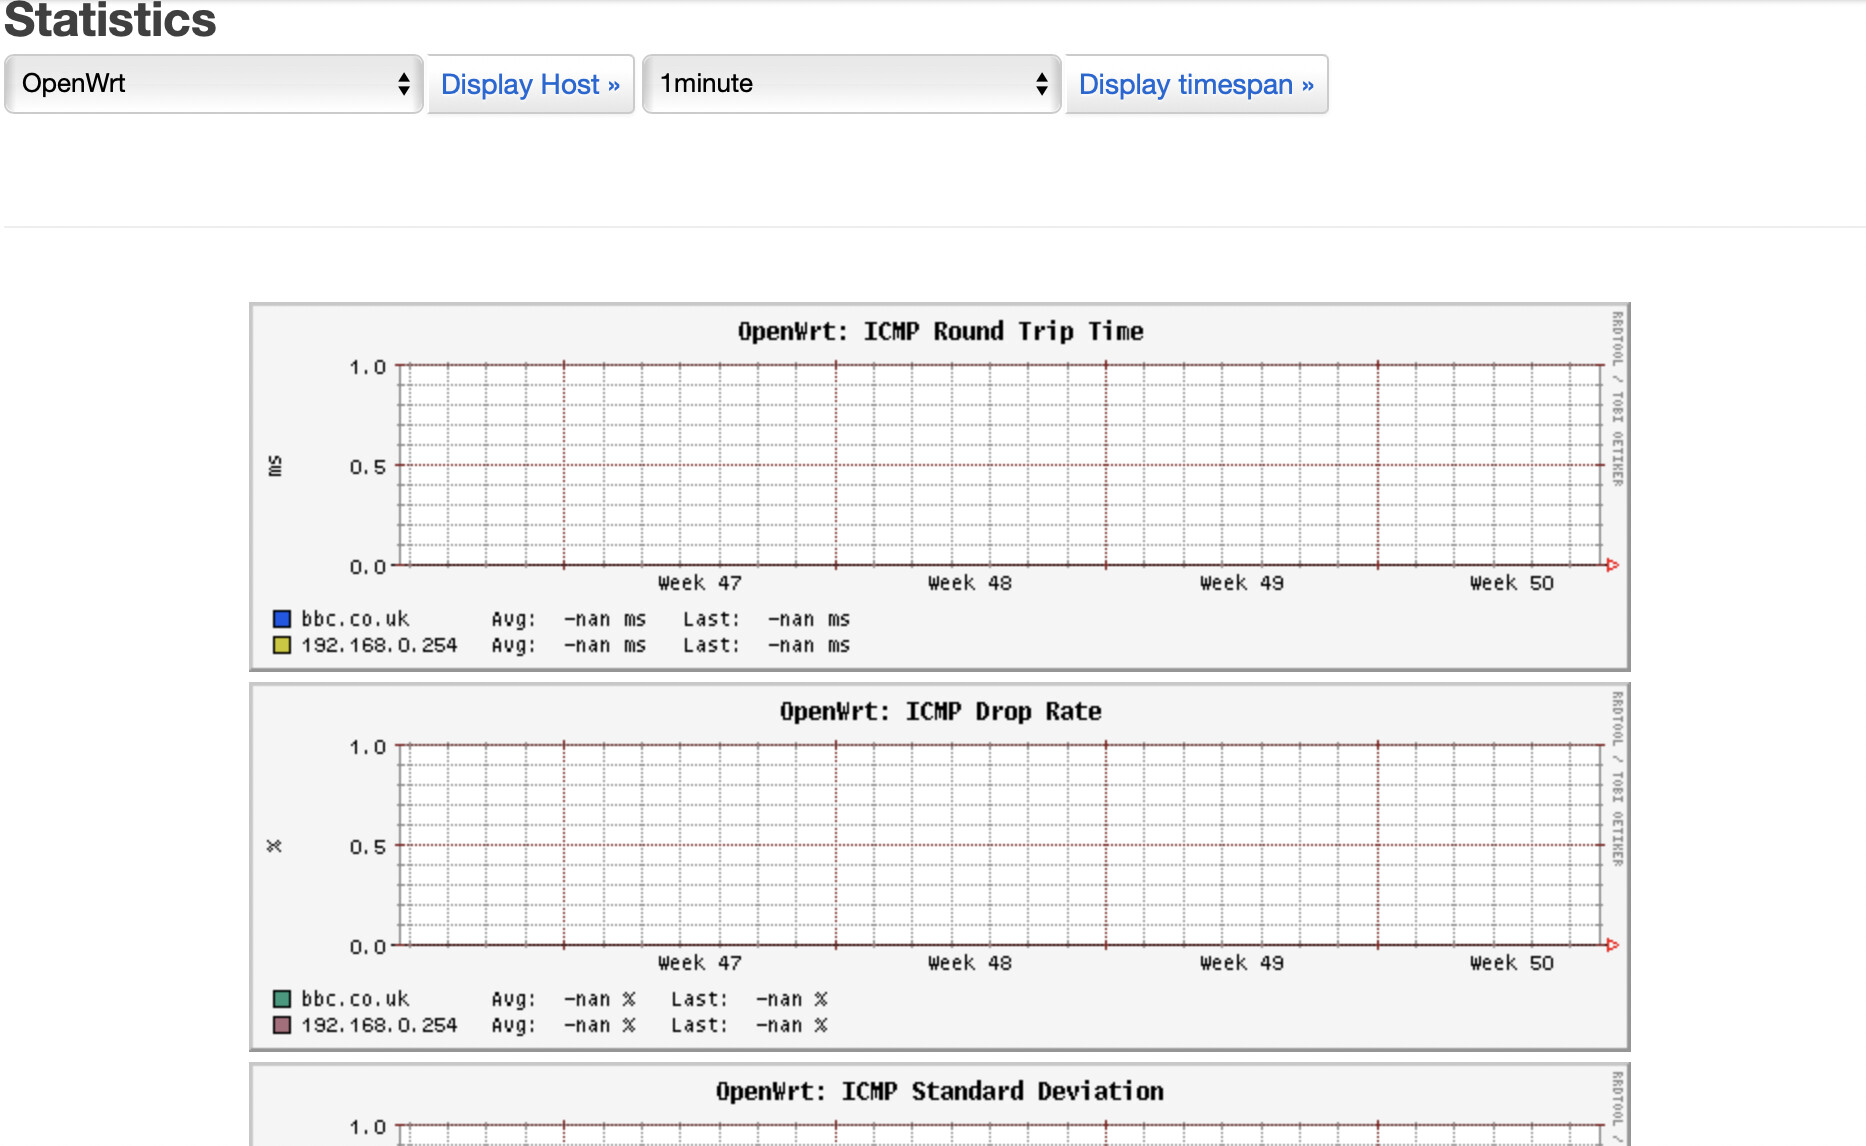
Well, there would only be 2 or 3 datapoints in 1 minute, right?
You should perhaps add something like 5minute to 10minute
And you may need to delete the data contents from /tmp/rrd, so that the database gets initialised empty.
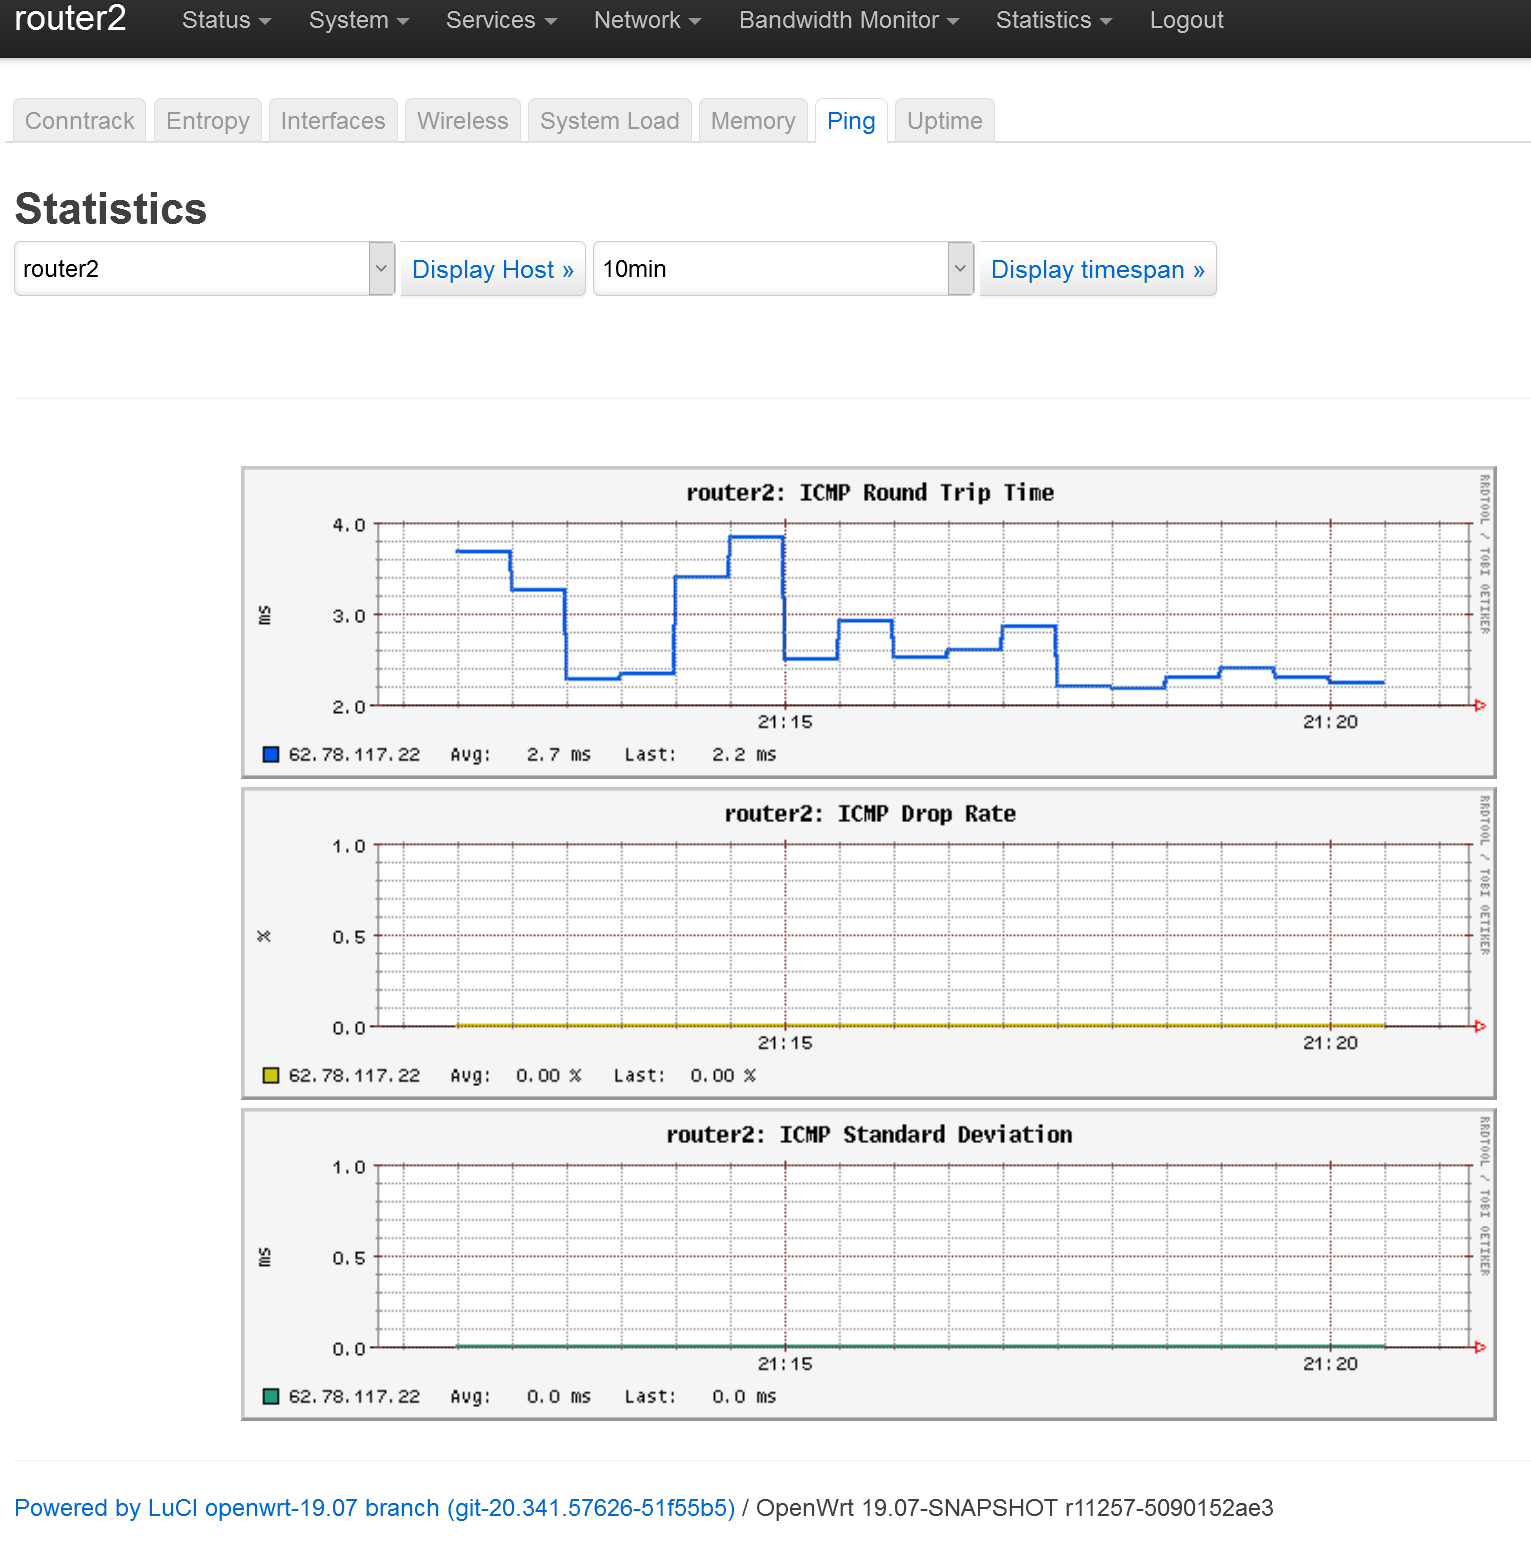
Works nicely for me:
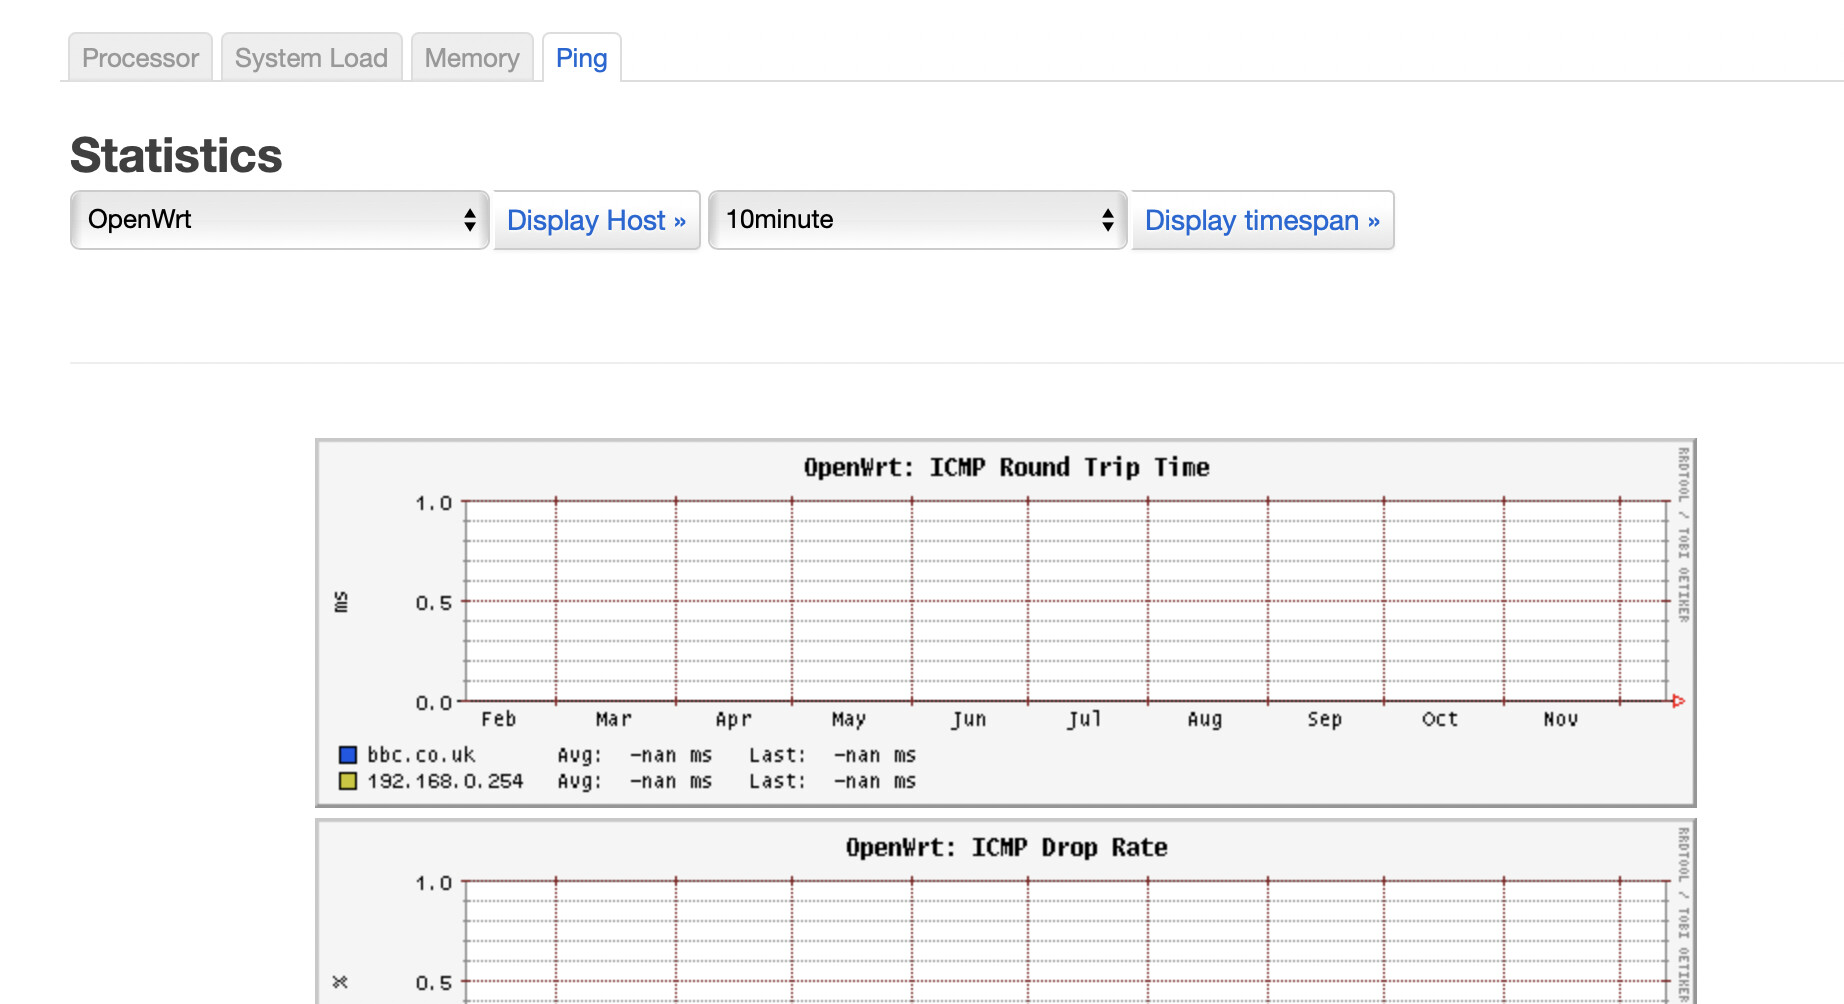
I added the 10minute interval as the first one (so that they are in proper length order.
(If you place it last, the systems tries to summarize data from "1year" to it. A separate data series is kept for each period, and then summarised up to the next level. I am not sure if the 10minute data series will decrease the accuracy of the 1hour data.)
config statistics 'collectd_rrdtool'
        option enable '1'
        option DataDir '/tmp/rrd'
        option RRASingle '1'
        option RRATimespans '10minute 1hour 1day 1week 1month 1year'
        option RRARows '144'
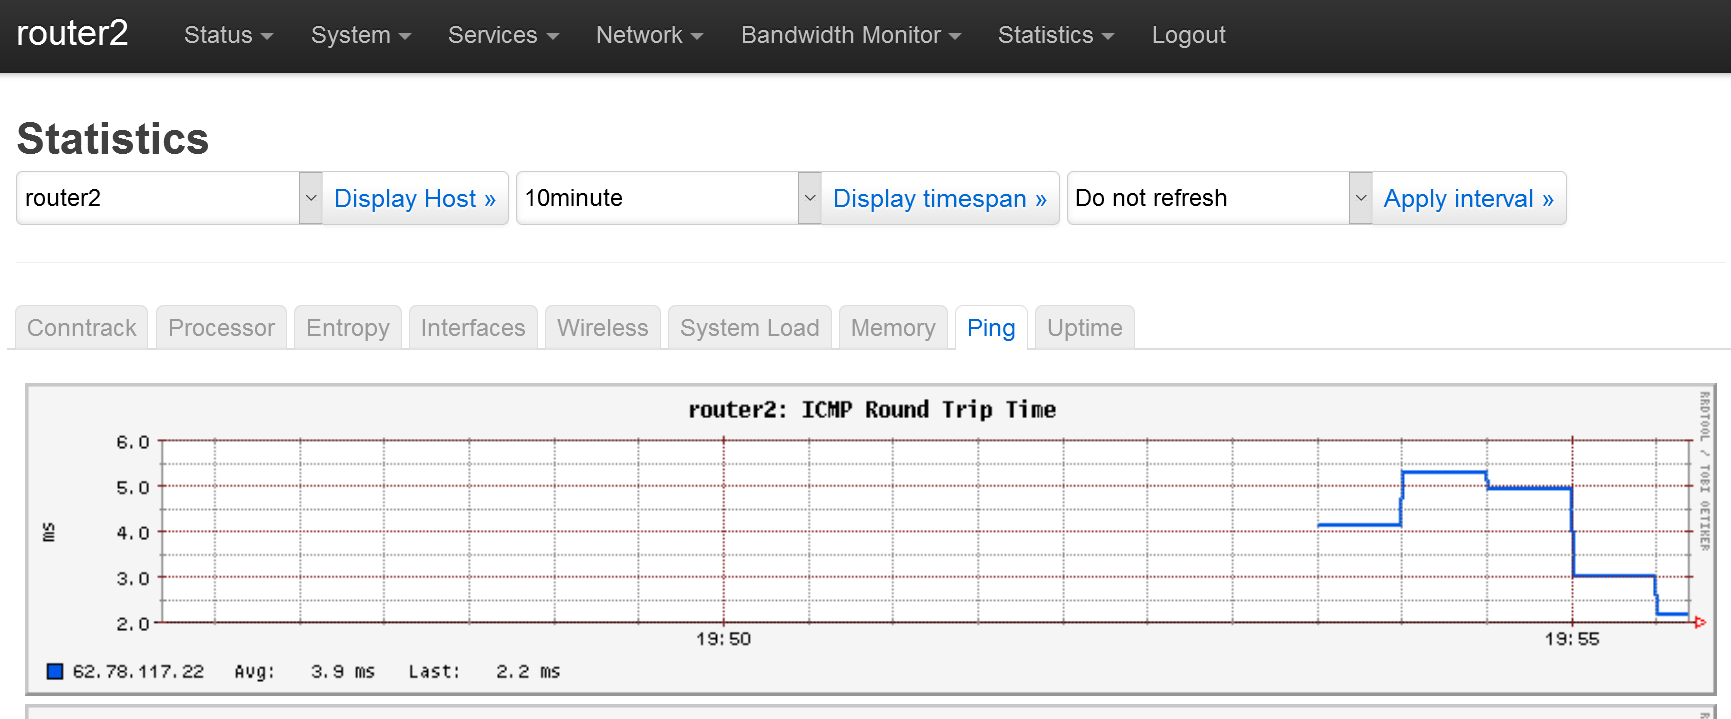
Hold up @hnyman your screen looks different to mine, I don't have "Do not refresh" option.
I am using 19.07.5, is this a trunk change? Perhaps I should update to that.
There should be no relevant difference between 19.07.5 and master.
collectd (the stats engine is almost identical). The charts are composed a bit differently (lua vs js), but that should not make any difference as the underlying dataengine and rrdtool is the same.
I think that you need to edit the config file,
recursively delete the contents of /tmp/rrd ( rm -rf /tmp/rrd ) and then
restart the luci_statistics service
@hnyman It's a bug on latest, works fine on trunk as you say but on 19.07.5 it shows up wrong unless I specify the times like so:
0.17hours for 10 minutes
Also @hnyman on trunk you can't specify host to ping by hostname anymore whereas you could on 19.07.5 (worked fine).
Graphs are overall working much better on trunk than 19.07.5, really very good! 
Apparently it needs to be "10min". Then it works in 19.07.x
"10minute" got interpreted wrong (something more than a year).
config statistics 'collectd_rrdtool'
        option enable '1'
        option DataDir '/tmp/rrd'
        option RRASingle '1'
        option RRATimespans '10min 1hour 1day 1week 1month 1year'
        option RRARows '144'
leads correctly to the underlying native collectd config.
LoadPlugin rrdtool
<Plugin rrdtool>
        DataDir "/tmp/rrd"
        RRARows 144
        RRASingle true
        RRATimespan 600
        RRATimespan 3600
        RRATimespan 86400
        RRATimespan 604800
        RRATimespan 2678400
        RRATimespan 31622400
</Plugin>
Also I had an issue on stable in the log, collectd.conf missing.
Also sometimes the graphs would just stop working, seems much more stable on trunk.
Looking at the 19.07 source code, it seems that "10minute" gets interpreted as "10 months".
Whole word "minute" does not match, then the first letter "m" is tested and is thought to be month.
Looks like my initial advice of "10minute" was just wrong 
Ps. I have no idea why it first worked in master, as the unit parsing code looks the same.
Hi again @hnyman, is it possible to have real-time ping monitor with graph?
This one is about a minute behind the live data.
Not quite real-time, but you can quite easily get "every 5 seconds"
Just change both the "ping interval" (in ping plugin config) and "data collection interval" (in general collectd settings) to 5 seconds. Also remember to delete everything from /tmp/rrd, as the scale change does otherwise not apply.
Note that the data collection interval also affects all other Luci statistics items, so the generated CPU load can be high. You might need to disable other plugins while you have that setting on.
If you want real-time ping monitoring, that is maybe best done directly from SSH console manually with ping command.
Hi, I changed those settings, ran a speed test and still saw no change to ping in the graphs for almost a minute afterwards.
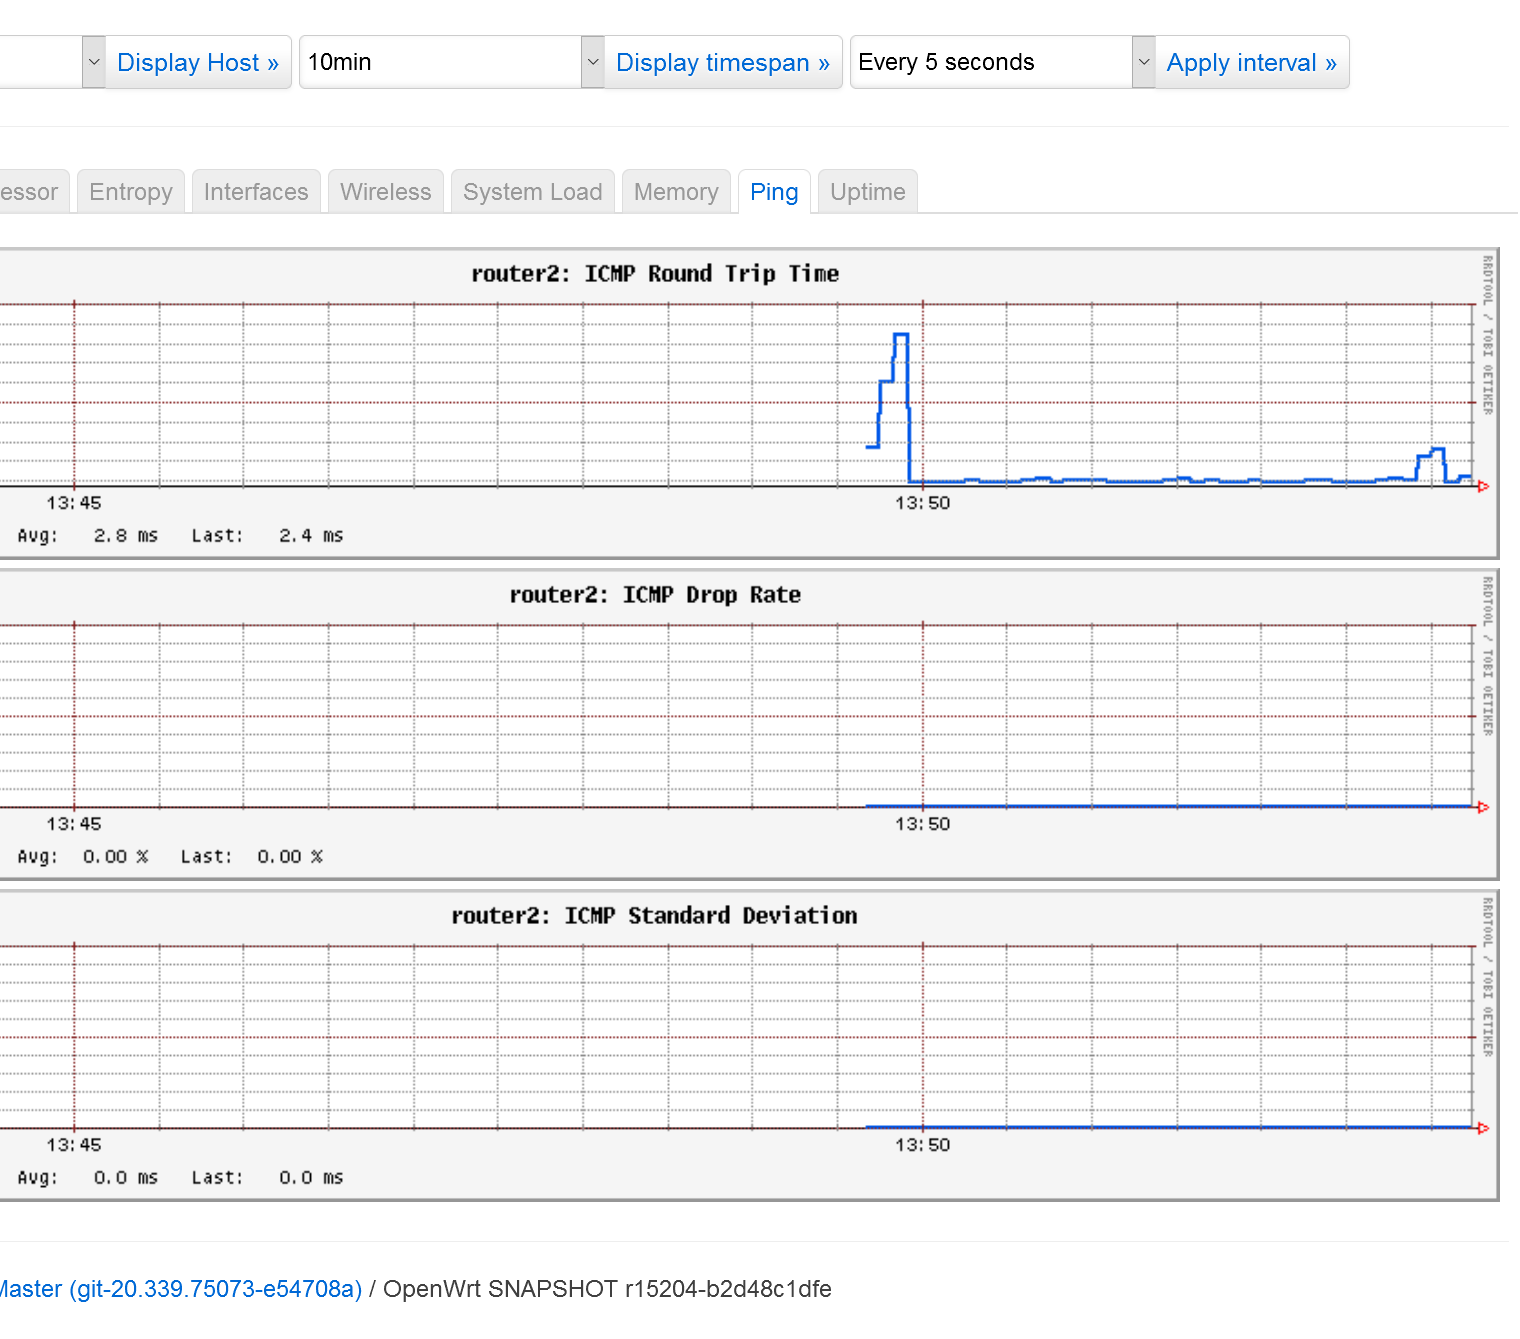
Works for me in master:
Ping every 5 seconds, and the auto-refresh works. The chart rolls automatically.
You need to be sure that you delete all files from /tmp/rrd while the service is stopped (so that do data update write is in transit).
I changed in config: ping / interval 5, generic / data collection 5 sec
And in SSH console shell:
/etc/init.d/luci_statistics stop
/etc/init.d/collectd stop
rm -rf /tmp/rrd
/etc/init.d/luci_statistics restart