Hi all,
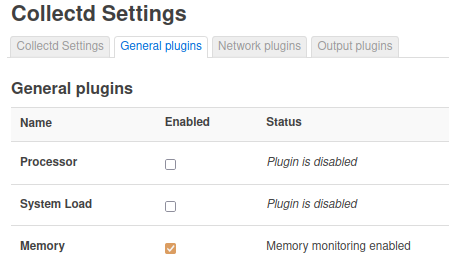
as per topic title, the Collectd Memory Plugin is enabled...
... but its tab under Statistics --> Graphs does not exist:
I have no error in System Log; OpenWrt is 21.02.1 r16325-88151b8303 / LuCI openwrt-21.02 branch git-21.357.58218-b3cd473, just performed a reboot to double check... anyone out there with the same issue?
Thanks in advance.
Updated to OpenWrt 21.02.2 r16495-bf0c965af0 / LuCI openwrt-21.02 branch git-22.052.50801-31a27f3 and found that:
the tab is shown if the Storage directory in RRFTool Plugin Configuration is set to /tmp/rrd (installation default)
the tab disappears if the Storage directory is set to /overlay/storage/rrd (overlay's an USB stick, /dev/sda1)
You may want to edit the title to note the plugin you're having issues with.
It seems I can't no longer edit the title... anyway I have issue with the pakage luci-app-statistics (Statistics --> Graph).
hnyman
March 14, 2022, 5:40am
5
So, the problem is with nonstandard database location...
The most peculiar thing is, that you only have trouble with one tab, memory statistics . Right?
Typical reason is that the storage location permissions is not set to readable by everyone. But that would affect all tabs, I think.
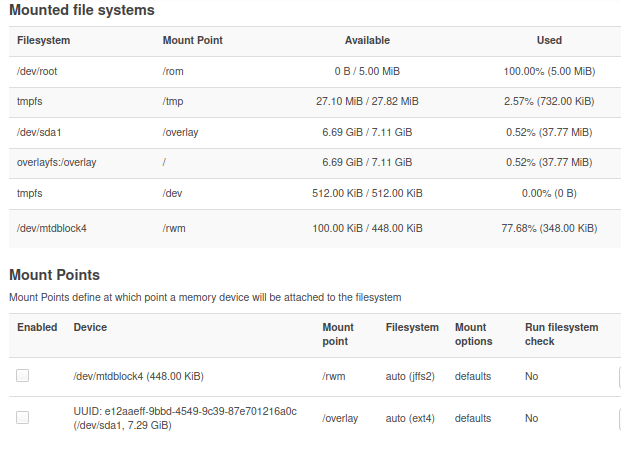
The mounted storage path overlay/ also looks strange. If you are using overlayfs, the mounted device should be mounted so that the device replaces some normal directories and overlay/ is not needed in access. (And if you don't use overlayfs, then using the path overlay/ is also confusing.)
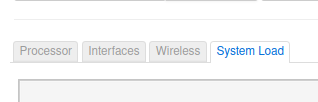
Ok, I'm officially confused... in this very moment Storage dir is set to /tmp/rrd and Memory tab is missing; I also confirm the other tabs processor , interfaces , wireless , and system load appears...
hnyman
March 15, 2022, 8:22pm
7
Then you should check if it is
data collection problem at collectd, or
display problem at Luci statistics.
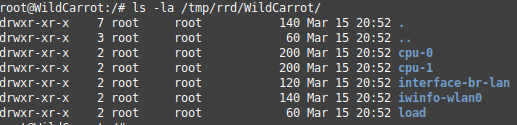
Does memory data get into the rrd database at /tmp/rrd ?
Uhmm... neither memory dir nor database where expected...
hnyman
March 15, 2022, 8:52pm
9
Ok, then it is about data collection, not about LuCI.
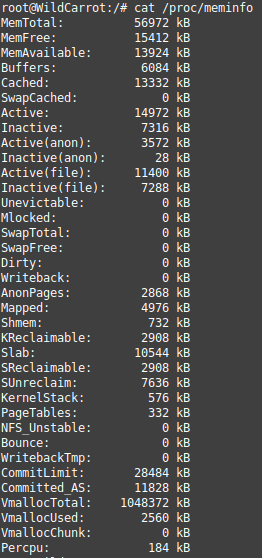
Collectd reads /proc/meminfo for memory stats.
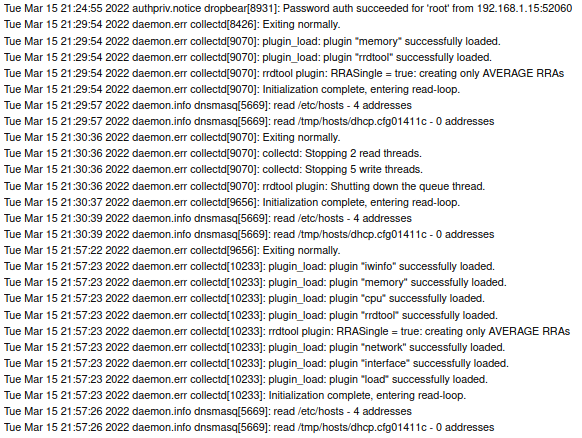
Are there any error messages from collectd in the system log.
(is there anything special in your system?)
Ps. I assume that you have rebooted the device at some point during the debugging.
Pps. example:
 OpenWrt SNAPSHOT, r19100-cca5367f27
 -----------------------------------------------------
root@router1:~# cat /proc/meminfo
MemTotal:         474156 kB
MemFree:          338784 kB
MemAvailable:     330516 kB
Buffers:              52 kB
Cached:            28832 kB
SwapCached:            0 kB
Active:            18780 kB
Inactive:          16628 kB
Active(anon):       2832 kB
Inactive(anon):     6844 kB
Active(file):      15948 kB
Inactive(file):     9784 kB
Unevictable:           0 kB
Mlocked:               0 kB
HighTotal:             0 kB
HighFree:              0 kB
LowTotal:         474156 kB
LowFree:          338784 kB
SwapTotal:             0 kB
SwapFree:              0 kB
Dirty:                 0 kB
Writeback:             0 kB
AnonPages:          6524 kB
Mapped:             6616 kB
Shmem:              3172 kB
KReclaimable:       6880 kB
Slab:              22908 kB
SReclaimable:       6880 kB
SUnreclaim:        16028 kB
KernelStack:         800 kB
PageTables:          548 kB
NFS_Unstable:          0 kB
Bounce:                0 kB
WritebackTmp:          0 kB
CommitLimit:      237076 kB
Committed_AS:      19968 kB
VmallocTotal:     540672 kB
VmallocUsed:       14820 kB
VmallocChunk:          0 kB
Percpu:              272 kB
/proc/meminfo almost ok
System Log as follows:
Special things... it's a dumb AP; "custom" image created with imagebuilder; extroot up & running:
Maybe got the issue solved.
Took inspiration from 19.07.0, luci-app-statistics, memory module not working anymore - #2 by hnyman I checked my config with uci export luci_statistics ; I found:
config statistics 'collectd_memory'
Edited /etc/config/luci_statistics to add the following three lines:
config statistics 'collectd_memory'
        option enable '0'
        option ValuesAbsolute '1'
        option ValuesPercentage '0'
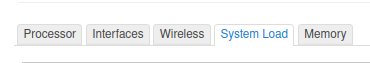
Enabled the plugin via Luci and then the Memory tab missed appeared. So I rebooted and checked uci export luci_statistics before enabling the plugin:
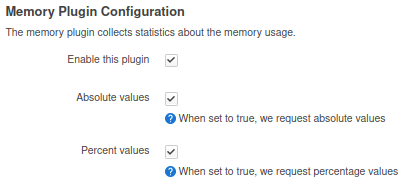
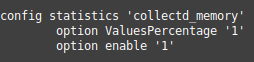
Then I enabled it via Luci and the Memory tab appeared. Unexpectedly Luci and “command line” say two different things. Luci shows:
Instead, uci export luci_statistics says:
Conclusions:
I think the original config missed something
It seems that Luci interface and “command line” react differently
Editing settings via command line solves, that is the Memory tab is no longer missing.
Last but not least, I have the statistics. Next step would be moving data storage from /tmp/rrd to extroot...
system
March 26, 2022, 9:43pm
12
This topic was automatically closed 10 days after the last reply. New replies are no longer allowed.