Doesn't seem that much to me.
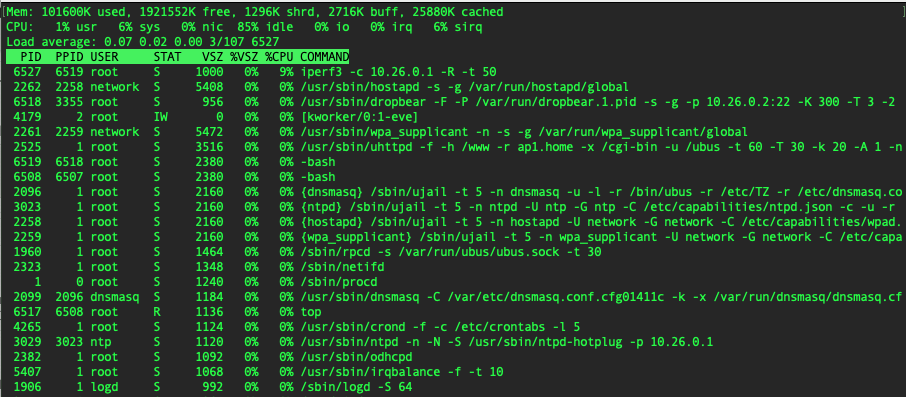
85% idle on a four core CPU can mean anything from each CPU itself loaded 15% or a single CPU loaded 60%. Even that would not be alarming, but it illustrates that top's aggreage single load percentage is not the best tool to detect/diagnose issues that might be caused by overload of individual CPUs.
No, definitely it's not the IRQ or SIRQ. I have run out of ideas.
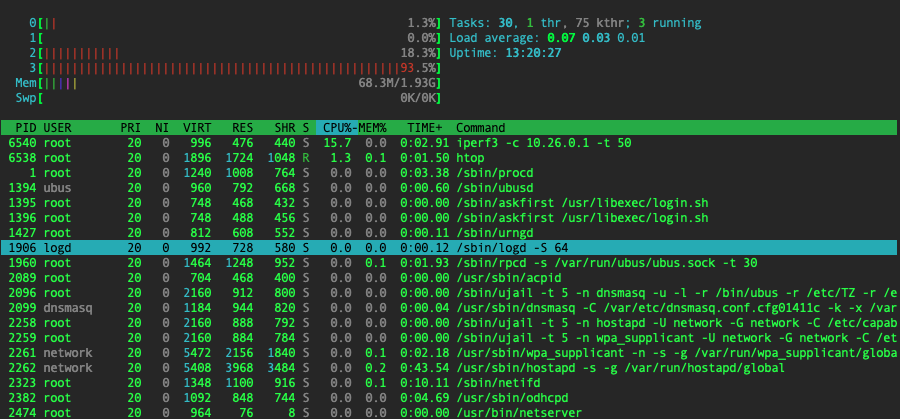
I already told in the first post that individual, single core usage never goes over 30% when receiving data.
I would love to see 100% usage on a single core because that gives 900 MBits/sec when iperf data is sent to server.
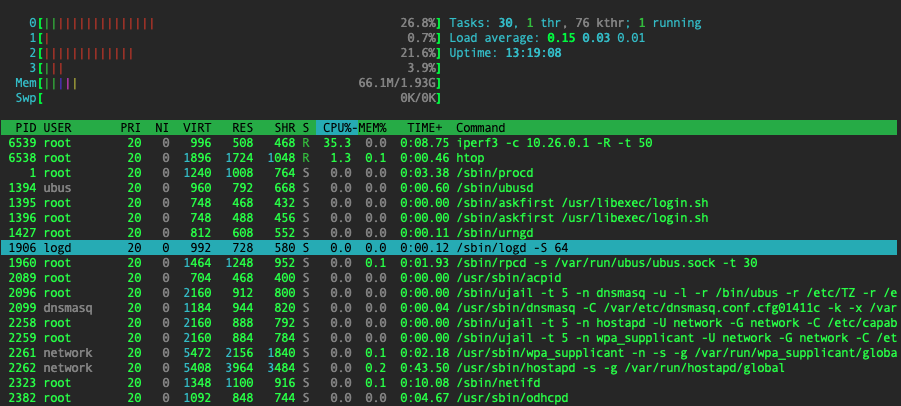
htop screenshots with
iperf sending
iperf receiving
Well, what are alternatives to iperf3? it seems this tool is dominating testing space, but I already have run into a bug with and old version of iperf3 that was distributed with Debian 9.
Iperf 2.3.8-rc1 and bufferbloat testing - #4 by frollic might be useful
TLDR; try iperf instead of iperf3
1 Like
Same result, unfortunately.
root@ap1:~# iperf -c 10.26.0.1
------------------------------------------------------------
Client connecting to 10.26.0.1, TCP port 5001
TCP window size: 85.0 KByte (default)
------------------------------------------------------------
[  1] local 10.26.0.2 port 58958 connected with 10.26.0.1 port 5001
[ ID] Interval       Transfer     Bandwidth
[  1] 0.00-10.05 sec  1.07 GBytes   913 Mbits/sec
root@ap1:~# iperf -c 10.26.0.1 -R
------------------------------------------------------------
Client connecting to 10.26.0.1, TCP port 5001
TCP window size: 85.0 KByte (default)
------------------------------------------------------------
[  1] local 10.26.0.2 port 35238 connected with 10.26.0.1 port 5001 (reverse)
[ ID] Interval       Transfer     Bandwidth
[ *1] 0.00-10.01 sec   381 MBytes   320 Mbits/sec
Are you running iperf on the APU? That is a meanigful test, albeit not a test of the APUs capabilities as router, for that you are better off with moving iperf server and client to different computers (just make sure these devices are not directly connected by a switch).
Yes you did, this is why I was surprised to see simple top output with one aggregate CPU line.
For htop you can and should enable detailed reporting for the CPU bars so you can see sirq immediately (can be done somewhere in the configuration). I expect this not to change the picture but it will give a better feel where the CPU spends its time.
I booted system rescue CD and got somewhat opposite results.
Now sending is slower than receiving, which goes at almost full wire speed.
I also ensured the interface used is the same in both OpenWRT and SystemRescue.
So it is clearly something in the OS, but it is not clear what exactly.
[root@sysrescue ~]# iperf3 -c 10.26.0.1
...
- - - - - - - - - - - - - - - - - - - - - - - - -
[ ID] Interval           Transfer     Bitrate         Retr
[  5]   0.00-10.00  sec   714 MBytes   599 Mbits/sec    0             sender
[  5]   0.00-10.00  sec   712 MBytes   597 Mbits/sec                  receiver

[root@sysrescue ~]# iperf3 -c 10.26.0.1 -R
...
- - - - - - - - - - - - - - - - - - - - - - - - -
[ ID] Interval           Transfer     Bitrate         Retr
[  5]   0.00-10.00  sec  1.09 GBytes   940 Mbits/sec   19             sender
[  5]   0.00-10.00  sec  1.09 GBytes   939 Mbits/sec                  receiver
Well, I found what is the problem here - a BIOS setting caused this issue.
"PCIe power management features" - when enabled, causes significant throughput reduction, not only for wired, but for wireless transmission as well.
Not sure if this is a bug or a feature, but - DO NOT enable it!

2 Likes
how did you find the solution ?? I would never have thought of going to see in the bios.
I actually started with going back to old BIOS'es, because I had run out of ideas, but at the same time I sort of remembered that I've seen better throughput.
And old BIOSes did not show the problem, so I was determined to find which BIOS did introduce it until I found that it's not actually the BIOS itself, but a setting in it ![]()
It should be noted that for APU2, BIOS upgrade causes customizations to be reset to default values, it did help a little, too ![]()
2 Likes
u PCIe power management features- enables/disables PCI Express power management features like: ASPM, Common Clock, Clock Power Management (if supported by PCI Express endpoints). Enabling this option will reduce the power consumption at the cost of performance drop of Ethenet controllers and WiFi cards
ho yes !
how did you get into the APU2 bios via minicom? I tried disabling macros in minicom and using F10 and minicom seems not to pass the F10 through to serial or coreboot isn't responding to it.
My hardware is an APU2 but the bios saysduring boot:
PC Engines apu1
coreboot build 20183108
BIOS version v4.8.0.3
I had an apu1, but there was no issue to get into bios, I think it actually prompted you to press tab or ins (?).
You might also consider upgrading the bios.
I thought i remembered a prompt too but I'm not seeing it in minicom anymore. Your thread prompted me to want to check my bios setting. Turns out I'm really just on an apu1, had to go check my invoice: https://www.pcengines.ch/apu1d4.htm So I think I got a special firmware release from the pcegines guys because they list 2014 as the latest but my serial port shows 2018. i recall reporting a boot bug if certain usb storage was attached years ago.
Do you think it's worth trying to download or compile something from their https://pcengines.github.io/#mr-61 ?
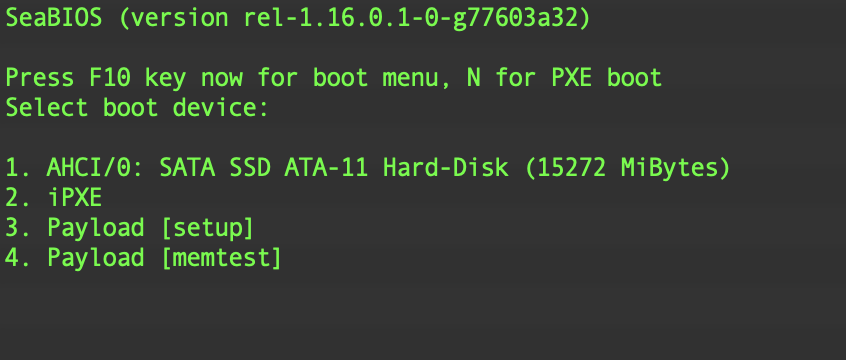
If it says apu1, it probably is apu1. Anyway, nothing special for apu2, just F10 at boot as indicated in console screen,
I turned on logging in minicom and did a reboot:
[20194.629295] usb 1-1: reset high-speed USB device number 2 using ehci-pci
[20194.767429] usb 4-5: USB disconnect, device number 2
[20194.772857] Restarting system.
[20194.775933] reboot: machine restart
PC Engines apu1
coreboot build 20183108
BIOS version v4.8.0.3
Use the ^ and v keys to change the selection.
      Press 'e' to edit the selected item, or 'c' for a command prompt.          CentOS Linux (3.10.0-1160.76.1.el7.x86_64) 7 (Core)                            CentOS Linux (3.10.0-1160.71.1.el7.x86_64) 7 (Core)                            CentOS Linux (0-rescue-2b0818b28eae482bbf04a7448a9ff4f6) 7 (Core)
So I don't see anything about seabios or press F10. (Though, I was certainly pressing it during reboot) I went on to test what f-10 "looked like" to the APU:
         Starting Terminate Plymouth Boot Screen...
[  OK  ] Started Command Scheduler.
         Starting Wait for Plymouth Boot Screen to Quit...

CentOS Linux 7 (Core)
Kernel 3.10.0-1160.76.1.el7.x86_64 on an x86_64
GW-Primary login: root
Password:
Last login: Thu Sep 15 13:06:39 from randomhostnamehere
[root@GW-Primary ~]# 5 f-10;s is ^G~^G~^G~^G~^G~^G^H
[root@GW-Primary ~]# logout

CentOS Linux 7 (Core)
Kernel 3.10.0-1160.76.1.el7.x86_64 on an x86_64

GW-Primary login:
confirmed I really was on an apu1. 4.17.0.2 installed via flashrom without a hitch though. And now I do see the press f10 prompt and it works as expected!
flashrom -r 20220915-backup-before-updating.rom -V -p internal -c "MX25L1605A/MX25L1606E/MX25L1608E"
flashrom -w apu1_v4.17.0.2.rom -V -p internal -c "MX25L1605A/MX25L1606E/MX25L1608E"
reboot
Thanks for the prodding to update bios! I did have to re-config the boot order after update but that was expected too.