Hi Guys
recently moved installed luci-app-statistics package to monitor hardware behavior on my router. It works fine except one little thing.
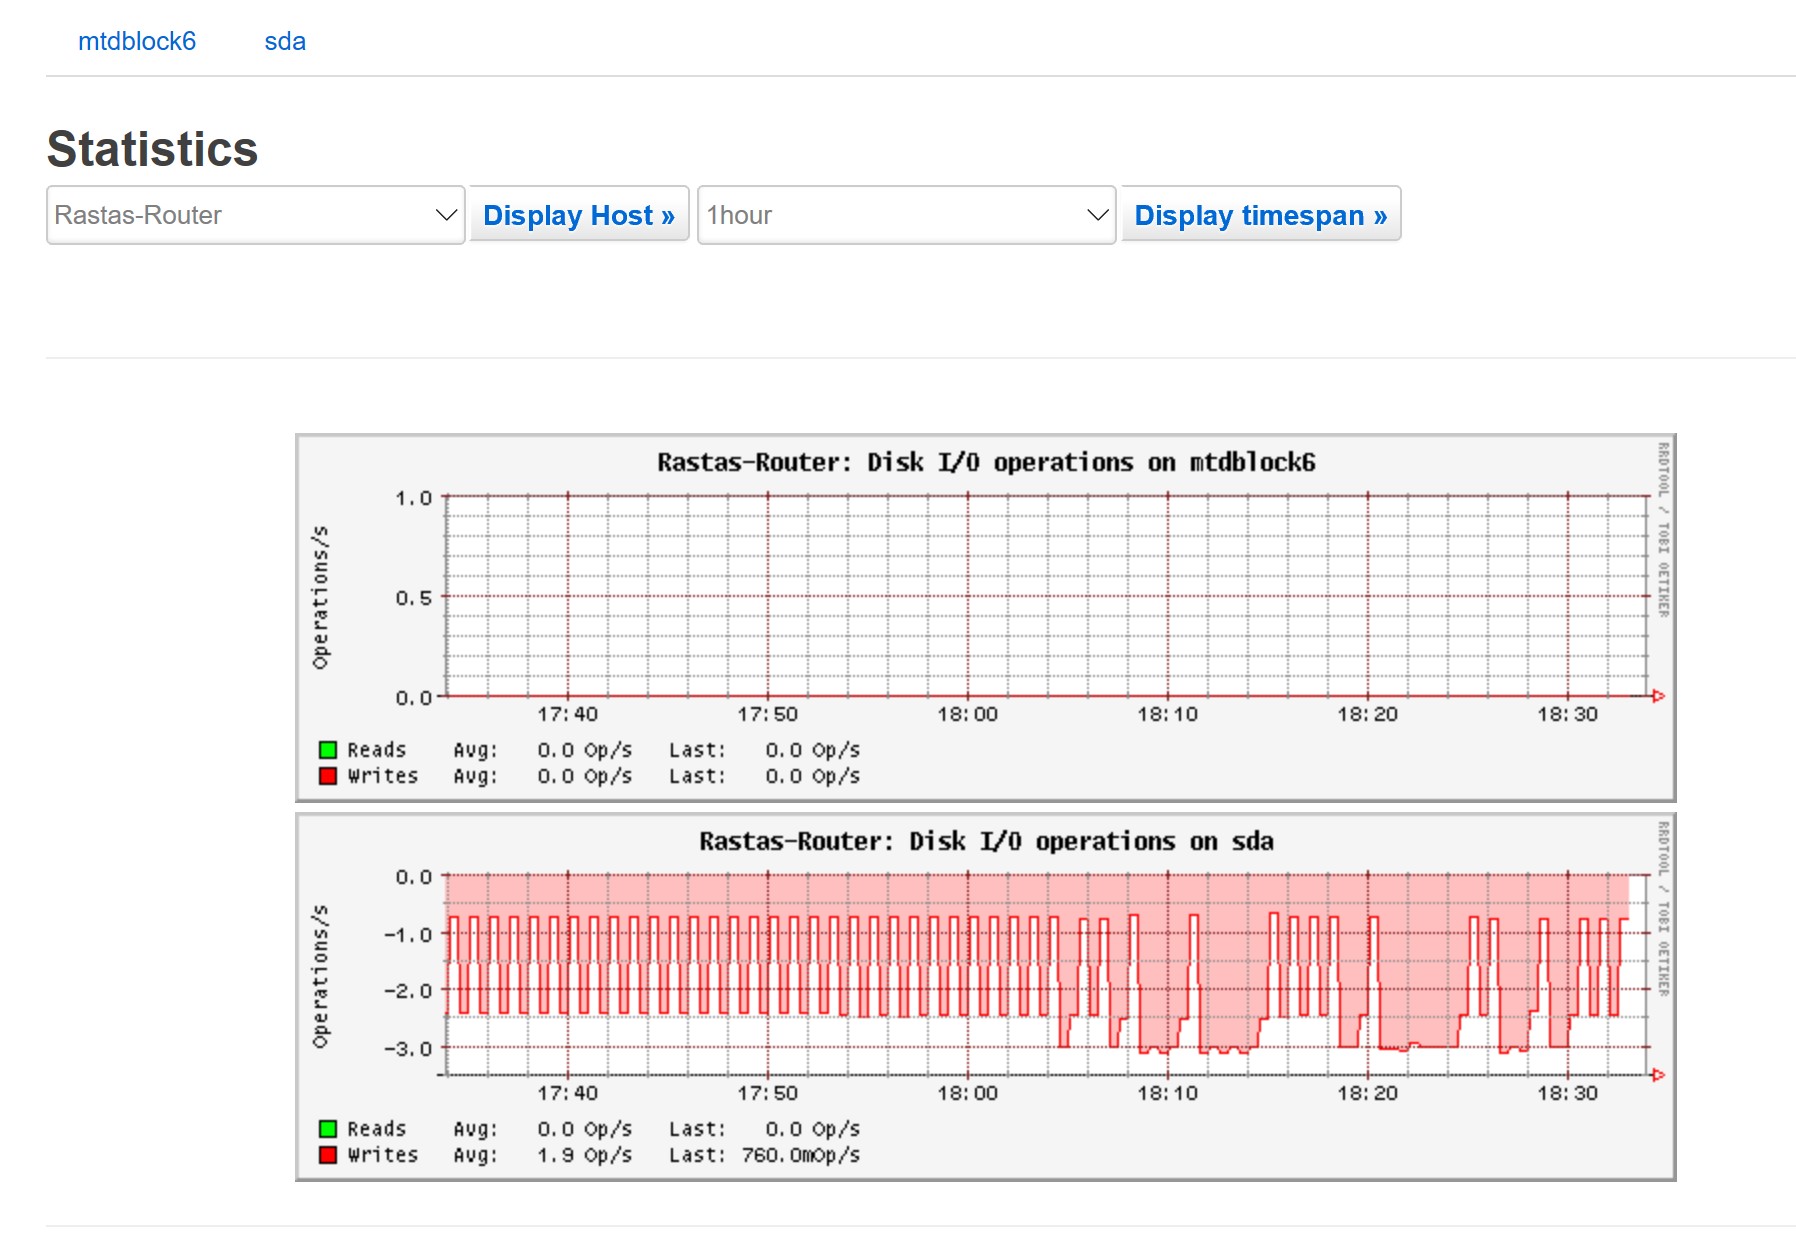
The problem is with disk usage (not disk space usage) plugin which allows you to monitor writes and reads on your disk. It work nice with my USB drive attached but not with internal memory which i guess is the overlay one. mtdblock6 which in my understanding should be the overlay device show 0 operations on read and write. For test i tried to copy small file to / directory then i did sync command but still no operations were detected/
Here is the df -h command from my router:
Filesystem                Size      Used Available Use% Mounted on
/dev/root                 2.5M      2.5M         0 100% /rom
tmpfs                   250.7M      1.1M    249.6M   0% /tmp
/dev/mtdblock6           11.5M      3.8M      7.7M  33% /overlay
overlayfs:/overlay       11.5M      3.8M      7.7M  33% /
tmpfs                   512.0K         0    512.0K   0% /dev
/dev/sda                  3.6G     15.9M      3.4G   0% /mnt/usb
Here is screenshot of the graphs showing no operations on mtdblock6 device:
Here is /etc/config/luci_statistics config file:
config statistics 'collectd'
        option BaseDir '/var/run/collectd'
        option Include '/etc/collectd/conf.d'
        option PIDFile '/var/run/collectd.pid'
        option PluginDir '/usr/lib/collectd'
        option TypesDB '/mnt/usb/collectd/types.db'
        option Interval '30'
        option ReadThreads '2'

config statistics 'rrdtool'
        option default_timespan '1hour'
        option image_width '600'
        option image_path '/mnt/usb/rrdimg'

config statistics 'collectd_rrdtool'
        option enable '1'
        option DataDir '/mnt/usb/rrd'
        option RRARows '100'
        option RRASingle '1'
        option RRATimespans '1hour 1day 1week 1month 1year'

config statistics 'collectd_csv'
        option enable '0'
        option StoreRates '0'
        option DataDir '/tmp'

config statistics 'collectd_email'
        option enable '0'
        option SocketFile '/var/run/collectd/email.sock'
        option SocketGroup 'nogroup'

config statistics 'collectd_logfile'
        option enable '0'
        option LogLevel 'notice'
        option File '/var/log/collectd.log'
        option Timestamp '1'

config statistics 'collectd_network'
        option enable '0'

config statistics 'collectd_unixsock'
        option enable '0'
        option SocketFile '/var/run/collectd/query.sock'
        option SocketGroup 'nogroup'

config statistics 'collectd_apcups'
        option enable '0'
        option Host 'localhost'
        option Port '3551'

config statistics 'collectd_conntrack'
        option enable '0'

config statistics 'collectd_contextswitch'
        option enable '0'

config statistics 'collectd_cpu'
        option enable '1'

config statistics 'collectd_cpufreq'
        option enable '0'

config statistics 'collectd_df'
        option enable '1'
        option IgnoreSelected '0'
        option MountPoints '/overlay /mnt/usb'

config statistics 'collectd_disk'
        option enable '1'
        option Disks 'mtdblock6 sda'
        option IgnoreSelected '0'

config statistics 'collectd_dns'
        option enable '0'
        option Interfaces 'br-lan'
        option IgnoreSources '127.0.0.1'

config statistics 'collectd_entropy'
        option enable '0'

config statistics 'collectd_exec'
        option enable '0'

config statistics 'collectd_interface'
        option enable '1'
        option IgnoreSelected '0'
        option Interfaces 'br-lan eth0.1 eth0.2 wlan0 wlan1'

config statistics 'collectd_iptables'
        option enable '0'

config collectd_iptables_match
        option table 'nat'
        option chain 'luci_fw_postrouting'
        option target 'MASQUERADE'
        option source '192.168.1.0/24'
        option outputif 'br-ff'
        option name 'LAN-Clients traffic'

config collectd_iptables_match
        option chain 'luci_fw_postrouting'
        option table 'nat'
        option target 'MASQUERADE'
        option source '10.61.230.0/24'
        option outputif 'br-ff'
        option name 'WLAN-Clients traffic'

config statistics 'collectd_irq'
        option enable '0'
        option Irqs '2 3 4 7'

config statistics 'collectd_iwinfo'
        option enable '1'

config statistics 'collectd_load'
        option enable '1'

config statistics 'collectd_memory'
        option enable '1'

config statistics 'collectd_netlink'
        option enable '0'
        option IgnoreSelected '0'
        option VerboseInterfaces 'br-lan'
        option QDiscs 'br-lan'

config statistics 'collectd_nut'
        option enable '0'
        option UPS 'myupsname'

config statistics 'collectd_olsrd'
        option enable '0'
        option Port '2006'
        option Host '127.0.0.1'

config statistics 'collectd_ping'
        option enable '0'
        option TTL '127'
        option Interval '30'
        option Hosts '127.0.0.1'

config statistics 'collectd_processes'
        option enable '0'
        option Processes 'uhttpd dnsmasq dropbear'

config statistics 'collectd_sensors'
        option enable '0'

config statistics 'collectd_splash_leases'
        option enable '0'

config statistics 'collectd_tcpconns'
        option enable '0'
        option ListeningPorts '0'
        option LocalPorts '22 80'

config statistics 'collectd_thermal'
        option enable '0'
        option IgnoreSelected '0'

config statistics 'collectd_uptime'
        option enable '1'
Anybody has a clue how to monitor internal disk of my router so i could see read and writes on overlay memory?
Thank you.