julia> wget https://raw.githubusercontent.com/dlakelan/routerperf/master/juliapingplot.jl
ERROR: syntax: extra token "https" after end of expression
Stacktrace:
 [1] top-level scope
   @ none:1
not on julia prompt, but rather at shell (before you run julia).... or in julia you can type ";" character and it will put you temporarily in the shell... you can run it, and then at the prompt type the backspace and you leave the shell and back to julia.
julia> using Pkg

julia> Pkg.activate(".")
  Activating environment at `~/Project.toml`
rames"
julia> #Pkg.add(["DataFrames","StatsPlots","CSV"])

julia> include("juliapingplot.jl")
  Activating environment at `~/Project.toml`
ERROR: LoadError: ArgumentError: Package DataFrames not found in current path:
- Run `import Pkg; Pkg.add("DataFrames")` to install the DataFrames package.

Stacktrace:
 [1] require(into::Module, mod::Symbol)
   @ Base ./loading.jl:893
 [2] include(fname::String)
   @ Base.MainInclude ./client.jl:444
 [3] top-level scope
   @ REPL[5]:1
in expression starting at /home/roby/juliapingplot.jl:5
remove the # character from this the first time you run
julia> include("juliapingplot.jl")
  Activating environment at `~/Project.toml`
ERROR: LoadError: IOError: could not spawn `traceroute -n -w 0.5 www.google.com`: no such file or directory (ENOENT)
Stacktrace:
hmmm seems like you don't have traceroute installed, should also check you've got ping installed.
need to install with ubuntu or julia ?
in ubuntu. Julia just uses the command line traceroute program.
julia> include("juliapingplot.jl")
  Activating environment at `~/Project.toml`
0×0 DataFrame

julia>

i dont have error, but what happened ? need to wait somethings now ?
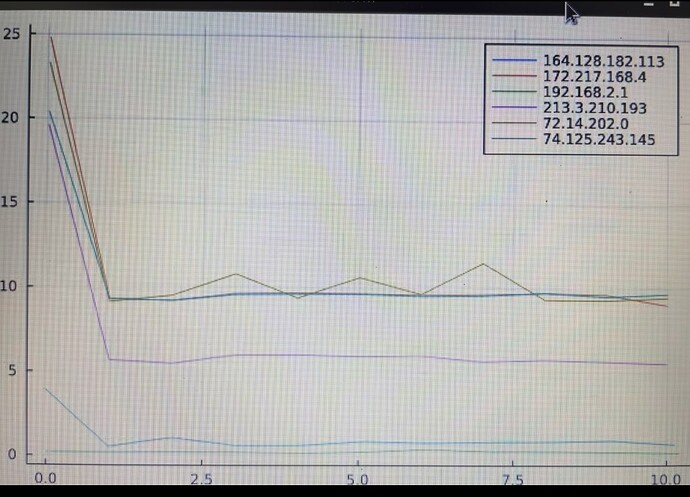
Yes, it should open a window and show pings through time. You can run speed tests and see how pings change etc
Here is example plot
could not connect to display, need pkg ?
julia> include("juliapingplot.jl")
Activating environment at ~/Project.toml
qt.qpa.xcb: could not connect to display
qt.qpa.plugin: Could not load the Qt platform plugin "xcb" in "" even though it was found.
This application failed to start because no Qt platform plugin could be initialized. Reinstalling the application may fix this problem.
Available platform plugins are: linuxfb, minimal, offscreen, vnc, xcb.
Aborted
connect: Connection refused
GKS: can't connect to GKS socket application
Try running it again every so often it seems like there is issue with plot window
Also try
] build StatsPlots
Notice the ]
2 days trying to install ubuntu under wsl version 1 and 2, trying Julia 1.5-1.6-1.7 still getting error messages .. I don't know if the cause is not having a real Linux kernel. I dunno .. I guess it takes 48 seconds to do this and I don't get there in 48 hours ..

I'm sorry to hear that. It really should work, but I'm thinking maybe your Ubuntu install is missing things that are expected by the Julia plotting library. There are other "backends" for plotting, but it might be best if we can convince someone who knows more about debugging this stuff to try it out. Division of labor and all that. There's no reason for you to become a linux-in-windows developer.
I believe the original WSL (now WSL1) was documented to have issues with network tools, so maybe an update to WSL2 could potentially fix it.
@segal_72 : the simple test is to run traceroute -n -w 0.5 www.google.com from a commandshell inside WSL
@dlakelan
I installed a version of Linux in dual boot on Window, I installed everything, I was able to launch the project and I was able to either finally a graphic .. I subsequently replaced Google with an ip server, unfortunately nothing works .. I put Google back and it doesn't work either ..
@dlakelan
daniel, I finally managed to get your project to work, when I enter an address all the ip's are not displayed on the graph, is this normal? by making a route with pingplotter I see for example 10 hops .. but the project shows 6.
$ traceroute 213.163.73.224
traceroute to 213.163.73.224 (213.163.73.224), 30 hops max, 60 byte packets
 1  OpenWrt.lan (192.168.2.1)  0.499 ms  0.525 ms  0.506 ms
 2  113.182.128.164.static.wline.lns.ent.cust.swisscom.ch (--------------------)  1.220 ms  1.283 ms  1.679 ms
 3  213.3.210.193 (213.3.210.193)  7.009 ms  7.216 ms  7.201 ms
 4  * * *
 5  i69lss-015-ae1.bb.ip-plus.net (193.134.95.122)  29.253 ms  29.238 ms  29.222 ms
 6  i64bei-005-ae0.bb.ip-plus.net (138.187.129.109)  13.300 ms  11.044 ms  11.005 ms
 7  i73olt-005-ae0.bb.ip-plus.net (138.187.129.246)  10.980 ms  9.759 ms  10.189 ms
 8  i62bsg-005-ae6.bb.ip-plus.net (138.187.130.7)  11.285 ms  10.170 ms  10.129 ms
 9  i62bsw-015-ae11.bb.ip-plus.net (138.187.130.223)  10.665 ms  10.927 ms  10.909 ms
10  i00ams-005-hun1-1-5.bb.ip-plus.net (138.187.129.199)  20.779 ms  20.764 ms  20.749 ms
11  185.1.94.39 (185.1.94.39)  21.035 ms  24.373 ms  24.358 ms
12  nlrtm1-rt001i.i3d.net (109.200.218.72)  28.946 ms  28.931 ms  26.658 ms
13  * * *
14  * * *
15  * * *
16  * * *
17  * * *
18  * * *
19  * * *
20  * * *
21  * * *
22  * * *
23  * * *
24  * * *
25  * * *
26  * * *
27  * * *
28  * * *
29  * * *
30  * * *
 Row │ time       dest             seq        ms
     │ Float64    SubStrin…        SubStrin…  Float64
─────┼────────────────────────────────────────────────
   1 │ 1.63486e9  192.168.2.1      1            0.231
   2 │ 1.63486e9  164.128.182.113  1            0.659
   3 │ 1.63486e9  213.3.210.193    1            5.68
   4 │ 1.63486e9  109.200.218.72   1           20.8
   5 │ 1.63486e9  213.3.210.193    2            6.68
   6 │ 1.63486e9  192.168.2.1      2            0.221
   7 │ 1.63486e9  164.128.182.113  2            0.774
   8 │ 1.63486e9  109.200.218.72   2           20.2
  ⋮  │     ⋮             ⋮             ⋮         ⋮
 471 │ 1.63486e9  109.200.218.72   119         21.2
 472 │ 1.63486e9  164.128.182.113  118          1.18
 473 │ 1.63486e9  192.168.2.1      117          0.341
 474 │ 1.63486e9  213.3.210.193    120          5.55
 475 │ 1.63486e9  109.200.218.72   120         21.4
 476 │ 1.63486e9  164.128.182.113  119          0.73
 477 │ 1.63486e9  192.168.2.1      118          0.195
                                      462 rows omitted
Hi @segal_72, I haven't forgotten you, but was a little busy with other stuff. I'm not sure why you're only seeing a graph for 6 hops, but it could be enough perhaps. I would suggest to run the script, and after 5 seconds or so, start a speed test... see how it affects your pings all along the path, post the screen shot after the speed test has completed.
