I’ve stopped using nlbwmon. It spams the log and doesn’t seem to be keeping accurate numbers. I have it turned off in startup on my three r7800s. Hope they fix it. Might consider removing it next build.
I’m using ath10k-ct, 2 SSIDs total, cpu default settings for the build, and the stock VLAN setup - getting no crashes. Elimination of extras should help to find what is the culprit for the crashes.
I got two more of the random reboots (very hot day 110 F, no darn AC) with these clean logs in console-ramoops (no SWBA errors or anything before and after)
[26206.532451] rcu: INFO: rcu_sched self-detected stall on CPU
[26206.532504] rcu: 	1-...!: (1 GPs behind) idle=436/1/0x40000002 softirq=279305/279306 fqs=93
[26206.536863] rcu: rcu_sched kthread starved for 1914 jiffies! g761821 f0x0 RCU_GP_WAIT_FQS(5) ->state=0x0 ->cpu=0
[26206.545525] rcu: 	Unless rcu_sched kthread gets sufficient CPU time, OOM is now expected behavior.
[26206.555677] rcu: RCU grace-period kthread stack dump:
I think irqbalance with only 2 CPU cores (R7800's 2 Krait cores) would cause lots of memory context switching between them when you run multiple other processes (hostapd, nlbwmon, collected, VPN, SMB file sharing etc.) in addition to processing WAN and WIFI traffic. That will adversely affect the overall operations taken as a whole, rather than benefiting from it. CPU context-switching can only be executed once RCU read operations are completed.
Let's disable irqbalance (make sure you stop/start the irqbalance service after disabling it, or just reboot the router) to see if this RCU stalling issue still happen with relatively high frequency (every few hours or less than a day)
Does kernel 5.10 have issues with pppoe hardware offloading?
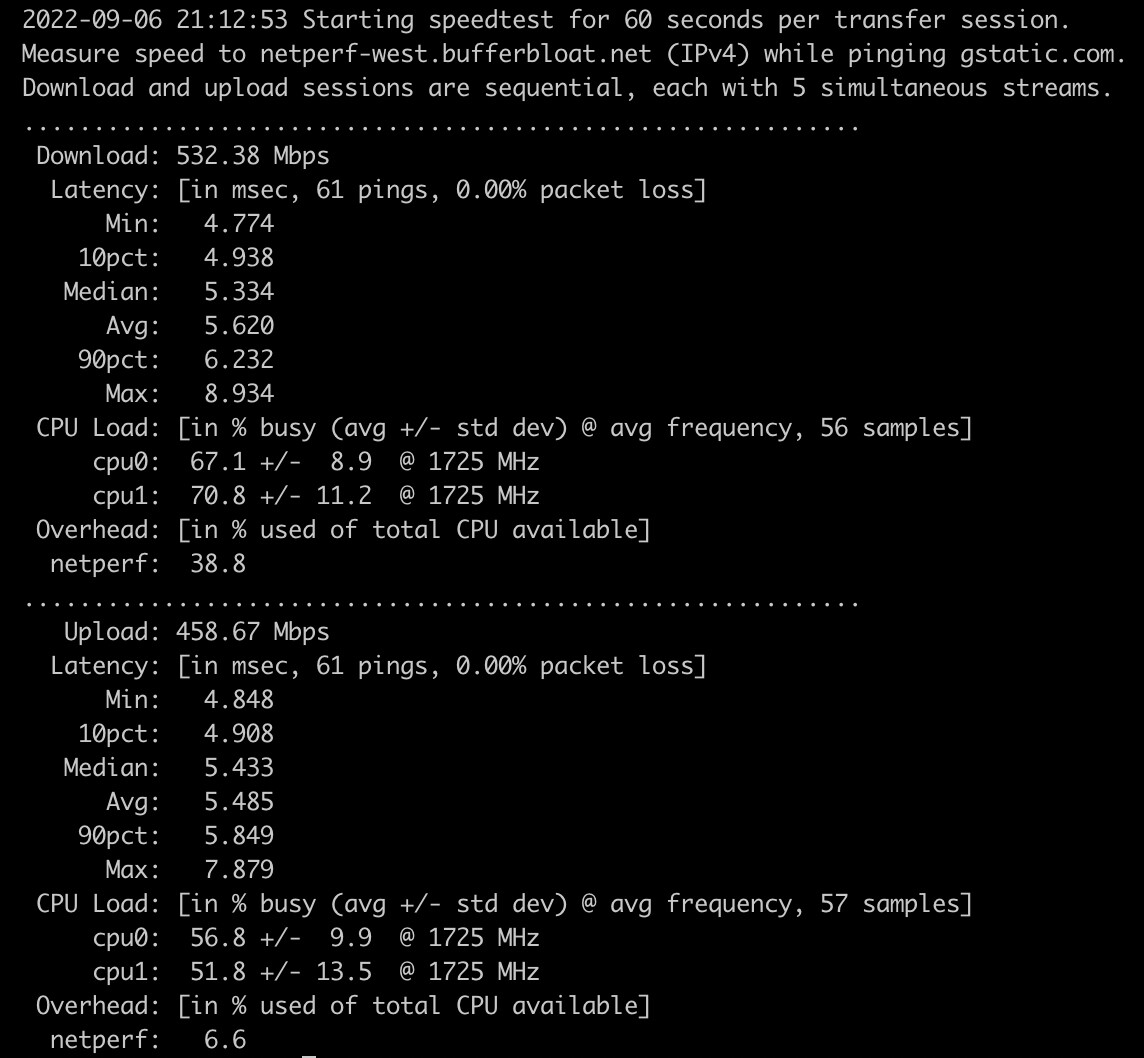
With my gigabit connection, I was getting around 800MB/s and 90%+ CPU load. Today I updated to the latest build and am getting much slower speeds and less CPU load.
Were you running the netperf client in the router itself? Most of the CPU utilizations ought to come from the client itself.
Please run your netperf client on a PC connected to the router's LAN port. That's when you will experience the benefit of NSS-offloading of your NAT overloaded connections.
And do not trust the throughput numbers when using these public netperf* servers at all. They're not dedicated and distributed servers like the ones used by speedtest.
It's a thing to try - I've been using irqbalance without apparent problems with 21.02.1. if irqbalance is a problem I'd expect it's in the realm of cache coherency issues.
The fastest path to figuring this out could be @vochong look at all the differences between his 3-week old build and the latest. Not config differences, C code diffs, line by line.
This kernel is widely used all over the place - I expect something in NSS code or driver is mis-using a syscall, other kernel resource, or similar. That's as close as I've gotten and it's still guesswork.
vlan_dev_get_stats64 seems to be consistently close to the center of the failures. Looking at the call stack with that func at the top, multiple tasks seem to be converging there.
When the speedtest is in progress, issue uptime and check the first load average. It should stay close to 0.00, assuming you don't run any other CPU heavy app during that time.
I think the extreme heat in the Grizzly Bear state is also wreaking some havoc on my R7800. Just another SWBA overrun and RCU stalling crash. That's a total 3 downs for today.
The R7800 CPU temperatures are normally around 52C. They're hovering around 65-67 today.
I've just built and loaded a new rebased 22.03 image (and updated feeds) with "make clean" before make. I've disabled irqbalance as well.
Tomorrow will be another crazy hot day. I'll hide in the ice cold office and let the "guy" suffer from heat torture the whole day. If he's alive throughout tomorrow, then irqbalance may have some role in it
I have a remote Linksys EA8500 that ran a 22.03 NSS image I built around the same time for R7800 yesterday. It has also just crashed with some RCU stalling. Before that it was running an older private NSS 22.03 image (kernel 5.10.136) with an uptime of about 3 weeks.
1.374808] [<c04abae0>] (seq_read_iter) from [<c04abd1c>] (seq_read+0xe8/0x124)
[ 6111.382712] [<c04abd1c>] (seq_read) from [<c0500740>] (proc_reg_read+0xcc/0x104)
[ 6111.390175] [<c0500740>] (proc_reg_read) from [<c047f15c>] (vfs_read+0xac/0x2e8)
[ 6111.397548] [<c047f15c>] (vfs_read) from [<c047f7e8>] (ksys_read+0x58/0xd4)
[ 6111.404925] [<c047f7e8>] (ksys_read) from [<c0300060>] (ret_fast_syscall+0x0/0x54)
[ 6111.411603] Exception stack(0xc7b49fa8 to 0xc7b49ff0)
[ 6111.419254] 9fa0:                   b6f40ab0 00000001 00000003 b6f40b48 00000400 00000000
[ 6111.424385] 9fc0: b6f40ab0 00000001 bea9d68f 00000003 000001ff 00000000 0001c083 0001aa9a
[ 6111.432535] 9fe0: 0002eea4 bea9d660 b6f07c68 b6f079ac
[ 6174.184761] rcu: INFO: rcu_sched self-detected stall on CPU
[ 6174.184812] rcu: 	1-....: (1 GPs behind) idle=106/1/0x40000002 softirq=74096/74097 fqs=4188
[ 6174.189154] 	(t=8404 jiffies g=143045 q=490)
[ 6174.197828] NMI backtrace for cpu 1
[ 6174.202084] CPU: 1 PID: 4150 Comm: vnstatd Not tainted 5.10.138 #0
[ 6174.205295] Hardware name: Generic DT based system
[ 6174.211564] [<c030e4ac>] (unwind_backtrace) from [<c030a22c>] (show_stack+0x14/0x20)
[ 6174.216335] [<c030a22c>] (show_stack) from [<c0634328>] (dump_stack+0x94/0xa8)
[ 6174.224233] [<c0634328>] (dump_stack) from [<c063c9b0>] (nmi_cpu_backtrace+0xdc/0x108)
[ 6174.231262] [<c063c9b0>] (nmi_cpu_backtrace) from [<c063cafc>] (nmi_trigger_cpumask_backtrace+0x120/0x158)
[ 6174.239170] [<c063cafc>] (nmi_trigger_cpumask_backtrace) from [<c03819f0>] (rcu_dump_cpu_stacks+0xe8/0x118)
[ 6174.248804] [<c03819f0>] (rcu_dump_cpu_stacks) from [<c0387504>] (rcu_sched_clock_irq+0x728/0x8f8)
[ 6174.258443] [<c0387504>] (rcu_sched_clock_irq) from [<c038e624>] (update_process_times+0x64/0x90)
[ 6174.267474] [<c038e624>] (update_process_times) from [<c03a1064>] (tick_sched_timer+0x88/0x130)
[ 6174.276407] [<c03a1064>] (tick_sched_timer) from [<c038ec28>] (__hrtimer_run_queues+0x184/0x254)
[ 6174.284912] [<c038ec28>] (__hrtimer_run_queues) from [<c038fc60>] (hrtimer_interrupt+0x130/0x374)
[ 6174.293939] [<c038fc60>] (hrtimer_interrupt) from [<c07e90a0>] (msm_timer_interrupt+0x3c/0x4c)
[ 6174.302712] [<c07e90a0>] (msm_timer_interrupt) from [<c0377cb4>] (handle_percpu_devid_irq+0x84/0x178)
[ 6174.311215] [<c0377cb4>] (handle_percpu_devid_irq) from [<c037178c>] (__handle_domain_irq+0x90/0xf4)
[ 6174.320502] [<c037178c>] (__handle_domain_irq) from [<c064d6bc>] (gic_handle_irq+0x90/0xb8)
[ 6174.329702] [<c064d6bc>] (gic_handle_irq) from [<c0300b8c>] (__irq_svc+0x6c/0x90)
[ 6174.337763] Exception stack(0xc7b49c40 to 0xc7b49c88)
[ 6174.345418] 9c40: 00000000 00000002 0000b22b ff7edd98 c7b49d68 c0d04f1c 00000000 00000000
[ 6174.350458] 9c60: c0d05038 c0d04f1c c0d04fe0 ffffffff 00000000 c7b49c90 c09c74fc c09c751c
[ 6174.358603] 9c80: 00000013 ffffffff
[ 6174.366764] [<c0300b8c>] (__irq_svc) from [<c09c751c>] (vlan_dev_get_stats64+0x74/0x19c)
[ 6174.370076] [<c09c751c>] (vlan_dev_get_stats64) from [<c081aa80>] (dev_get_stats+0x44/0xdc)
[ 6174.378408] [<c081aa80>] (dev_get_stats) from [<c085c8f0>] (dev_seq_printf_stats+0x20/0x14c)
[ 6174.386474] [<c085c8f0>] (dev_seq_printf_stats) from [<c085ca30>] (dev_seq_show+0x14/0x40)
[ 6174.395155] [<c085ca30>] (dev_seq_show) from [<c04abae0>] (seq_read_iter+0x3f0/0x544)
[ 6174.403224] [<c04abae0>] (seq_read_iter) from [<c04abd1c>] (seq_read+0xe8/0x124)
[ 6174.411128] [<c04abd1c>] (seq_read) from [<c0500740>] (proc_reg_read+0xcc/0x104)
[ 6174.418590] [<c0500740>] (proc_reg_read) from [<c047f15c>] (vfs_read+0xac/0x2e8)
[ 6174.425965] [<c047f15c>] (vfs_read) from [<c047f7e8>] (ksys_read+0x58/0xd4)
[ 6174.433342] [<c047f7e8>] (ksys_read) from [<c0300060>] (ret_fast_syscall+0x0/0x54)
[ 6174.440019] Exception stack(0xc7b49fa8 to 0xc7b49ff0)
[ 6174.447670] 9fa0:                   b6f40ab0 00000001 00000003 b6f40b48 00000400 00000000
[ 6174.452802] 9fc0: b6f40ab0 00000001 bea9d68f 00000003 000001ff 00000000 0001c083 0001aa9a
[ 6174.460951] 9fe0: 0002eea4 bea9d660 b6f07c68 b6f079ac
[ 6198.345720] br-lan: received packet on wlan1 with own address as source address (addr:36:c7:eb:65:e6:df, vlan:0)
[ 6198.375732] br-lan: received packet on wlan1 with own address as source address (addr:36:c7:eb:65:e6:df, vlan:0)
[ 6248.413004] rcu: INFO: rcu_sched self-detected stall on CPU
[ 6248.413058] rcu: 	1-....: (2099 ticks this GP) idle=e02/1/0x40000002 softirq=74252/74252 fqs=1032
[ 6248.417399] 	(t=2100 jiffies g=143393 q=26)
[ 6248.426422] NMI backtrace for cpu 1
[ 6248.430499] CPU: 1 PID: 4150 Comm: vnstatd Not tainted 5.10.138 #0
[ 6248.433972] Hardware name: Generic DT based system
[ 6248.440243] [<c030e4ac>] (unwind_backtrace) from [<c030a22c>] (show_stack+0x14/0x20)
[ 6248.445016] [<c030a22c>] (show_stack) from [<c0634328>] (dump_stack+0x94/0xa8)
[ 6248.452913] [<c0634328>] (dump_stack) from [<c063c9b0>] (nmi_cpu_backtrace+0xdc/0x108)
[ 6248.459940] [<c063c9b0>] (nmi_cpu_backtrace) from [<c063cafc>] (nmi_trigger_cpumask_backtrace+0x120/0x158)
[ 6248.467851] [<c063cafc>] (nmi_trigger_cpumask_backtrace) from [<c03819f0>] (rcu_dump_cpu_stacks+0xe8/0x118)
[ 6248.477484] [<c03819f0>] (rcu_dump_cpu_stacks) from [<c0387504>] (rcu_sched_clock_irq+0x728/0x8f8)
[ 6248.487122] [<c0387504>] (rcu_sched_clock_irq) from [<c038e624>] (update_process_times+0x64/0x90)
[ 6248.496151] [<c038e624>] (update_process_times) from [<c03a1064>] (tick_sched_timer+0x88/0x130)
[ 6248.505088] [<c03a1064>] (tick_sched_timer) from [<c038ec28>] (__hrtimer_run_queues+0x184/0x254)
[ 6248.513590] [<c038ec28>] (__hrtimer_run_queues) from [<c038fc60>] (hrtimer_interrupt+0x130/0x374)
[ 6248.522616] [<c038fc60>] (hrtimer_interrupt) from [<c07e90a0>] (msm_timer_interrupt+0x3c/0x4c)
[ 6248.531393] [<c07e90a0>] (msm_timer_interrupt) from [<c0377cb4>] (handle_percpu_devid_irq+0x84/0x178)
[ 6248.539892] [<c0377cb4>] (handle_percpu_devid_irq) from [<c037178c>] (__handle_domain_irq+0x90/0xf4)
[ 6248.549178] [<c037178c>] (__handle_domain_irq) from [<c064d6bc>] (gic_handle_irq+0x90/0xb8)
[ 6248.558378] [<c064d6bc>] (gic_handle_irq) from [<c0300b8c>] (__irq_svc+0x6c/0x90)
[ 6248.566441] Exception stack(0xc7b49c40 to 0xc7b49c88)
[ 6248.574096] 9c40: 00000000 00000002 0000b267 ff7edd98 c7b49d68 c0d04f1c 00000000 00000000
[ 6248.579134] 9c60: c0d05038 c0d04f1c c0d04fe0 ffffffff 00000000 c7b49c90 c09c74fc c09c751c
[ 6248.587279] 9c80: 00000013 ffffffff
[ 6248.595445] [<c0300b8c>] (__irq_svc) from [<c09c751c>] (vlan_dev_get_stats64+0x74/0x19c)
[ 6248.598753] [<c09c751c>] (vlan_dev_get_stats64) from [<c081aa80>] (dev_get_stats+0x44/0xdc)
[ 6248.607088] [<c081aa80>] (dev_get_stats) from [<c085c8f0>] (dev_seq_printf_stats+0x20/0x14c)
[ 6248.615154] [<c085c8f0>] (dev_seq_printf_stats) from [<c085ca30>] (dev_seq_show+0x14/0x40)
[ 6248.623832] [<c085ca30>] (dev_seq_show) from [<c04abae0>] (seq_read_iter+0x3f0/0x544)
[ 6248.631902] [<c04abae0>] (seq_read_iter) from [<c04abd1c>] (seq_read+0xe8/0x124)
[ 6248.639806] [<c04abd1c>] (seq_read) from [<c0500740>] (proc_reg_read+0xcc/0x104)
[ 6248.647268] [<c0500740>] (proc_reg_read) from [<c047f15c>] (vfs_read+0xac/0x2e8)
[ 6248.654642] [<c047f15c>] (vfs_read) from [<c047f7e8>] (ksys_read+0x58/0xd4)
[ 6248.662018] [<c047f7e8>] (ksys_read) from [<c0300060>] (ret_fast_syscall+0x0/0x54)
[ 6248.668697] Exception stack(0xc7b49fa8 to 0xc7b49ff0)
[ 6248.676348] 9fa0:                   b6f40040 00000001 00000003 b6f400d8 00000400 00000000
[ 6248.681480] 9fc0: b6f40040 00000001 bea9d68f 00000003 000001ff 00000000 0001c083 0001aa9a
[ 6248.689628] 9fe0: 0002eea4 bea9d660 b6f07c68 b6f079ac
[ 6311.441578] rcu: INFO: rcu_sched self-detected stall on CPU
[ 6311.441630] rcu: 	1-....: (8375 ticks this GP) idle=e02/1/0x40000002 softirq=74252/74252 fqs=4137
[ 6311.445972] 	(t=8403 jiffies g=143393 q=150)
[ 6311.454992] NMI backtrace for cpu 1
[ 6311.459421] CPU: 1 PID: 4150 Comm: vnstatd Not tainted 5.10.138 #0
[ 6311.462630] Hardware name: Generic DT based system
[ 6311.468900] [<c030e4ac>] (unwind_backtrace) from [<c030a22c>] (show_stack+0x14/0x20)
[ 6311.473672] [<c030a22c>] (show_stack) from [<c0634328>] (dump_stack+0x94/0xa8)
[ 6311.481568] [<c0634328>] (dump_stack) from [<c063c9b0>] (nmi_cpu_backtrace+0xdc/0x108)
[ 6311.488599] [<c063c9b0>] (nmi_cpu_backtrace) from [<c063cafc>] (nmi_trigger_cpumask_backtrace+0x120/0x158)
[ 6311.496507] [<c063cafc>] (nmi_trigger_cpumask_backtrace) from [<c03819f0>] (rcu_dump_cpu_stacks+0xe8/0x118)
[ 6311.506141] [<c03819f0>] (rcu_dump_cpu_stacks) from [<c0387504>] (rcu_sched_clock_irq+0x728/0x8f8)
[ 6311.515779] [<c0387504>] (rcu_sched_clock_irq) from [<c038e624>] (update_process_times+0x64/0x90)
[ 6311.524812] [<c038e624>] (update_process_times) from [<c03a1064>] (tick_sched_timer+0x88/0x130)
[ 6311.533744] [<c03a1064>] (tick_sched_timer) from [<c038ec28>] (__hrtimer_run_queues+0x184/0x254)
[ 6311.542252] [<c038ec28>] (__hrtimer_run_queues) from [<c038fc60>] (hrtimer_interrupt+0x130/0x374)
[ 6311.551277] [<c038fc60>] (hrtimer_interrupt) from [<c07e90a0>] (msm_timer_interrupt+0x3c/0x4c)
[ 6311.560056] [<c07e90a0>] (msm_timer_interrupt) from [<c0377cb4>] (handle_percpu_devid_irq+0x84/0x178)
[ 6311.568556] [<c0377cb4>] (handle_percpu_devid_irq) from [<c037178c>] (__handle_domain_irq+0x90/0xf4)
[ 6311.577843] [<c037178c>] (__handle_domain_irq) from [<c064d6bc>] (gic_handle_irq+0x90/0xb8)
[ 6311.587042] [<c064d6bc>] (gic_handle_irq) from [<c0300b8c>] (__irq_svc+0x6c/0x90)
[ 6311.595104] Exception stack(0xc7b49c40 to 0xc7b49c88)
[ 6311.602758] 9c40: 00000000 00000002 0000b267 ff7edd98 c7b49d68 c0d04f1c 00000000 00000000
[ 6311.607796] 9c60: c0d05038 c0d04f1c c0d04fe0 ffffffff 00000000 c7b49c90 c09c74fc c09c751c
[ 6311.615939] 9c80: 00000013 ffffffff
[ 6311.624102] [<c0300b8c>] (__irq_svc) from [<c09c751c>] (vlan_dev_get_stats64+0x74/0x19c)
[ 6311.627414] [<c09c751c>] (vlan_dev_get_stats64) from [<c081aa80>] (dev_get_stats+0x44/0xdc)
[ 6311.635744] [<c081aa80>] (dev_get_stats) from [<c085c8f0>] (dev_seq_printf_stats+0x20/0x14c)
[ 6311.643811] [<c085c8f0>] (dev_seq_printf_stats) from [<c085ca30>] (dev_seq_show+0x14/0x40)
[ 6311.652492] [<c085ca30>] (dev_seq_show) from [<c04abae0>] (seq_read_iter+0x3f0/0x544)
[ 6311.660561] [<c04abae0>] (seq_read_iter) from [<c04abd1c>] (seq_read+0xe8/0x124)
[ 6311.668464] [<c04abd1c>] (seq_read) from [<c0500740>] (proc_reg_read+0xcc/0x104)
[ 6311.675927] [<c0500740>] (proc_reg_read) from [<c047f15c>] (vfs_read+0xac/0x2e8)
[ 6311.683303] [<c047f15c>] (vfs_read) from [<c047f7e8>] (ksys_read+0x58/0xd4)
[ 6311.690679] [<c047f7e8>] (ksys_read) from [<c0300060>] (ret_fast_syscall+0x0/0x54)
[ 6311.697357] Exception stack(0xc7b49fa8 to 0xc7b49ff0)
[ 6311.705006] 9fa0:                   b6f40040 00000001 00000003 b6f400d8 00000400 00000000
[ 6311.710139] 9fc0: b6f40040 00000001 bea9d68f 00000003 000001ff 00000000 0001c083 0001aa9a
[ 6311.718288] 9fe0: 0002eea4 bea9d660 b6f07c68 b6f079ac
[ 6345.470937] ath10k_warn: 56 callbacks suppressed
[ 6345.470952] ath10k_pci 0001:01:00.0: wmi command 36892 timeout, restarting hardware
[ 6345.474714] ath10k_pci 0001:01:00.0: failed to recalculate rts/cts prot for vdev 0: -11
[ 6348.510875] ath10k_pci 0001:01:00.0: failed to set cts protection for vdev 0: -108
[ 6348.510934] ath10k_pci 0001:01:00.0: failed to set preamble for vdev 0: -108
[ 6348.517398] ath10k_pci 0001:01:00.0: failed to set mgmt tx rate -108
[ 6351.550808] ath10k_pci 0000:01:00.0: wmi command 36892 timeout, restarting hardware
[ 6351.550869] ath10k_pci 0000:01:00.0: failed to recalculate rts/cts prot for vdev 0: -11
[ 6354.590747] ath10k_pci 0000:01:00.0: failed to set cts protection for vdev 0: -108
[ 6354.590805] ath10k_pci 0000:01:00.0: failed to set erp slot for vdev 0: -108
[ 6354.597278] ath10k_pci 0000:01:00.0: failed to set preamble for vdev 0: -108
[ 6354.604543] ath10k_pci 0000:01:00.0: failed to set mgmt tx rate -108
[ 6354.615936] ath10k_pci 0001:01:00.0: failed to set beacon mode for vdev 0: -108
[ 6354.617826] ath10k_pci 0001:01:00.0: failed to set dtim period for vdev 0: -108
[ 6354.625902] ath10k_pci 0001:01:00.0: failed to recalculate rts/cts prot for vdev 0: -108
[ 6354.632246] ath10k_pci 0001:01:00.0: failed to set cts protection for vdev 0: -108
[ 6360.621145] ath10k_warn: 2 callbacks suppressed
[ 6360.621161] ath10k_pci 0000:01:00.0: failed to set beacon mode for vdev 0: -108
[ 6360.624837] ath10k_pci 0000:01:00.0: failed to set dtim period for vdev 0: -108
[ 6360.633042] ath10k_pci 0000:01:00.0: failed to recalculate rts/cts prot for vdev 0: -108
[ 6360.639150] ath10k_pci 0000:01:00.0: failed to set cts protection for vdev 0: -108
[ 6360.647541] ath10k_pci 0000:01:00.0: failed to set erp slot for vdev 0: -108
[ 6360.654890] ath10k_pci 0000:01:00.0: failed to set preamble for vdev 0: -108
[ 6360.662107] ath10k_pci 0000:01:00.0: failed to set mgmt tx rate -108
[ 6360.670910] ath10k_pci 0001:01:00.0: failed to set beacon mode for vdev 0: -108
[ 6360.675434] ath10k_pci 0001:01:00.0: failed to set dtim period for vdev 0: -108
[ 6360.683527] ath10k_pci 0001:01:00.0: failed to recalculate rts/cts prot for vdev 0: -108
[ 6363.150455] rcu: INFO: rcu_sched self-detected stall on CPU
[ 6363.150491] rcu: 	0-....: (1 GPs behind) idle=262/1/0x40000002 softirq=93018/93019 fqs=1048
[ 6363.154836] 	(t=2101 jiffies g=143449 q=67)
[ 6363.163513] NMI backtrace for cpu 0
[ 6363.167418] CPU: 0 PID: 6580 Comm: dropbear Not tainted 5.10.138 #0
[ 6363.170890] Hardware name: Generic DT based system
[ 6363.177155] [<c030e4ac>] (unwind_backtrace) from [<c030a22c>] (show_stack+0x14/0x20)
[ 6363.182012] [<c030a22c>] (show_stack) from [<c0634328>] (dump_stack+0x94/0xa8)
[ 6363.189911] [<c0634328>] (dump_stack) from [<c063c9b0>] (nmi_cpu_backtrace+0xdc/0x108)
[ 6363.196941] [<c063c9b0>] (nmi_cpu_backtrace) from [<c063cafc>] (nmi_trigger_cpumask_backtrace+0x120/0x158)
[ 6363.204846] [<c063cafc>] (nmi_trigger_cpumask_backtrace) from [<c03819f0>] (rcu_dump_cpu_stacks+0xe8/0x118)
[ 6363.214480] [<c03819f0>] (rcu_dump_cpu_stacks) from [<c0387504>] (rcu_sched_clock_irq+0x728/0x8f8)
[ 6363.224116] [<c0387504>] (rcu_sched_clock_irq) from [<c038e624>] (update_process_times+0x64/0x90)
[ 6363.233150] [<c038e624>] (update_process_times) from [<c03a1064>] (tick_sched_timer+0x88/0x130)
[ 6363.242083] [<c03a1064>] (tick_sched_timer) from [<c038ec28>] (__hrtimer_run_queues+0x184/0x254)
[ 6363.250588] [<c038ec28>] (__hrtimer_run_queues) from [<c038fc60>] (hrtimer_interrupt+0x130/0x374)
[ 6363.259615] [<c038fc60>] (hrtimer_interrupt) from [<c07e90a0>] (msm_timer_interrupt+0x3c/0x4c)
[ 6363.268388] [<c07e90a0>] (msm_timer_interrupt) from [<c0377cb4>] (handle_percpu_devid_irq+0x84/0x178)
[ 6363.276891] [<c0377cb4>] (handle_percpu_devid_irq) from [<c037178c>] (__handle_domain_irq+0x90/0xf4)
[ 6363.286179] [<c037178c>] (__handle_domain_irq) from [<c064d6bc>] (gic_handle_irq+0x90/0xb8)
[ 6363.295379] [<c064d6bc>] (gic_handle_irq) from [<c0300b8c>] (__irq_svc+0x6c/0x90)
[ 6363.303445] Exception stack(0xc15d1c40 to 0xc15d1c88)
[ 6363.311093] 1c40: 00000000 00000002 0000b271 ff7edd98 c15d1d68 c0d04f1c 00000000 00000000
[ 6363.316131] 1c60: c0d05038 c0d04f1c c0d04fe0 ffffffff 00000000 c15d1c90 c09c74fc c09c751c
[ 6363.324282] 1c80: 00000013 ffffffff
[ 6363.332441] [<c0300b8c>] (__irq_svc) from [<c09c751c>] (vlan_dev_get_stats64+0x74/0x19c)
[ 6363.335751] [<c09c751c>] (vlan_dev_get_stats64) from [<c081aa80>] (dev_get_stats+0x44/0xdc)
[ 6363.344082] [<c081aa80>] (dev_get_stats) from [<c085c8f0>] (dev_seq_printf_stats+0x20/0x14c)
[ 6363.352149] [<c085c8f0>] (dev_seq_printf_stats) from [<c085ca30>] (dev_seq_show+0x14/0x40)
[ 6363.360830] [<c085ca30>] (dev_seq_show) from [<c04abae0>] (seq_read_iter+0x3f0/0x544)
[ 6363.368901] [<c04abae0>] (seq_read_iter) from [<c04abd1c>] (seq_read+0xe8/0x124)
[ 6363.376805] [<c04abd1c>] (seq_read) from [<c0500740>] (proc_reg_read+0xcc/0x104)
[ 6363.384267] [<c0500740>] (proc_reg_read) from [<c047f15c>] (vfs_read+0xac/0x2e8)
[ 6363.391644] [<c047f15c>] (vfs_read) from [<c047f7e8>] (ksys_read+0x58/0xd4)
[ 6363.399020] [<c047f7e8>] (ksys_read) from [<c0300060>] (ret_fast_syscall+0x0/0x54)
[ 6363.405701] Exception stack(0xc15d1fa8 to 0xc15d1ff0)
[ 6363.413346] 1fa0:                   00000000 00000000 00000003 befc9ba4 00001000 00000000
[ 6363.418474] 1fc0: 00000000 00000000 00000000 00000003 befcac10 befc9ba4 00000fff befcae74
[ 6363.426629] 1fe0: befc9b60 befc9b50 b6f03350 b6f02830
@vochong
Note the 2nd line in the backtrack: vlan_dev_get_stats64 is called ultimately from ksys_read - which is core to the linux filesystem; it updates read, write stats.
I've seen this same failure, as well as others, all ending up in vlan_dev_get_stats64. I don't know if it's the cause or an innocent bystander.
It's down to what devices are executing this very common core code. A couple of my crashes were from kernel service of the LEDs, calling this very same code.