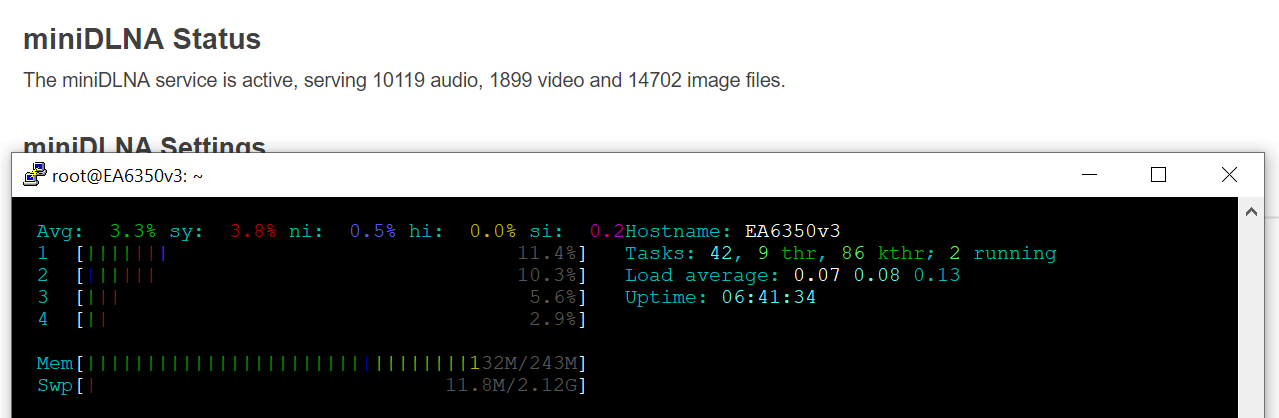
And....we have something going on now. @slh Looks like something to do with out of memory? Perhaps there is something of interest in attached.
root@EA6350:~# logread
Failed to find log object: Not found
[Message repeats 11 times]

root@EA6350:~# dmesg
[128570.385226] ath10k_ahb a000000.wifi: failed to increase tx pending count: -16, dropping
[128639.725346] ath10k_ahb a000000.wifi: failed to increase tx pending count: -16, dropping
...
[Message repeats, ~500 lines deleted]
...
[146774.833544] ath10k_ahb a000000.wifi: failed to increase tx pending count: -16, dropping
[146774.836442] ath10k_ahb a000000.wifi: failed to increase tx pending count: -16, dropping
[146774.841280] ath10k_ahb a000000.wifi: failed to increase tx pending count: -16, dropping
[146782.837800] nmbd invoked oom-killer: gfp_mask=0x6200ca(GFP_HIGHUSER_MOVABLE), nodemask=(null), order=0, oom_score_adj=0
[146782.837844] nmbd cpuset=/ mems_allowed=0
[146782.847823] CPU: 0 PID: 1706 Comm: nmbd Not tainted 4.19.85 #0
[146782.851644] Hardware name: Generic DT based system
[146782.857394] [<c030e310>] (unwind_backtrace) from [<c030ab70>] (show_stack+0x10/0x14)
[146782.862249] [<c030ab70>] (show_stack) from [<c07ab340>] (dump_stack+0x94/0xa8)
[146782.870236] [<c07ab340>] (dump_stack) from [<c03c660c>] (dump_header+0x6c/0x210)
[146782.877356] [<c03c660c>] (dump_header) from [<c03c5b98>] (oom_kill_process+0xd4/0x2ec)
[146782.884992] [<c03c5b98>] (oom_kill_process) from [<c03c651c>] (out_of_memory+0x30c/0x33c)
[146782.892803] [<c03c651c>] (out_of_memory) from [<c03cad50>] (__alloc_pages_nodemask+0xaf8/0xf28)
[146782.901137] [<c03cad50>] (__alloc_pages_nodemask) from [<c03c31ec>] (filemap_fault+0x2c4/0x760)
[146782.910082] [<c03c31ec>] (filemap_fault) from [<c03eb460>] (__do_fault+0xb4/0x118)
[146782.918845] [<c03eb460>] (__do_fault) from [<c03ef4e8>] (handle_mm_fault+0x7d4/0xc54)
[146782.926226] [<c03ef4e8>] (handle_mm_fault) from [<c030f030>] (do_page_fault+0x140/0x2b0)
[146782.934210] [<c030f030>] (do_page_fault) from [<c030f3cc>] (do_PrefetchAbort+0x38/0xa0)
[146782.942456] [<c030f3cc>] (do_PrefetchAbort) from [<c0302008>] (ret_from_exception+0x0/0x18)
[146782.950609] Exception stack(0xcdc27fb0 to 0xcdc27ff8)
[146782.959026] 7fa0:                                     0015bd7f 0000007e 00000028 00000000
[146782.963982] 7fc0: bed1b53c 00000028 00000000 bed1b538 bed1b814 0015bd7f 00000000 00000001
[146782.972225] 7fe0: 00000001 bed1b438 000cbe80 00013ae4 60000010 ffffffff
[146782.980541] Mem-Info:
[146782.987363] active_anon:1219 inactive_anon:51 isolated_anon:0
[146782.987363]  active_file:42 inactive_file:52 isolated_file:0
[146782.987363]  unevictable:0 dirty:0 writeback:0 unstable:0
[146782.987363]  slab_reclaimable:650 slab_unreclaimable:3930
[146782.987363]  mapped:45 shmem:216 pagetables:101 bounce:0
[146782.987363]  free:4090 free_pcp:91 free_cma:0
[146782.999505] Node 0 active_anon:4876kB inactive_anon:204kB active_file:168kB inactive_file:208kB unevictable:0kB isolated(anon):0kB isolated(file):0kB mapped:180kB dirty:0kB writeback:0kB shmem:864kB writeback_tmp:0kB unstable:0kB all_unreclaimable? yes
[146783.022080] Normal free:16360kB min:16384kB low:20480kB high:24576kB active_anon:4876kB inactive_anon:204kB active_file:168kB inactive_file:232kB unevictable:0kB writepending:0kB present:260096kB managed:249664kB mlocked:0kB kernel_stack:784kB pagetables:404kB bounce:0kB free_pcp:364kB local_pcp:56kB free_cma:0kB
[146783.049682] lowmem_reserve[]: 0 0 0
[146783.071882] Normal: 457*4kB (UME) 410*8kB (UME) 181*16kB (UME) 74*32kB (UME) 30*64kB (ME) 20*128kB (UME) 4*256kB (M) 1*512kB (M) 0*1024kB 0*2048kB 0*4096kB = 16388kB
[146783.075702] 374 total pagecache pages
[146783.090373] 0 pages in swap cache
[146783.094101] Swap cache stats: add 0, delete 0, find 0/0
[146783.097475] Free swap  = 0kB
[146783.102953] Total swap = 0kB
[146783.105805] 65024 pages RAM
[146783.108754] 0 pages HighMem/MovableOnly
[146783.111724] 2608 pages reserved
[146783.115613] Tasks state (memory values in pages):
[146783.118829] [  pid  ]   uid  tgid total_vm      rss pgtables_bytes swapents oom_score_adj name
[146783.123472] [    207]     0   207      257       24    10240        0             0 ubusd
[146783.132054] [    208]     0   208      175        7     8192        0             0 askfirst
[146783.140371] [    225]     0   225      202        8     8192        0             0 urngd
[146783.148981] [    540]     0   540      413       17     8192        0             0 wpa_supplicant
[146783.157139] [    619]     0   619      413       17     8192        0             0 wpa_supplicant
[146783.166079] [    764]     0   764      264       40     8192        0             0 logd
[146783.175105] [    790]     0   790      494       72    12288        0             0 rpcd
[146783.183439] [    958]     0   958      394       42     8192        0             0 netifd
[146783.191597] [    992]     0   992      310       26    10240        0             0 odhcpd
[146783.199745] [   1450]     0  1450      289       34    10240        0             0 uhttpd
[146783.208095] [   1551]     0  1551      269       11     6144        0             0 udhcpc
[146783.216424] [   1563]     0  1563      269        9     6144        0             0 udhcpc
[146783.224759] [   1703]     0  1703      642       60    10240        0             0 smbd
[146783.233092] [   1706]     0  1706      660       27    10240        0             0 nmbd
[146783.241426] [   2071]     0  2071      209       12     8192        0             0 dropbear
[146783.249573] [   2263]     0  2263     1020      131    12288        0             0 collectd
[146783.258095] [   2516]   453  2516      291       24     8192        0             0 dnsmasq
[146783.266599] [   2527]     0  2527      669      200    10240        0             0 https_dns_proxy
[146783.275108] [   2528]     0  2528      670      228    12288        0             0 https_dns_proxy
[146783.284223] [   2908]     0  2908      270       13     6144        0             0 ntpd
[146783.293335] [   3177]     0  3177      437       32     8192        0             0 hostapd
[146783.301407] [   3332]     0  3332      425       29     8192        0             0 hostapd
[146783.309901] Out of memory: Kill process 2528 (https_dns_proxy) score 3 or sacrifice child
[146783.318349] Killed process 2528 (https_dns_proxy) total-vm:2680kB, anon-rss:912kB, file-rss:0kB, shmem-rss:0kB
[146783.327324] ath10k_ahb a000000.wifi: SWBA overrun on vdev 1, skipped old beacon
[146783.327377] oom_reaper: reaped process 2528 (https_dns_proxy), now anon-rss:0kB, file-rss:0kB, shmem-rss:0kB
[146783.336694] ath10k_ahb a000000.wifi: SWBA overrun on vdev 0, skipped old beacon
[146783.352099] kthreadd invoked oom-killer: gfp_mask=0x7080c0(GFP_KERNEL_ACCOUNT|__GFP_ZERO), nodemask=(null), order=1, oom_score_adj=0
[146783.353923] ath10k_ahb a000000.wifi: SWBA overrun on vdev 1, skipped old beacon
[146783.361333] kthreadd cpuset=/ mems_allowed=0
[146783.374522] ath10k_ahb a800000.wifi: SWBA overrun on vdev 0, skipped old beacon
[146783.380647] CPU: 3 PID: 2 Comm: kthreadd Not tainted 4.19.85 #0
[146783.385008] ath10k_ahb a800000.wifi: SWBA overrun on vdev 1, skipped old beacon
[146783.392357] Hardware name: Generic DT based system
[146783.392385] [<c030e310>] (unwind_backtrace) from [<c030ab70>] (show_stack+0x10/0x14)
[146783.392402] [<c030ab70>] (show_stack) from [<c07ab340>] (dump_stack+0x94/0xa8)
[146783.398424] ath10k_ahb a800000.wifi: SWBA overrun on vdev 0, skipped old beacon
[146783.405737] [<c07ab340>] (dump_stack) from [<c03c660c>] (dump_header+0x6c/0x210)
[146783.405755] [<c03c660c>] (dump_header) from [<c03c5b98>] (oom_kill_process+0xd4/0x2ec)
[146783.410403] ath10k_ahb a800000.wifi: SWBA overrun on vdev 1, skipped old beacon
[146783.418324] [<c03c5b98>] (oom_kill_process) from [<c03c651c>] (out_of_memory+0x30c/0x33c)
[146783.418339] [<c03c651c>] (out_of_memory) from [<c03cad50>] (__alloc_pages_nodemask+0xaf8/0xf28)
[146783.418359] [<c03cad50>] (__alloc_pages_nodemask) from [<c031926c>] (copy_process.part.2+0x14c/0x1794)
[146783.472932] [<c031926c>] (copy_process.part.2) from [<c031aa34>] (_do_fork+0xbc/0x364)
[146783.482039] [<c031aa34>] (_do_fork) from [<c031ad28>] (kernel_thread+0x2c/0x34)
[146783.490027] [<c031ad28>] (kernel_thread) from [<c0337904>] (kthreadd+0x190/0x208)
[146783.497666] [<c0337904>] (kthreadd) from [<c03010e8>] (ret_from_fork+0x14/0x2c)
[146783.505035] Exception stack(0xcf845fb0 to 0xcf845ff8)
[146783.512587] 5fa0:                                     00000000 00000000 00000000 00000000
[146783.517539] 5fc0: 00000000 00000000 00000000 00000000 00000000 00000000 00000000 00000000
[146783.525785] 5fe0: 00000000 00000000 00000000 00000000 00000013 00000000
[146783.534123] Mem-Info:
[146783.540913] active_anon:998 inactive_anon:51 isolated_anon:0
[146783.540913]  active_file:62 inactive_file:93 isolated_file:0
[146783.540913]  unevictable:0 dirty:0 writeback:0 unstable:0
[146783.540913]  slab_reclaimable:652 slab_unreclaimable:3958
[146783.540913]  mapped:47 shmem:216 pagetables:101 bounce:0
[146783.540913]  free:4086 free_pcp:120 free_cma:0
[146783.553053] Node 0 active_anon:3992kB inactive_anon:204kB active_file:248kB inactive_file:372kB unevictable:0kB isolated(anon):0kB isolated(file):0kB mapped:188kB dirty:0kB writeback:0kB shmem:864kB writeback_tmp:0kB unstable:0kB all_unreclaimable? yes
[146783.575625] Normal free:16280kB min:16384kB low:20480kB high:24576kB active_anon:3992kB inactive_anon:204kB active_file:248kB inactive_file:372kB unevictable:0kB writepending:0kB present:260096kB managed:249664kB mlocked:0kB kernel_stack:1272kB pagetables:404kB bounce:0kB free_pcp:480kB local_pcp:96kB free_cma:0kB
[146783.603556] lowmem_reserve[]: 0 0 0
[146783.625801] Normal: 494*4kB (UME) 380*8kB (UME) 179*16kB (UME) 77*32kB (UME) 31*64kB (UME) 19*128kB (UME) 4*256kB (M) 1*512kB (U) 0*1024kB 0*2048kB 0*4096kB = 16296kB
[146783.629349] 385 total pagecache pages
[146783.644027] 0 pages in swap cache
[146783.647821] Swap cache stats: add 0, delete 0, find 0/0
[146783.651223] Free swap  = 0kB
[146783.656673] Total swap = 0kB
[146783.659539] 65024 pages RAM
[146783.662504] 0 pages HighMem/MovableOnly
[146783.665442] 2608 pages reserved
[146783.669349] Tasks state (memory values in pages):
[146783.672578] [  pid  ]   uid  tgid total_vm      rss pgtables_bytes swapents oom_score_adj name
[146783.677191] [    207]     0   207      257       24    10240        0             0 ubusd
[146783.685787] [    208]     0   208      175        7     8192        0             0 askfirst
[146783.694122] [    225]     0   225      202        8     8192        0             0 urngd
[146783.702713] [    540]     0   540      413       17     8192        0             0 wpa_supplicant
[146783.710873] [    619]     0   619      413       17     8192        0             0 wpa_supplicant
[146783.719799] [    764]     0   764      264       40     8192        0             0 logd
[146783.728845] [    790]     0   790      494       72    12288        0             0 rpcd
[146783.737176] [    958]     0   958      394       42     8192        0             0 netifd
[146783.745337] [    992]     0   992      310       26    10240        0             0 odhcpd
[146783.753496] [   1450]     0  1450      289       34    10240        0             0 uhttpd
[146783.761826] [   1551]     0  1551      269       11     6144        0             0 udhcpc
[146783.770143] [   1563]     0  1563      269        9     6144        0             0 udhcpc
[146783.778494] [   1703]     0  1703      642       60    10240        0             0 smbd
[146783.786829] [   1706]     0  1706      660       27    10240        0             0 nmbd
[146783.795162] [   2071]     0  2071      209       12     8192        0             0 dropbear
[146783.803322] [   2263]     0  2263     1020      131    12288        0             0 collectd
[146783.811825] [   2516]   453  2516      291       24     8192        0             0 dnsmasq
[146783.820319] [   2527]     0  2527      669      200    10240        0             0 https_dns_proxy
[146783.828848] [   2908]     0  2908      270       13     6144        0             0 ntpd
[146783.837956] [   3177]     0  3177      437       32     8192        0             0 hostapd
[146783.846027] [   3332]     0  3332      425       29     8192        0             0 hostapd
[146783.854552] Out of memory: Kill process 2527 (https_dns_proxy) score 3 or sacrifice child
[146783.862977] Killed process 2527 (https_dns_proxy) total-vm:2676kB, anon-rss:800kB, file-rss:0kB, shmem-rss:0kB
[146783.871685] oom_reaper: reaped process 2527 (https_dns_proxy), now anon-rss:0kB, file-rss:0kB, shmem-rss:0kB
[146784.489290] logd invoked oom-killer: gfp_mask=0x6200ca(GFP_HIGHUSER_MOVABLE), nodemask=(null), order=0, oom_score_adj=0
[146784.489334] logd cpuset=/ mems_allowed=0
[146784.499279] CPU: 3 PID: 764 Comm: logd Not tainted 4.19.85 #0
[146784.503133] Hardware name: Generic DT based system
[146784.508887] [<c030e310>] (unwind_backtrace) from [<c030ab70>] (show_stack+0x10/0x14)
[146784.513652] [<c030ab70>] (show_stack) from [<c07ab340>] (dump_stack+0x94/0xa8)
[146784.521640] [<c07ab340>] (dump_stack) from [<c03c660c>] (dump_header+0x6c/0x210)
[146784.528758] [<c03c660c>] (dump_header) from [<c03c5b98>] (oom_kill_process+0xd4/0x2ec)
[146784.536396] [<c03c5b98>] (oom_kill_process) from [<c03c651c>] (out_of_memory+0x30c/0x33c)
[146784.544208] [<c03c651c>] (out_of_memory) from [<c03cad50>] (__alloc_pages_nodemask+0xaf8/0xf28)
[146784.552544] [<c03cad50>] (__alloc_pages_nodemask) from [<c03c31ec>] (filemap_fault+0x2c4/0x760)
[146784.561487] [<c03c31ec>] (filemap_fault) from [<c03eb460>] (__do_fault+0xb4/0x118)
[146784.570249] [<c03eb460>] (__do_fault) from [<c03ef4e8>] (handle_mm_fault+0x7d4/0xc54)
[146784.577629] [<c03ef4e8>] (handle_mm_fault) from [<c030f030>] (do_page_fault+0x140/0x2b0)
[146784.585615] [<c030f030>] (do_page_fault) from [<c030f3cc>] (do_PrefetchAbort+0x38/0xa0)
[146784.593860] [<c030f3cc>] (do_PrefetchAbort) from [<c0302008>] (ret_from_exception+0x0/0x18)
[146784.602012] Exception stack(0xce8f5fb0 to 0xce8f5ff8)
[146784.610430] 5fa0:                                     00023068 00000ff7 00000000 000118c4
[146784.615440] 5fc0: 00023068 00000001 00000001 bee32e24 ffffffff 00000001 0000201d 00000001
[146784.623630] 5fe0: 00000000 bee32e20 b6e99ac0 000118c4 20000010 ffffffff
[146784.632001] Mem-Info:
[146784.638743] active_anon:791 inactive_anon:51 isolated_anon:0
[146784.638743]  active_file:145 inactive_file:195 isolated_file:0
[146784.638743]  unevictable:0 dirty:0 writeback:0 unstable:0
[146784.638743]  slab_reclaimable:654 slab_unreclaimable:3988
[146784.638743]  mapped:81 shmem:216 pagetables:92 bounce:0
[146784.638743]  free:4080 free_pcp:75 free_cma:0
[146784.650900] Node 0 active_anon:3164kB inactive_anon:204kB active_file:580kB inactive_file:780kB unevictable:0kB isolated(anon):0kB isolated(file):0kB mapped:324kB dirty:0kB writeback:0kB shmem:864kB writeback_tmp:0kB unstable:0kB all_unreclaimable? yes
[146784.673472] Normal free:16320kB min:16384kB low:20480kB high:24576kB active_anon:3164kB inactive_anon:204kB active_file:580kB inactive_file:804kB unevictable:0kB writepending:0kB present:260096kB managed:249664kB mlocked:0kB kernel_stack:1296kB pagetables:368kB bounce:0kB free_pcp:300kB local_pcp:64kB free_cma:0kB
[146784.701400] lowmem_reserve[]: 0 0 0
[146784.723639] Normal: 256*4kB (UME) 384*8kB (UME) 187*16kB (UME) 90*32kB (UME) 35*64kB (UME) 20*128kB (UME) 4*256kB (M) 1*512kB (U) 0*1024kB 0*2048kB 0*4096kB = 16304kB
[146784.727195] 578 total pagecache pages
[146784.741866] 0 pages in swap cache
[146784.745665] Swap cache stats: add 0, delete 0, find 0/0
[146784.749054] Free swap  = 0kB
[146784.754533] Total swap = 0kB
[146784.757384] 65024 pages RAM
[146784.760335] 0 pages HighMem/MovableOnly
[146784.763305] 2608 pages reserved
[146784.767194] Tasks state (memory values in pages):
[146784.770406] [  pid  ]   uid  tgid total_vm      rss pgtables_bytes swapents oom_score_adj name
[146784.775051] [    207]     0   207      257       24    10240        0             0 ubusd
[146784.783633] [    208]     0   208      175        7     8192        0             0 askfirst
[146784.791963] [    225]     0   225      202        8     8192        0             0 urngd
[146784.800544] [    540]     0   540      413       17     8192        0             0 wpa_supplicant
[146784.808715] [    619]     0   619      413       17     8192        0             0 wpa_supplicant
[146784.817661] [    764]     0   764      264       40     8192        0             0 logd
[146784.826688] [    790]     0   790      494       72    12288        0             0 rpcd
[146784.835017] [    958]     0   958      394       42     8192        0             0 netifd
[146784.843181] [    992]     0   992      310       26    10240        0             0 odhcpd
[146784.851339] [   1450]     0  1450      289       34    10240        0             0 uhttpd
[146784.859656] [   1551]     0  1551      269       11     6144        0             0 udhcpc
[146784.868007] [   1563]     0  1563      269        9     6144        0             0 udhcpc
[146784.876341] [   1703]     0  1703      642       60    10240        0             0 smbd
[146784.884670] [   1706]     0  1706      660       27    10240        0             0 nmbd
[146784.893003] [   2071]     0  2071      209       12     8192        0             0 dropbear
[146784.901164] [   2263]     0  2263     1020      131    12288        0             0 collectd
[146784.909655] [   2516]   453  2516      291       24     8192        0             0 dnsmasq
[146784.918204] [   2908]     0  2908      270       13     6144        0             0 ntpd
[146784.926688] [   3177]     0  3177      437       32     8192        0             0 hostapd
[146784.934757] [   3332]     0  3332      425       29     8192        0             0 hostapd
[146784.943284] Out of memory: Kill process 2263 (collectd) score 2 or sacrifice child
[146784.951746] Killed process 2263 (collectd) total-vm:4080kB, anon-rss:524kB, file-rss:0kB, shmem-rss:0kB
...
[Pattern repeats]
...
[146814.715059] odhcpd invoked oom-killer: gfp_mask=0x6200ca(GFP_HIGHUSER_MOVABLE), nodemask=(null), order=0, oom_score_adj=0
[146814.715100] odhcpd cpuset=/ mems_allowed=0
[146814.725073] CPU: 0 PID: 992 Comm: odhcpd Not tainted 4.19.85 #0
[146814.729076] Hardware name: Generic DT based system
[146814.735347] [<c030e310>] (unwind_backtrace) from [<c030ab70>] (show_stack+0x10/0x14)
[146814.739940] [<c030ab70>] (show_stack) from [<c07ab340>] (dump_stack+0x94/0xa8)
[146814.747929] [<c07ab340>] (dump_stack) from [<c03c660c>] (dump_header+0x6c/0x210)
[146814.755046] [<c03c660c>] (dump_header) from [<c03c5b98>] (oom_kill_process+0xd4/0x2ec)
[146814.762682] [<c03c5b98>] (oom_kill_process) from [<c03c651c>] (out_of_memory+0x30c/0x33c)
[146814.770494] [<c03c651c>] (out_of_memory) from [<c03cad50>] (__alloc_pages_nodemask+0xaf8/0xf28)
[146814.778830] [<c03cad50>] (__alloc_pages_nodemask) from [<c03c31ec>] (filemap_fault+0x2c4/0x760)
[146814.787773] [<c03c31ec>] (filemap_fault) from [<c03eb460>] (__do_fault+0xb4/0x118)
[146814.796536] [<c03eb460>] (__do_fault) from [<c03ef4e8>] (handle_mm_fault+0x7d4/0xc54)
[146814.803917] [<c03ef4e8>] (handle_mm_fault) from [<c030f030>] (do_page_fault+0x140/0x2b0)
[146814.811902] [<c030f030>] (do_page_fault) from [<c030f3cc>] (do_PrefetchAbort+0x38/0xa0)
[146814.820147] [<c030f3cc>] (do_PrefetchAbort) from [<c0302008>] (ret_from_exception+0x0/0x18)
[146814.828300] Exception stack(0xce095fb0 to 0xce095ff8)
[146814.836718] 5fa0:                                     00000000 b6ed8268 0000000a 000003e8
[146814.841673] 5fc0: 00000000 00000008 b6ed8010 0000015a ffffffff 00000000 0000201d 00000001
[146814.849917] 5fe0: 00000003 bed6ce2c b6efce98 b6efce68 60000010 ffffffff
[146814.858182] Mem-Info:
[146814.865041] active_anon:487 inactive_anon:27 isolated_anon:0
[146814.865041]  active_file:31 inactive_file:19 isolated_file:0
[146814.865041]  unevictable:0 dirty:0 writeback:0 unstable:0
[146814.865041]  slab_reclaimable:629 slab_unreclaimable:4050
[146814.865041]  mapped:18 shmem:216 pagetables:59 bounce:0
[146814.865041]  free:4091 free_pcp:85 free_cma:0
[146814.877179] Node 0 active_anon:1948kB inactive_anon:108kB active_file:124kB inactive_file:76kB unevictable:0kB isolated(anon):0kB isolated(file):0kB mapped:72kB dirty:0kB writeback:0kB shmem:864kB writeback_tmp:0kB unstable:0kB all_unreclaimable? yes
[146814.899450] Normal free:16364kB min:16384kB low:20480kB high:24576kB active_anon:1948kB inactive_anon:108kB active_file:124kB inactive_file:0kB unevictable:0kB writepending:0kB present:260096kB managed:249664kB mlocked:0kB kernel_stack:2096kB pagetables:236kB bounce:0kB free_pcp:340kB local_pcp:328kB free_cma:0kB
[146814.926994] lowmem_reserve[]: 0 0 0
[146814.949221] Normal: 253*4kB (UME) 306*8kB (UME) 214*16kB (UME) 98*32kB (UME) 29*64kB (ME) 21*128kB (UME) 7*256kB (M) 1*512kB (U) 0*1024kB 0*2048kB 0*4096kB = 16868kB
[146814.953060] 298 total pagecache pages
[146814.967711] 0 pages in swap cache
[146814.971444] Swap cache stats: add 0, delete 0, find 0/0
[146814.974819] Free swap  = 0kB
[146814.980296] Total swap = 0kB
[146814.983150] 65024 pages RAM
[146814.986098] 0 pages HighMem/MovableOnly
[146814.989054] 2608 pages reserved
[146814.992970] Tasks state (memory values in pages):
[146814.996174] [  pid  ]   uid  tgid total_vm      rss pgtables_bytes swapents oom_score_adj name
[146815.000813] [    207]     0   207      257       22    10240        0             0 ubusd
[146815.009382] [    208]     0   208      175        7     8192        0             0 askfirst
[146815.017727] [    225]     0   225      202        8     8192        0             0 urngd
[146815.026321] [    540]     0   540      413       17     8192        0             0 wpa_supplicant
[146815.034481] [    619]     0   619      413       17     8192        0             0 wpa_supplicant
[146815.043421] [    992]     0   992      310       26    10240        0             0 odhcpd
[146815.052447] [   1450]     0  1450      289       34    10240        0             0 uhttpd
[146815.060780] [   1706]     0  1706      660       27    10240        0             0 nmbd
[146815.069104] [   2071]     0  2071      209       12     8192        0             0 dropbear
[146815.077450] [   2516]   453  2516      291       24     8192        0             0 dnsmasq
[146815.085955] [   2908]     0  2908      270       13     6144        0             0 ntpd
[146815.094462] [   3177]     0  3177      437       32     8192        0             0 hostapd
[146815.102534] [   3332]     0  3332      425       29     8192        0             0 hostapd
[146815.111090] Out of memory: Kill process 1450 (uhttpd) score 0 or sacrifice child
[146815.119464] Killed process 1450 (uhttpd) total-vm:1156kB, anon-rss:128kB, file-rss:8kB, shmem-rss:0kB
[146815.127215] oom_reaper: reaped process 1450 (uhttpd), now anon-rss:0kB, file-rss:0kB, shmem-rss:0kB
[146815.127811] ath10k_ahb a000000.wifi: SWBA overrun on vdev 0, skipped old beacon
[146815.145433] ath10k_ahb a000000.wifi: SWBA overrun on vdev 1, skipped old beacon
[146815.153900] ath10k_ahb a800000.wifi: SWBA overrun on vdev 1, skipped old beacon
[146815.160142] ath10k_ahb a800000.wifi: SWBA overrun on vdev 0, skipped old beacon
[146816.446557] odhcpd invoked oom-killer: gfp_mask=0x6200ca(GFP_HIGHUSER_MOVABLE), nodemask=(null), order=0, oom_score_adj=0
[146816.446603] odhcpd cpuset=/ mems_allowed=0
[146816.456576] CPU: 3 PID: 992 Comm: odhcpd Not tainted 4.19.85 #0
[146816.460575] Hardware name: Generic DT based system
[146816.466850] [<c030e310>] (unwind_backtrace) from [<c030ab70>] (show_stack+0x10/0x14)
[146816.471441] [<c030ab70>] (show_stack) from [<c07ab340>] (dump_stack+0x94/0xa8)
[146816.479430] [<c07ab340>] (dump_stack) from [<c03c660c>] (dump_header+0x6c/0x210)
[146816.486572] [<c03c660c>] (dump_header) from [<c03c5b98>] (oom_kill_process+0xd4/0x2ec)
[146816.494183] [<c03c5b98>] (oom_kill_process) from [<c03c651c>] (out_of_memory+0x30c/0x33c)
[146816.501997] [<c03c651c>] (out_of_memory) from [<c03cad50>] (__alloc_pages_nodemask+0xaf8/0xf28)
[146816.510358] [<c03cad50>] (__alloc_pages_nodemask) from [<c03c31ec>] (filemap_fault+0x2c4/0x760)
[146816.519277] [<c03c31ec>] (filemap_fault) from [<c03eb460>] (__do_fault+0xb4/0x118)
[146816.528037] [<c03eb460>] (__do_fault) from [<c03ef4e8>] (handle_mm_fault+0x7d4/0xc54)
[146816.535417] [<c03ef4e8>] (handle_mm_fault) from [<c030f030>] (do_page_fault+0x140/0x2b0)
[146816.543405] [<c030f030>] (do_page_fault) from [<c030f3cc>] (do_PrefetchAbort+0x38/0xa0)
[146816.551676] [<c030f3cc>] (do_PrefetchAbort) from [<c0302008>] (ret_from_exception+0x0/0x18)
[146816.559802] Exception stack(0xce095fb0 to 0xce095ff8)
[146816.568220] 5fa0:                                     00000000 b6ed8268 0000000a 000003e8
[146816.573174] 5fc0: 00000000 00000008 b6ed8010 0000015a ffffffff 00000000 0000201d 00000001
[146816.581418] 5fe0: 00000003 bed6ce2c b6efce98 b6efce68 60000010 ffffffff
[146816.589804] Mem-Info:
[146816.596557] active_anon:455 inactive_anon:27 isolated_anon:0
[146816.596557]  active_file:134 inactive_file:171 isolated_file:0
[146816.596557]  unevictable:0 dirty:0 writeback:0 unstable:0
[146816.596557]  slab_reclaimable:632 slab_unreclaimable:4053
[146816.596557]  mapped:209 shmem:216 pagetables:54 bounce:0
[146816.596557]  free:4098 free_pcp:53 free_cma:0
[146816.609030] Node 0 active_anon:1820kB inactive_anon:108kB active_file:536kB inactive_file:684kB unevictable:0kB isolated(anon):0kB isolated(file):0kB mapped:836kB dirty:0kB writeback:0kB shmem:864kB writeback_tmp:0kB unstable:0kB all_unreclaimable? yes
[146816.631350] Normal free:16520kB min:16384kB low:20480kB high:24576kB active_anon:1820kB inactive_anon:108kB active_file:536kB inactive_file:708kB unevictable:0kB writepending:0kB present:260096kB managed:249664kB mlocked:0kB kernel_stack:2088kB pagetables:216kB bounce:0kB free_pcp:212kB local_pcp:56kB free_cma:0kB
[146816.659275] lowmem_reserve[]: 0 0 0
[146816.681509] Normal: 158*4kB (UME) 262*8kB (UME) 212*16kB (UME) 107*32kB (UME) 29*64kB (ME) 22*128kB (UME) 7*256kB (M) 1*512kB (U) 0*1024kB 0*2048kB 0*4096kB = 16520kB
[146816.685069] 540 total pagecache pages
[146816.699746] 0 pages in swap cache
[146816.703556] Swap cache stats: add 0, delete 0, find 0/0
[146816.706929] Free swap  = 0kB
[146816.712410] Total swap = 0kB
[146816.715258] 65024 pages RAM
[146816.718209] 0 pages HighMem/MovableOnly
[146816.721180] 2608 pages reserved
[146816.725067] Tasks state (memory values in pages):
[146816.728281] [  pid  ]   uid  tgid total_vm      rss pgtables_bytes swapents oom_score_adj name
[146816.732928] [    207]     0   207      257       22    10240        0             0 ubusd
[146816.741503] [    208]     0   208      175        7     8192        0             0 askfirst
[146816.749823] [    225]     0   225      202        8     8192        0             0 urngd
[146816.758432] [    540]     0   540      413       17     8192        0             0 wpa_supplicant
[146816.766600] [    619]     0   619      413       17     8192        0             0 wpa_supplicant
[146816.775538] [    992]     0   992      310       26    10240        0             0 odhcpd
[146816.784560] [   1706]     0  1706      660       27    10240        0             0 nmbd
[146816.792898] [   2071]     0  2071      209       12     8192        0             0 dropbear
[146816.801231] [   2516]   453  2516      291       24     8192        0             0 dnsmasq
[146816.809718] [   2908]     0  2908      270       13     6144        0             0 ntpd
[146816.818242] [   3177]     0  3177      437       32     8192        0             0 hostapd
[146816.826315] [   3332]     0  3332      425       29     8192        0             0 hostapd
[146816.834877] Out of memory: Kill process 3177 (hostapd) score 0 or sacrifice child
[146816.843255] Killed process 3177 (hostapd) total-vm:1748kB, anon-rss:128kB, file-rss:0kB, shmem-rss:0kB
[146816.851047] oom_reaper: reaped process 3177 (hostapd), now anon-rss:0kB, file-rss:0kB, shmem-rss:0kB
[146817.274356] ath10k_ahb a000000.wifi: No VIF found for vdev 1
[146817.274402] ath10k_ahb a000000.wifi: no vif for vdev_id 1 found
[146817.340317] ath10k_ahb a000000.wifi: No VIF found for vdev 1
[146817.340362] ath10k_ahb a000000.wifi: received addba event for invalid vdev_id: 1
[146817.345091] ath10k_ahb a000000.wifi: No VIF found for vdev 1
[146817.352578] ath10k_ahb a000000.wifi: received addba event for invalid vdev_id: 1
[146817.367829] ath10k_ahb a000000.wifi: peer-unmap-event: unknown peer id 1
[146817.367870] ath10k_ahb a000000.wifi: peer-unmap-event: unknown peer id 1
[146817.373794] ath10k_ahb a000000.wifi: peer-unmap-event: unknown peer id 1
[146817.381182] br-GST: port 2(wlan0-1) entered disabled state
[146817.392275] device wlan0-1 left promiscuous mode
[146817.392566] br-GST: port 2(wlan0-1) entered disabled state
[224872.033184] ath10k_ahb a800000.wifi: Invalid legacy rate 26 peer stats
root@EA6350:~#


Browser Luci access error:

/usr/lib/lua/luci/dispatcher.lua:315: /etc/config/luci seems to be corrupt, unable to find section 'main'
stack traceback:
	[C]: in function 'assert'
	/usr/lib/lua/luci/dispatcher.lua:315: in function 'dispatch'
	/usr/lib/lua/luci/dispatcher.lua:208: in function </usr/lib/lua/luci/dispatcher.lua:207>