Hi Forum,
kinda new with OpenWRT but I like it !
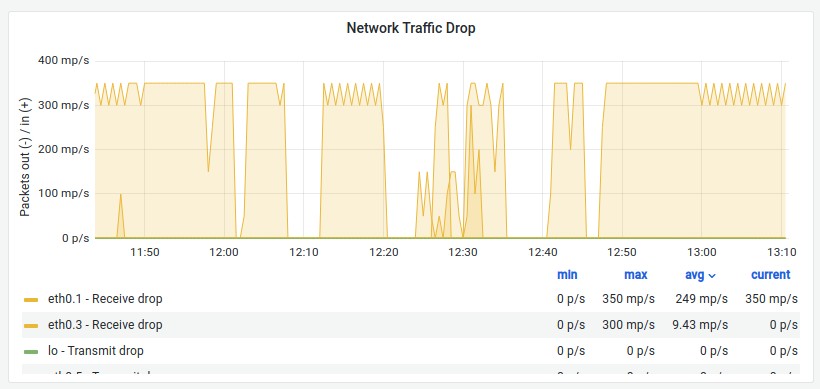
I am using it more or less as a single nic firewall with mwan3 (4G + starlink uplinks) all vlan segmented, and 3 vlans behind it. All works fine in general, but I see a huge(?) traffic network drop on my 1st vlan.
Does anybody have a hint how I could find that issue ? Is it an issue ?
thank you and best regards, Oliver
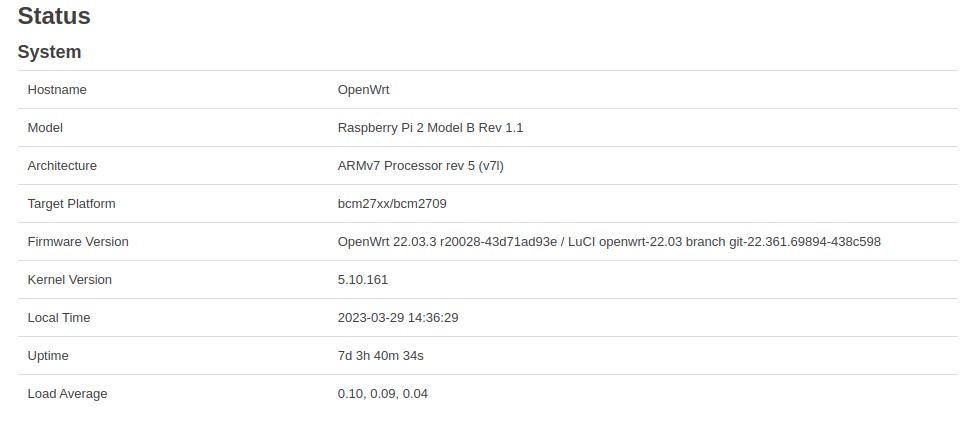
what device ?
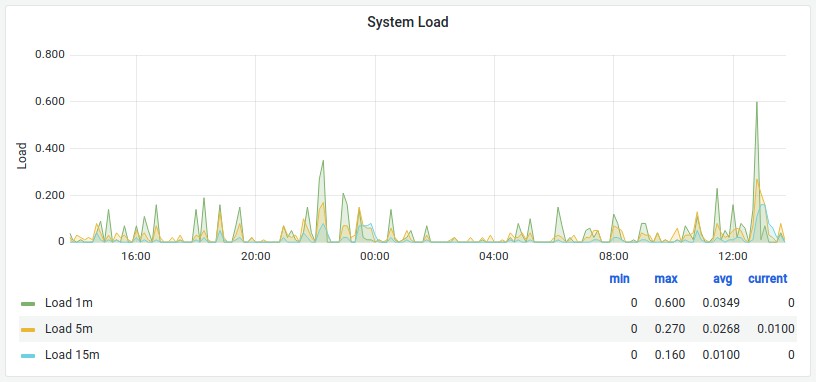
what does htop say about the CPU load ?
CPU and all looks IMO .. ? At the moment its on a RPi3
What are you using to create these graphs?
Its Prometheus, the prometheus server is on another RPi4
1 Like
These times with NO traffic drops was when I started wireshark and the interface entered promiscious mode I think .. as far as I understand, in that case the NIC doesnt see the network drops anymore, but the software stack will drop them, unfortunately not a fix it seems ?
Is that too much ? Should be reasonable, huh ?
lanzared:
Is that too much ?
I meant the actual connections below, listed from largest, descending, not the grap
The UDP spike indicates DNS looksups were enabled. You run an old version or hit the lookup button
Also:
Otherwise your comment about promiscuous mode is confusing.
Can your Internet links handle the outbound traffic bandwidth needs?
not sure ? 4G has ~50mbit up/down, starlink maybe (disappointing) 20mbit up/down
oh dear .. Its a RPi2 .. I thought I had used one of the RPi3's ..
lanzared:
oh dear .. Its a RPi2
I meant OpenWrt...that's not relevant to your issue.
The I assume you meant running wireshark on some unidentified client. That shouldn't have caused the graph anamoly.
I ran wireshark via ssh from another linux desktop
Ssh - command line
OpenWrt != OS_with_GUI
So your screenshot of "Wireshark to port 22" had completely lost me, but cool software. I'm guessing this is a module to Wireshark and you're getting this data from the router, which is 192.168.1.5 I assume?
this still doesnt explain how the 2 machines relate to the spike on the graph
This "negative" spike (!) I have no idea, but as soon as I start wireshark capturing from my desktop, the network drops .. well .. drop.
Desktop 192.168.1.200
Desktop runs wireshark and gets its capture in realtime from OpenWRT, and in that time, no network drops anymore ..
The prometheus server is on some other RPi4, doing graphs/stats for our solar panels also, so I did put the graphs for openwrt as addition.
No, its no SNMP, its the prometheus exporters openwrt has aboard, just install them, and let prometheus scrape them. Then of course, you may need/want a grafana to have shiny dashboards.
Well...you are sending 2x of the traffic to your desktop at the moment.
Cool.
Can you use ifconfig and report if you see errors, drops, overruns, collisions, etc. there on any OpenWrt interfaces?
What are you doing to test traffic once you begin capturing?
lleachii:
You use SNMP?
Correct, I use Cacti to graph routers, it accepts SNMP.
lleachii:
Can you use ifconfig and report if you see errors, drops, overruns, collisions, etc. there on any OpenWrt interfaces?
root@OpenWrt:~# ip -s link show eth0.1
28: eth0.1@eth0: <BROADCAST,UP,LOWER_UP> mtu 1500 qdisc noqueue state UP mode DEFAULT group default qlen 1000
    link/ether b8:27:eb:f2:de:d0 brd ff:ff:ff:ff:ff:ff
    RX:  bytes packets errors dropped  missed   mcast
      64946269  630242      0    2689       0      27
    TX:  bytes packets errors dropped carrier collsns
    1220857206 1043011      0       0       0       0
root@OpenWrt:~#
root@OpenWrt:~# ip -s link show eth0
2: eth0: <BROADCAST,UP,LOWER_UP> mtu 1500 qdisc fq_codel state UP mode DEFAULT group default qlen 1000
    link/ether b8:27:eb:f2:de:d0 brd ff:ff:ff:ff:ff:ff
    RX:   bytes   packets errors dropped  missed   mcast
    89684657244 116317320      0    1258       0       0
    TX:   bytes   packets errors dropped carrier collsns
    94447712798 115769101      0       0       0       0
root@OpenWrt:~#
lleachii:
What are you doing to test traffic once you begin capturing?
Nothing special, there is always some traffic so I just "wait".
Your output only seems to show VLAN 1 (eth0.1) and the PHY (eth0).
ip -s link show eth0.3
or
ifconfig will show everything inquired about.
lanzared:
Nothing special,
There's a serious amount special, there's dropped packets - and they don't
BTW, what Interface is Internet?
Also, am I to interpret mp/s as milipackets?
Internet Interfaces are eth0.4 and eth0.5
root@OpenWrt:~# ifconfig
eth0      Link encap:Ethernet  HWaddr B8:27:EB:F2:DE:D0
          inet6 addr: fe80::ba27:ebff:fef2:ded0/64 Scope:Link
          UP BROADCAST RUNNING  MTU:1500  Metric:1
          RX packets:116380286 errors:0 dropped:1258 overruns:0 frame:0
          TX packets:115831911 errors:0 dropped:0 overruns:0 carrier:0
          collisions:0 txqueuelen:1000
          RX bytes:89720803755 (83.5 GiB)  TX bytes:94487455726 (87.9 GiB)

eth0.1    Link encap:Ethernet  HWaddr B8:27:EB:F2:DE:D0
          inet addr:192.168.1.5  Bcast:192.168.1.255  Mask:255.255.255.0
          inet6 addr: fe80::ba27:ebff:fef2:ded0/64 Scope:Link
          UP BROADCAST RUNNING  MTU:1500  Metric:1
          RX packets:655811 errors:0 dropped:2955 overruns:0 frame:0
          TX packets:1078194 errors:0 dropped:0 overruns:0 carrier:0
          collisions:0 txqueuelen:1000
          RX bytes:68057186 (64.9 MiB)  TX bytes:1250081227 (1.1 GiB)

eth0.2    Link encap:Ethernet  HWaddr B8:27:EB:F2:DE:D0
          inet addr:10.2.0.1  Bcast:10.2.0.255  Mask:255.255.255.0
          inet6 addr: fe80::ba27:ebff:fef2:ded0/64 Scope:Link
          UP BROADCAST RUNNING  MTU:1500  Metric:1
          RX packets:12435 errors:0 dropped:0 overruns:0 frame:0
          TX packets:40549 errors:0 dropped:0 overruns:0 carrier:0
          collisions:0 txqueuelen:1000
          RX bytes:2425326 (2.3 MiB)  TX bytes:45294328 (43.1 MiB)

eth0.3    Link encap:Ethernet  HWaddr B8:27:EB:F2:DE:D0
          inet addr:10.3.0.1  Bcast:10.3.0.255  Mask:255.255.255.0
          inet6 addr: fe80::ba27:ebff:fef2:ded0/64 Scope:Link
          UP BROADCAST RUNNING  MTU:1500  Metric:1
          RX packets:91950 errors:0 dropped:46 overruns:0 frame:0
          TX packets:205609 errors:0 dropped:0 overruns:0 carrier:0
          collisions:0 txqueuelen:1000
          RX bytes:24410228 (23.2 MiB)  TX bytes:236247325 (225.3 MiB)

eth0.4    Link encap:Ethernet  HWaddr B8:27:EB:F2:DE:D0
          inet addr:100.72.248.224  Bcast:100.127.255.255  Mask:255.192.0.0
          inet6 addr: fe80::ba27:ebff:fef2:ded0/64 Scope:Link
          UP BROADCAST RUNNING  MTU:1500  Metric:1
          RX packets:348947 errors:0 dropped:0 overruns:0 frame:0
          TX packets:184167 errors:0 dropped:0 overruns:0 carrier:0
          collisions:0 txqueuelen:1000
          RX bytes:395493257 (377.1 MiB)  TX bytes:30042274 (28.6 MiB)

eth0.5    Link encap:Ethernet  HWaddr B8:27:EB:F2:DE:D0
          inet addr:172.23.100.2  Bcast:172.23.100.7  Mask:255.255.255.248
          inet6 addr: fe80::ba27:ebff:fef2:ded0/64 Scope:Link
          UP BROADCAST RUNNING  MTU:1500  Metric:1
          RX packets:346474 errors:0 dropped:0 overruns:0 frame:0
          TX packets:201980 errors:0 dropped:0 overruns:0 carrier:0
          collisions:0 txqueuelen:1000
          RX bytes:346285722 (330.2 MiB)  TX bytes:49714590 (47.4 MiB)

lo        Link encap:Local Loopback
          inet addr:127.0.0.1  Mask:255.0.0.0
          inet6 addr: ::1/128 Scope:Host
          UP LOOPBACK RUNNING  MTU:65536  Metric:1
          RX packets:654003 errors:0 dropped:0 overruns:0 frame:0
          TX packets:654003 errors:0 dropped:0 overruns:0 carrier:0
          collisions:0 txqueuelen:1000
          RX bytes:52346066 (49.9 MiB)  TX bytes:52346066 (49.9 MiB)

root@OpenWrt:~#
I just think your graph resized scaling and everything is/was fine.