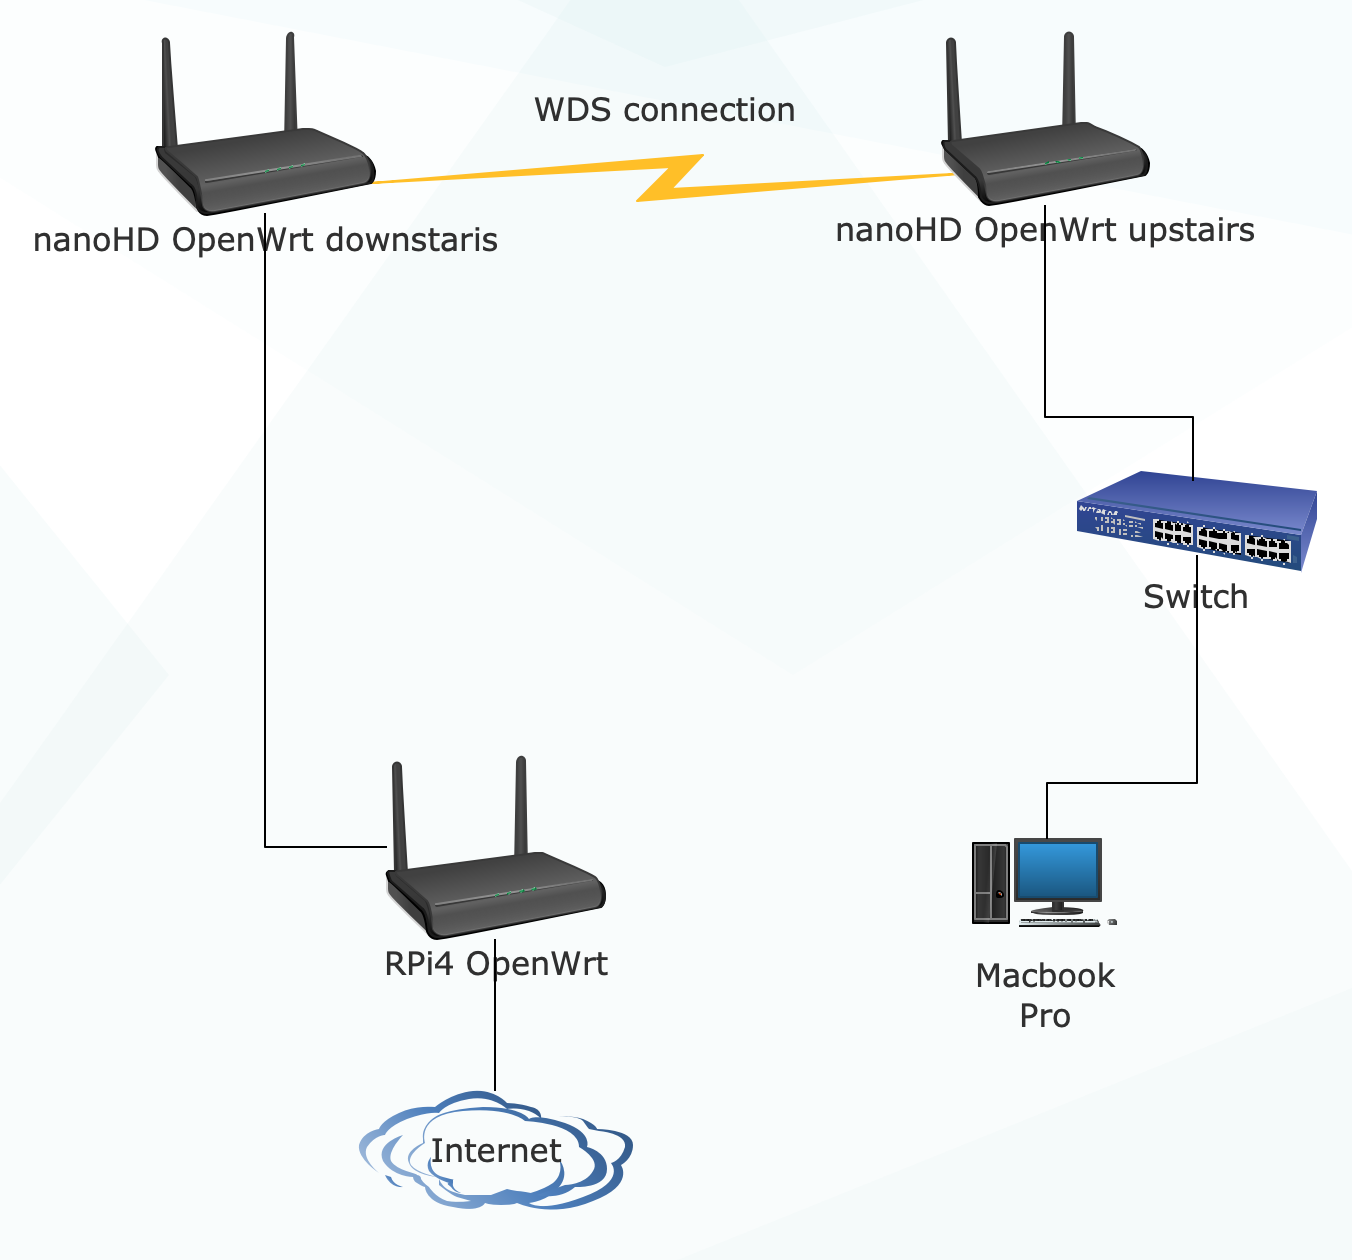
Let me explain what I'm seeing but first my network topology:
Cable modem <-> RPi4 OpenWrt <-> Dumb AP downstairs (WDS) <-> Dump AP upstairs (WDS) <-> ER-X switch <-> Macbook Pro
Note: ER-X is running Ubiquiti software and acting just like a switch for convenience.
This is what I'm observing, investigating why my Parsec host was seeing congestion on the wireless network when there was no traffic, I found this interesting thing:
When I test UDP traffic from the Macbook Pro with a conservative bandwidth (250 Mbps) there is no traffic lost.
You really don't provide enough information on the AP and network setup (e.g. we don't know if all devices are connected by wire or some by wireless)
I don't see "high" nor "weird" loss, because if I understand your topology document correctly - testing from the Macbook you get a thru-and-thru speetest of your full 250 Mbps with 0% loss
The device wasn't really designed to Tx/Rx traffic to itself...I would simply say your Macbook has more CPUs for the task
And here lays the weird thing. Why when connected to upstairs AP via an ER-X switch utilising Ethernet can I achieve 0% loss against my RPi4 router and when SSHing in to upstairs AP and running there iperf3 I cannot?
Okay, would you be so kind as to elaborate?
Curiosity, or hunger for knowledge, whatever you prefer, mate. And because looks related to my issues with Parsec in my household.
OK...again, I'm trying to see an issue (you did mention the Parsec - so ok...).
Ummm...It's a router/AP, not a client like a Macook with a big CPU for tasks ran on it. I've never heard of people using a router like a personal computer, except in weird niche cases...and most speedtest sites suggest against it. Lastly not knowing exactly how the device connects to the WLAN internally, how you bridged it, etc. - that could differ too.
What is that (a box...software...I know it has something to do with gaming)???
Does it run on OpenWrt???
I'm not sure why you now relate the Parsec issue when you show that the Macbook indeed works. Perhaps I should ask "what is host was seeing 'congestion'..given you proceed to say 'no traffic'?
Also...you don't provide information on where/how the Parsec is connected. Is it on the same Macbook that didn't have an issue?
Yes, not relevant at this time. My focus is first sorting the difference in throughput.
Clearly I did a poor job explaining myself. I'm not using my upstairs AP as a computer, I imagine that I confused you mentioning Parsec. I'm trying to triage what's wrong with my Parsec host connected to the WiFi in my household when there is good WiFi channel separation, environment free of noise and not activity in the network. What I described is something weird -to me- and I think is linked to the issues I see in my Parsec workflow as it is UDP traffic.
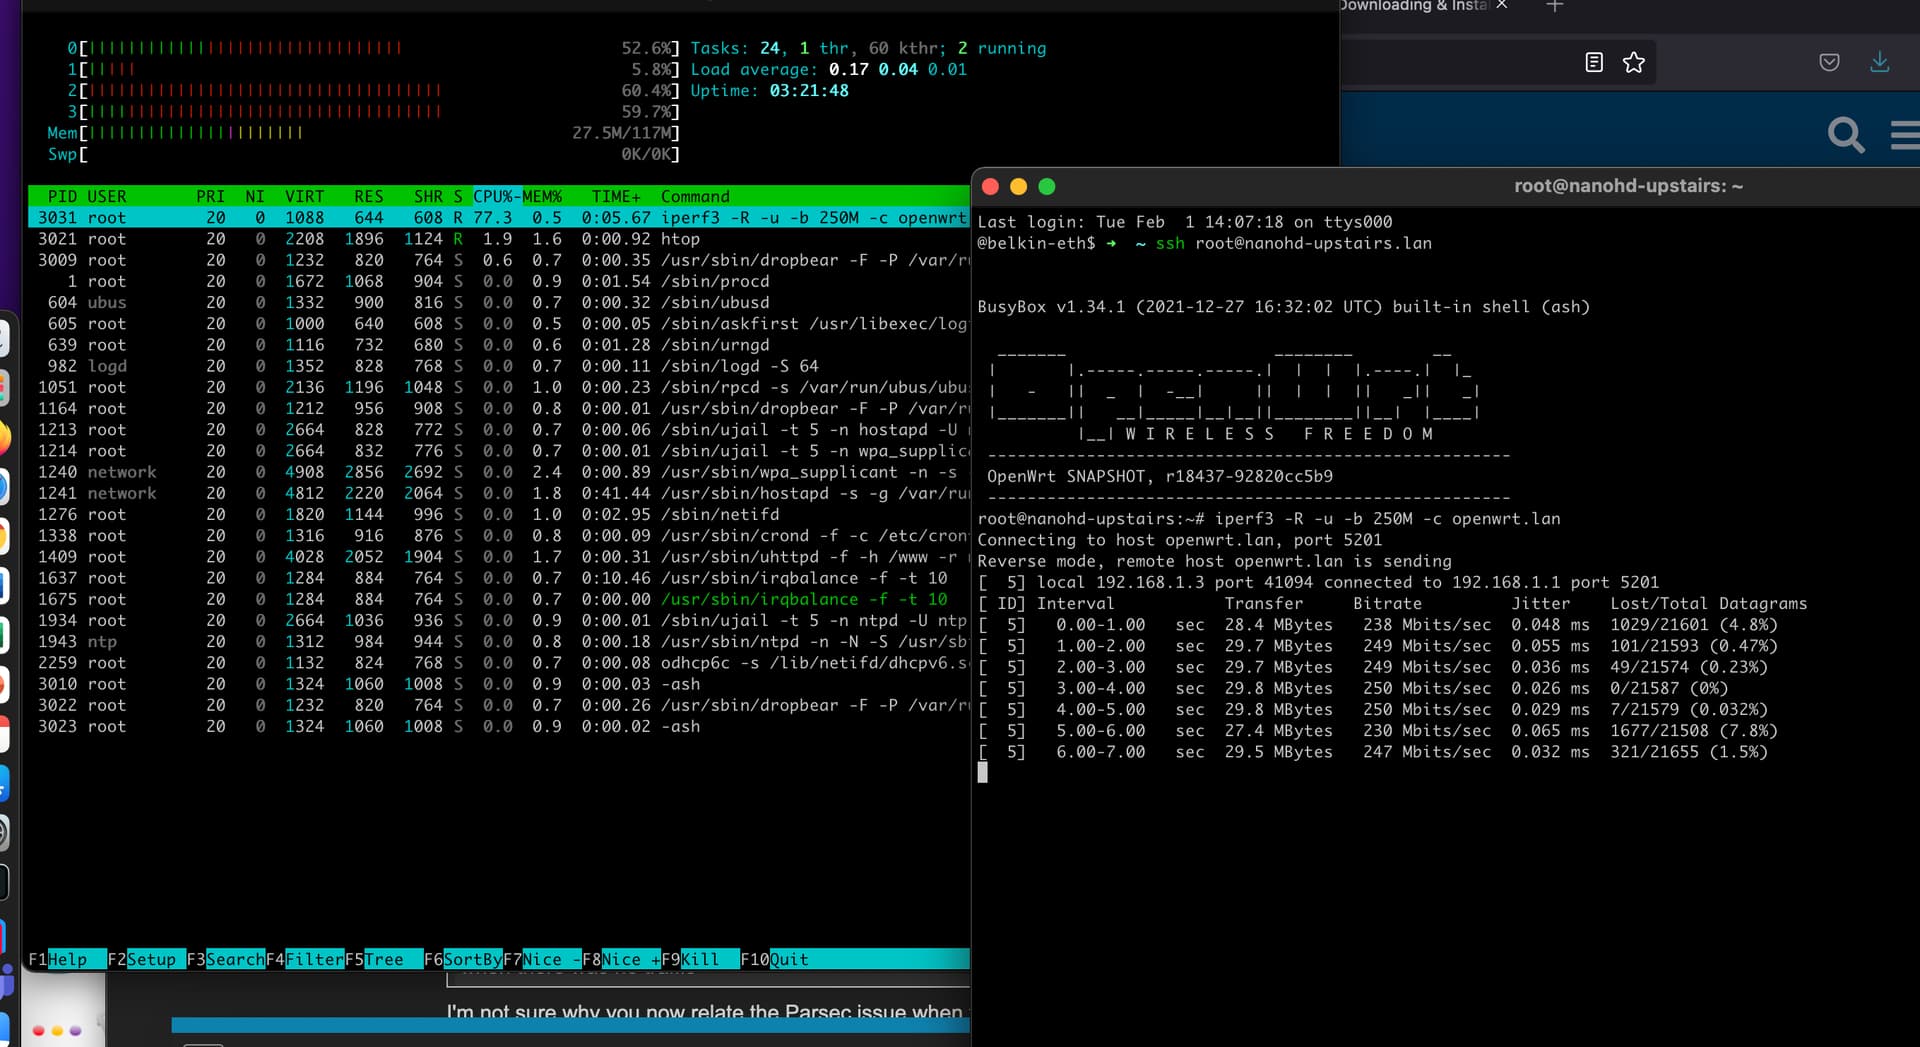
I updated my original post with a nice graph, so I hope it is clear now how the device connects to my LAN. All connections are gigabit. CPU is not maxed, just checked -again- during a test, see below:
Parsec is an application that allows to connect to the host (Win10) is installed in remotely, the difference with RDP is that it streams the screen using UDP and allows for low latency remote work. My Parsec host is in a different computer connected to the very same switch my Macbook Pro is. This is my interim solution to work with it while I fix this, if I can.
By "no traffic", I meant no additional traffic to the test traffic.
So you're really testing a just-mentioned Windows 10 machine not on the diagram...cool.
So you're:
running RDP; and
a Parsec session too?
So...this is Parsec traffic or iperf3?
Most importantly, given your issue is with a Windows 10 machine...what does a iperf3 on the Windows 10 machine itself (i.e. the one with the actual problem) show?
Mmm... nope. I'm not. I'm testing why an iperf3 test on machine connected via Ethernet to my AP is getting not UDP packet loss compared to SSH in the AP and running the same test against the same router, as per the diagram. Please, ignore Parsec. I regret mentioning it now.
Where did I say so exactly? No, I'm not, please, I insist, ignore Parsec.
I always referred to iperf3 traffic, even posted the results in my OP. BTW, thanks for trying to help find out what's going on.
Well, if you are not concerned, I've already noted - this is an issue with running speedtests on embedded devices like an AP/router...especially when you have a bridge to a VLAN. I noted some advise and suggest against it; but for some software, it actually violates their End User License Agreement (e.g. the speedtest.net command line program).
With an 800 MHz Dual Core, you're about at it's speed limit when the CPU is involved (e.g. LAN-to-WAN firewall NATing orrunning software on the CPU to Tx/Rx traffic in your case)...but you noted it as conservative.
So, my only suggestion was to:
test the same device with wlan0 on it own interface
ensure Packet Steering and/or offloading is enabled (I believe your device does offloading thru OpenWrt - not sure)
It seems that the link between the AP upstairs and the router downstairs travels across a WDS radio link. Radio links lose packets due to interference it's just normal for radio links. If there are interfering radios perhaps from neighbors or etc you might expect up to several percent, and also reduced throughput.
Hi, @dlakelan,
Thanks for chiming in, if you check my graph both tests travel between the WDS radio link. So, why the one executed in the MBP connected via Ethernet to the switch and the one executed inside the nanoHD OpenWrt upstairs AP leveraging a SSH connection are different?
Yeah, interesting. But I do think that the AP is unlikely to be able to handle the CPU traffic created by running iperf3 to generate and sink packets (in addition to moving the packets around). Running iperf3 on the AP itself is likely overtaxing it.
you could ssh into it in a second session and run top -d 1 and look at the "idle" percentage, which should stay well above 10% to be free of CPU bottleneck.
it looks to me like you're probably maxing out the 2 real cores.
Adding up the individual thread occupancy numbers and dividing by 2: (52.6+5.8+60.4+59.7)/2 = 89% and that could easily mean that one of the cores is saturated doing something while the other has 10% of its cycles free.