Just upgraded from 19.07 to 21.04rc4 on my DIR0860L. Saw this new Channel Analysis page.
As soon as I opened the page all WiFi clients were disconnected and scanning started. This is not expected/user-friendly behavior. Opening a Luci page should not kill my WiFi.
There should be a Start Scan button and client-disconnection warning, or something.
I had a similar experience to @cmn - after opening the channel analysis page, there was a burst of kernel warnings/errors in my system log, then all of my wifi clients disconnected and reconnected.
Device information:
Model	TP-Link Archer C7 v2
Architecture	Qualcomm Atheros QCA9558 ver 1 rev 0
Firmware Version	OpenWrt 21.02.0 r16279-5cc0535800 / LuCI openwrt-21.02 branch git-21.231.26241-422c175
Kernel Version	5.4.143
The errors and client disconnects were happening on wlan0 which is the 5ghz wifi device. I believe the driver is ath10k_pci.
Here is a sample of some errors:
ath10k_pci 0000:00:00.0: SWBA overrun on vdev 0, skipped old beacon
ath10k_pci 0000:00:00.0: Cannot communicate with firmware, previous wmi cmds: 36954:14963752 36904:14963701 36904:14963701 36904:14963534, jiffies: 14964480, attempting to fake crash and restart firmware, dev-flags: 0x42
ath10k_pci 0000:00:00.0: SWBA overrun on vdev 0, skipped old beacon
ath10k_pci 0000:00:00.0: failed to transmit management frame via WMI: -143
ath10k_pci 0000:00:00.0: failed to send wmi nop: -143
ath10k_pci 0000:00:00.0: could not request stats (type -268435456 ret -143 specifier 1)
ath10k_pci 0000:00:00.0: firmware crashed! (guid 901103f3-c355-467a-aa4a-dbddafa59d11)
ath10k_pci 0000:00:00.0: qca988x hw2.0 target 0x4100016c chip_id 0x043202ff sub 0000:0000
ath10k_pci 0000:00:00.0: kconfig debug 0 debugfs 1 tracing 0 dfs 1 testmode 0
ath10k_pci 0000:00:00.0: firmware ver 10.1-ct-8x-__fW-022-ecad3248 api 2 features wmi-10.x,has-wmi-mgmt-tx,mfp,txstatus-noack,wmi-10.x-CT,ratemask-CT,regdump-CT,txrate-CT,flush-all-CT,pingpong-CT,ch-regs-CT,nop-CT,set-special-CT,get-temp-CT,tx-rc-CT,cust-stats-CT,retry-gt2-CT,txrate2-CT,beacon-cb-CT,wmi-block-ack-CT crc32 3e4cf97f
There is quite a bit more debugging info in the logs, but I'm not sure how much is helpful.
When I open Channel Analysis / radio0 (5Ghz) then, after about 5 seconds, the graph for the 'Local Interface' appears. However, it does not display any other neighbouring channels / SSIDs in use - I left it running for over 20 minutes with no change.
When I open Channel Analysis / radio1 (2.4GHz), the graph shows a list of over 130 channels / SSIDs in use, and keeps updating regularly (about once every 3 seconds).
This is on a TP-Link Archer C2600 running 21.02. I did not spot any errors reported in the logs.
I'd like to be able to use Channel Analysis to choose a reasonable 5GHz channel to use avoiding congestion, as I live in a very high density area. This facility has been very helpful with the 2.4GHz band.
I'm on a Netgear R7800 & have the exact same behavior. I did find a solution:
• 5GHz scans, but clients will be booted off
• clients, but no 5GHz survey results
If you are comfortable with ssh-ing into your router:
Find your wireless network name
iwinfo
Find the 5GHz entry with
Type: nl80211 HW Mode(s): 802.11nac
To get a survey & boot clients:
/sbin/ifconfig wlan0 down
Substitute your result in step 1 for 'wlan0'
You'll get new results every few seconds (my 5GHz is every 8 seconds or so; more stations take more seconds)
When you are done - if you do nothing & walk away - your clients won't be able to connect. So you need to do this (and sacrifice survey results):
I tried running the luci scan several further times and did not see a repeat of the above errors.
After reading through the full history of this posting, for radio0 / 5GHz I ran
ubus call iwinfo scan '{"device":"radio0"}'
The results are
{
        "results": [

        ]
}
While if I run for radio1 / 2.4Ghz, I get a long list of SSIDs / channels.
[updated]
As a further experiment, I disabled the 5GHz SSID while the Channel Analysis was running. luci quickly picked up a list of neighbouring 5GHz SSIDs / channels.
Then I enabled the 5GHz SSID again and the Channel Analysis continued to display and to update.
And later again, in luci I went to the Overview for a few seconds and then back to Channel Analysis. It seems to work correctly. Also ubus call iwinfo scan '{"device":"radio0"}' shows a long list.
In conclusion, I think that this is not an issue in luci but somewhere deeper in the WiFi stack.
I'm on 'auto', currently channel 100. I've seen similar behaviour on channels 36, 52 and 116.
Also, I'm seeing that the behaviour around disabling the 5GHz SSID does not consistently enable scanning. So I'm moderately sure that either there is a hardware bug or the ath10k_pci driver for the TP-Link Archer C2600 is not completely initialising some values at startup.
If it definitely happens on channel 36 (set statically, not auto) then it isn't likely what I said was the issue.
When the issue is happening you could check on the CLI whether you can manually scan.
iwinfo wlan0 scan
I need to check if it's doable in current luci... Wonder if I should change the logic and sort the data with channel by default.
I need to find time to add this feature... My current idea is: Make a first scan on page load and add a button to redo the scan. Should fix all the problems and make the data readable. About the exporting stuff... What do you mean? Can you elaborate?
I mean to create a (e.g.) comma separated file containg the table and downloading it to a local PC. Or, probably more easily, a new page containing the table data formatted in a way that I can copy-to-clipboard from the browser and paste it to my PC text editor...
Hi. First of all, many thanks for this wonderful feature.
While trying to find the best wifi channel I copied the data to an Excel file, removed networks with very low signal strength and counted the networks per channel. After that I created clusters based on the bandwidths and selected the channel with least AP per bandwidth and set this manually in the settings.
I was wondering if it is possible/planned to add a "channel rating" feature taking also the bandwidth into account? That would help a lot for manual channel selection.
Am on OpenWrt SNAPSHOT r22537-32f134fbdf / LuCI Master git-23.093.56957-2145121 using the D-Link DAP-X1860 A1 as wifi repeater configured with relayd.
I want to give feedback. Something is wrong.
I did three scans.
The first scan
I encountered some kind of error, when I tried to switch from radio0 (2.4GHz) to radio1 (5GHz), without the scan having finished yet on the 2.4GHz, but I don't remember the exact error message. Edit: I think it was something along the lines as described in following comment: New OpenWrt installation on a TP-Link Archer C7 v2 is slow - speed cut in half - #20 by wrtuser77. Getting logged out when trying to access "Overview". Also, the scans took a long time (DFS channels?).
I tried to scan again.
The second scan
This time it worked. Scan on both bands finished successfully. Surprisingly and contrary to my expectation, no clients disconnected, BUT...
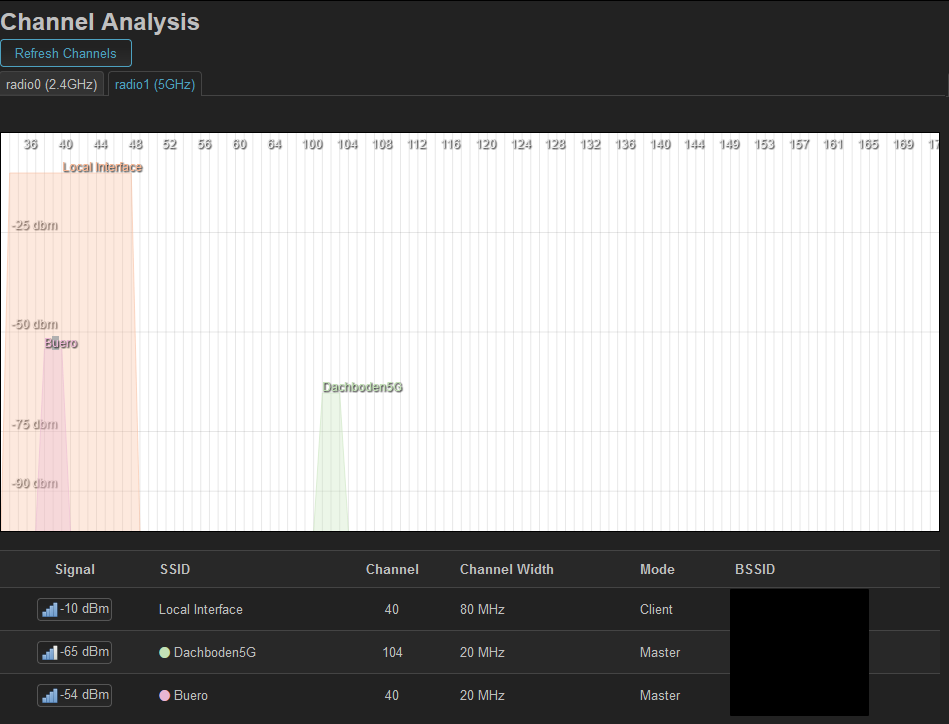
Can someone explain these results? I configured Buero to run at channel 40 and Dachbogen5G at channel 104 both with 80 MHz channel bandwidth.
Here they are depicted as 20 MHz. My Wifi analyzer app (VREM version) on my phone depicts them with 80 MHz.
Also, I expected my clients to disconnect from radio1 (5GHz). I was still able to browse the web. Might have been slower than usual, but there were no disconnects, which is good!
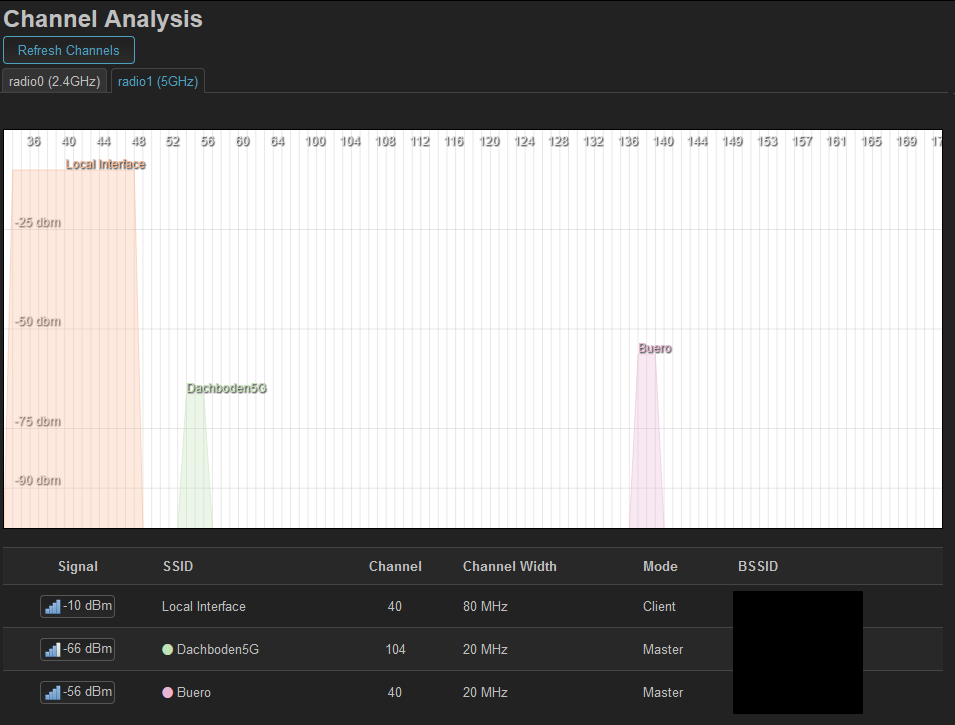
The third scan
Wanting to confirm and reproduce the crash, I did another scan and tried switching from 2.4 GHz to 5 GHz while the 2.4 GHz scan was still running. This time the 5 GHz scan was successful though (no crash!) and following came up: