I hope someone could direct me, I have a problem with Openwrt on WRT1200AC. for a half year it was working perfectly, now it has problem described below. I have reset the router, reconfigured it manually from scratch on newer Openwrt version, same symptoms.
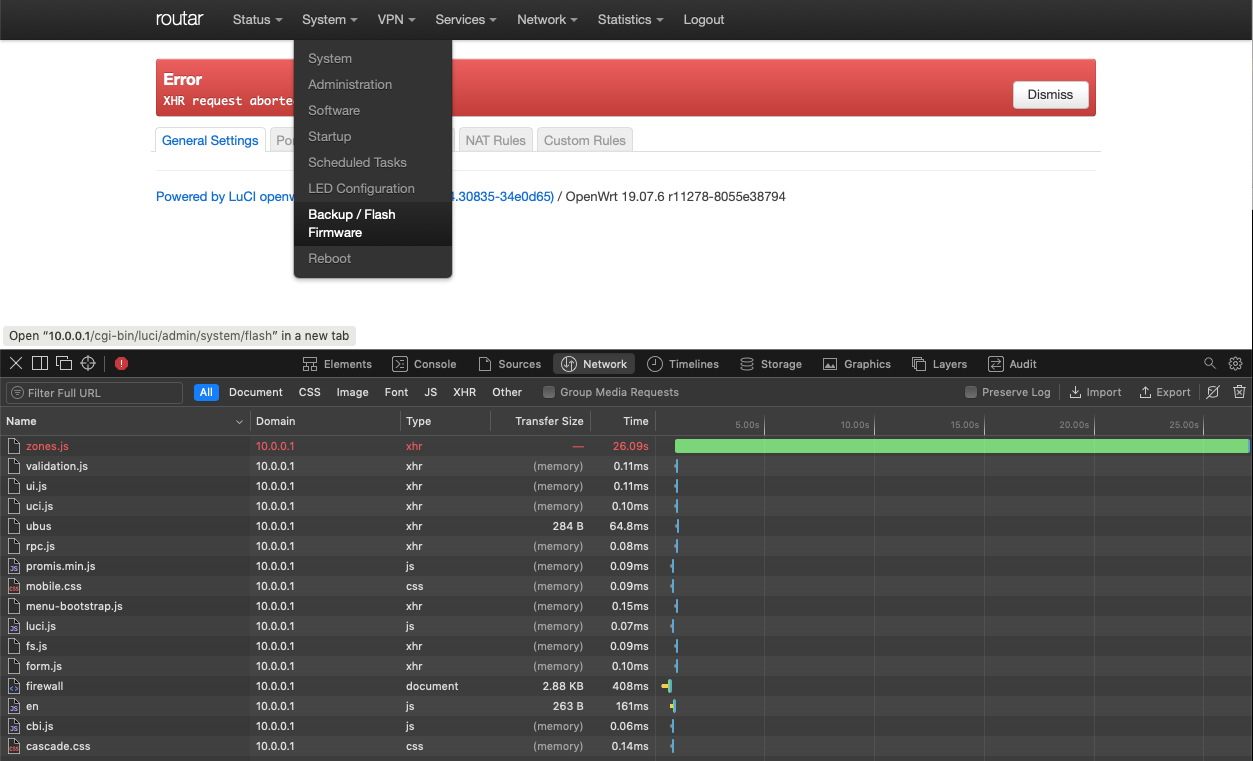
LUCI is extremely laggy, there are many timeouts on most of the page loads (attached). Sometimes new ssh session cannot be started (there is no password prompt and ssh client times out), but existing ssh session is working fine - and clients do not see any problem, I have no problems reaching 800Mbps downloads, no ping has been lost.
problem occurs on LAN and wifi, no difference in that
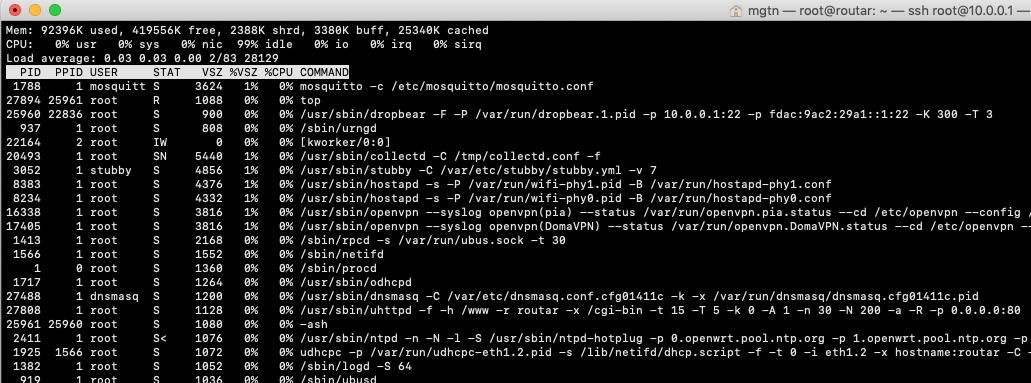
I was watching top output during the lags, there is plenty of memory free, cpu is at 99% idle, I have literally no idea what is going on. It usually times out on ubus or rpc timeouts but that's no rule, it hanged also on cgi-exec
What I have configured is here
dnsmasq forwarded to 127.0.0.1#5453 (stubby)
/etc/config/network wan section contains option dns '127.0.0.1'
vpn client
vpn server
vpn-policy-routing configured
adblock
note that turning of any/all of these things above had no effect on the behaviour
I'm not an expert in networking but managed to get all working half year ago. I have never experienced this before on this router.
Is there anything to dig into? I believe this is not the problem with uhttpd, this is a bit deeper imho, but I don't know where to look at. Any logging that could be turned on?
I have done some modifications for testing like disable ubusauth, raise timeouts, max_requests, setting http_keepalive to zero but did not help in any way
if you've had this firmware running snappily in the past... reset to defaults and disabled the above as mentioned...
the only feasable explanations are browser/cache/ssl drama or config formatting issues... ( firewall? or something half stale like switched wan from pppoe to dhcp and left some remnants ) although typically I would not expect them to manifest purely/within luci... ( edit: failing flash / hardware is possible though less likely culprit )
if you'd told me the client symptoms and not mentioned openwrt... from a networking point of view there are feasible reasons for such symptomatology...
otherwise... you need to reassess what exactly you've done and provide more information... odd's on, you're overlooking some changes you've made...
in all honesty though... flashing a new build ( with all fresh config! ) is alot easier than trying to work out why something that was great 6 months ago is no longer great...
then you need to be checking local resolution ( /etc/hosts, ethers, interface server settings )... otherwise you can tcpdump the connection from the router side... or maybe try ubus monitor...
one of them is bound to show something... probably start with tcpdump would be wisest...
yeah it sounds weird, doesn't it? I cannot understand why would this happen on a freshly built server and why it happened after half year without changing anything.
heh, now I wanted to do the tcpdump trace and start ubus monitor. But luci responds lightning fast now... I have to wait until the problem starts again, I cannot find any pattern in this behaviour.
There is most probably a troll biting the cable when I need to work with it
I'll get back to this thread when I have something in hand. Thanks for letting me know about the ubus monitor, now I know that ubus exists so I can move a bit closer to the thing.
thanks a lot, I'll reply
If it happens out of the blue, I would discard a issue on the router itself. And re-reading your post, it does not look like a duplicate address in your network, either. Sorry.
10.0.0.1 is the router and 10.0.0.7 is the web browser client
i was browsing first to Status > Overview, then switched to Status > Firewall. Both took too much time to load
setting wireshark filter to "tcp.stream eq 12" I can see several retransmissions but I don't know why they had to be sent so many times and why the router did not ack back right away
its a start... but you really need to capture from the router... and all traffic (well sorting for router ip/mac in srcdst and probably just br-lan would be ok for a start) not just that session...
good news is you now have something to search for in the larger capture... and see whats around those tcp-retranmissions... ( windows update is in the capture and it can chew some serious cpu and some bandwidth... if it's wifi go into the ap connection settings and set it to metered )
you should probably also check client+router interfaces for drops/error rates... split the issue between upper and lower level issues...
So how many client machines are in the network ? Would it be possible to disconnect them one by one when the problem occurs next time ?
Or at what daytimes does the problem occur ?
Does it also happen at times where there is no load on the system ?
What about pings to the openwrt host ? Are they laggy, too ?
Could you run a ping job on another machine that regularly measures the ping response times to see maybe a pattern here ?
there are cca 20-30 active devices on the network. 50% wired, 50% wireless, approximately. I will try to plug the cables off tomorrow when I see the lag, good idea.
I have node-red running on my network, I have just set up ping every second, I'll look tomorrow at the graph. The daytime is not relevant it seems. likewise, the system load does not have an effect on this
I have turned off an rclone job which made my "sirq" at 20%. Now the CPU is almost on 0% but the behaviour is that laggy like before.
looking at the packet trace it looks to me that http server did not manage to respond with ACK. There are many tcp retransmission but I'm not expert in this so I don't know what this mean.
I'll come up tomorrow with more answers. The router is quite powerful but I don't think it's ok for it to reboot faster than logging on into luci. It reboots so fast that Netflix clients don't notice. but logging into luci takes a minute
thanks a lot Stefan. this is a really strange thing, I cannot imagine what that is ...
found the culprit. I was taking capture file and saw thousands of connections to MQTT broker on my openwrt router. The source was failed script that created new and new connections, hundreds per second. Script has been taken down, mosquitto broker restarted and all seems to work properly again.
Pity I did not take capture without the port filter before, I could save everyone's time. Thanks for helping guys