Collectd-mod-openvpn

I've got OpenVPN (as a server) configured working fine. I've also got luci-app-statistics working fine. However, I can't figure out what's wrong with the statistics plugin for openvpn info (collectd-mod-openvpn). It looks like it must be collecting something, but the actual images luci are broken. Images for all other (collectd) plugins are working just fine. Is anyone else having this problem?

That plugin is probably not that widely used, so you might not get that many answers. The support for that plugin was added by @jow in 2015, so he is your best bet to check if the app itself currently works ok with the current collectd and current openvpn.

You should also use "rrdtool dump" to look into the actual database where data is collected. That might help you understanding if you have configured that plugin correctly (i.e. does correctly looking data get collected). You can see in the database the collected data for each measurement, and for each time period that get averaged and saved.

As example, this is how the memory stats RRD database starts:
(in /tmp /rrd/ROUTERNAME/openvpn/... )

root@OpenWrt:~# rrdtool dump /tmp/rrd/OpenWrt/memory/memory-free.rrd  | head -n 40
<!-- Round Robin Database Dump -->
<rrd>
        <version> 0001 </version>
        <step> 30 </step> <!-- Seconds -->
        <lastupdate> 1517000663 </lastupdate> <!-- 2018-01-26 23:04:23 EET -->

        <ds>
                <name> value </name>
                <type> GAUGE </type>
                <minimal_heartbeat> 60 </minimal_heartbeat>
                <min> 0.0000000000e+00 </min>
                <max> 2.8147497671e+14 </max>

                <!-- PDP Status -->
                <last_ds> UNKN </last_ds>
                <value> 9.1798159360e+09 </value>
                <unknown_sec> 0 </unknown_sec>
        </ds>

<!-- Round Robin Archives -->
        <rra>
                <cf> AVERAGE </cf>
                <pdp_per_row> 1 </pdp_per_row> <!-- 30 seconds -->
                <xff> 1.0000000000e-01 </xff>

                <cdp_prep>
                        <ds><value> NaN </value>  <unknown_datapoints> 0 </unknown_datapoints></ds>
                </cdp_prep>
                <database>
                        <!-- 2018-01-26 22:04:30 EET / 1516997070 --> <row><v> 4.0332438187e+08 </v></row>
                        <!-- 2018-01-26 22:05:00 EET / 1516997100 --> <row><v> 4.0287327573e+08 </v></row>
                        <!-- 2018-01-26 22:05:30 EET / 1516997130 --> <row><v> 4.0253904213e+08 </v></row>
                        <!-- 2018-01-26 22:06:00 EET / 1516997160 --> <row><v> 4.0254450347e+08 </v></row>
                        <!-- 2018-01-26 22:06:30 EET / 1516997190 --> <row><v> 4.0262970027e+08 </v></row>
                        <!-- 2018-01-26 22:07:00 EET / 1516997220 --> <row><v> 4.0242653867e+08 </v></row>

Thanks for the reply. I can see that there is some data in there, but a bunch of NaN as well for (I suppose) when there is no OpenVPN traffic.

For example:

	<cf> AVERAGE </cf>
	<pdp_per_row> 1 </pdp_per_row> <!-- 30 seconds -->
	<xff> 1.0000000000e-01 </xff>

	<cdp_prep>
		<ds><value> NaN </value>  <unknown_datapoints> 0 </unknown_datapoints></ds>
		<ds><value> NaN </value>  <unknown_datapoints> 0 </unknown_datapoints></ds>
	</cdp_prep>
	<database>
		<!-- 2018-01-25 19:09:00 EST / 1516925340 --> <row><v> 0.0000000000e+00 </v><v> 0.0000000000e+00 </v></row>
		<!-- 2018-01-25 19:09:30 EST / 1516925370 --> <row><v> 3.5724444444e+01 </v><v> 4.7146666667e+01 </v></row>
		<!-- 2018-01-25 19:10:00 EST / 1516925400 --> <row><v> 9.8242222222e+01 </v><v> 1.2965333333e+02 </v></row>
		<!-- 2018-01-25 19:10:30 EST / 1516925430 --> <row><v> NaN </v><v> NaN </v></row>
		<!-- 2018-01-25 19:11:00 EST / 1516925460 --> <row><v> NaN </v><v> NaN </v></row>
		<!-- 2018-01-25 19:11:30 EST / 1516925490 --> <row><v> NaN </v><v> NaN </v></row>
		<!-- 2018-01-25 19:12:00 EST / 1516925520 --> <row><v> NaN </v><v> NaN </v></row>
		<!-- 2018-01-25 19:12:30 EST / 1516925550 --> <row><v> NaN </v><v> NaN </v></row>
...

There is NaN for those periods where there is no data. Initially the whole database is NaN.

You should look at the rrd data and try to figure out if the stats in the database are right. If yes, then it is about the LuCI stats graph rules of open VPN plugin.

Your example looks a bit curious: based by the timestamps, you have first a period of data collection, then empty NaN, (and then data again?). It should be first NaN and then the actual data for the later periods.

One explanation might be delayed NTP time fixing, so that the router first starts with old clock time, collects a few data cycles, then sets the time via NTP and then continues collecting data with a new clock time, leaving a NaN gap betwen in the data. (As routers do not have RTC clocks, the router always starts from a wrong time.) To decrease that gap in the database for analysis purposes, you should touch a files in /etc , e.g. "touch /etc/banner" and then reboot, so that the router starts from a relatively correct timestamp.

How are the images broken?
no image? just a cross in browser?
or empty chart image without actual data?

And are you using master or 17.01? (master uses a new collectd, so the openvpn data format may have changed, rendering the stats definition invalid)

I also have the same problem... all collectd works perfectly except openvpn ones, which shows broken image icon.

I have the same problem. installed the plugin, had to manually edit luci_stats config file to enable the plugin. it created files under collects directory in /tmp/rrd/OpenWrt but no images are rendering (just the broken image icon) and the RRD database has all NaN despite active VPN traffic.

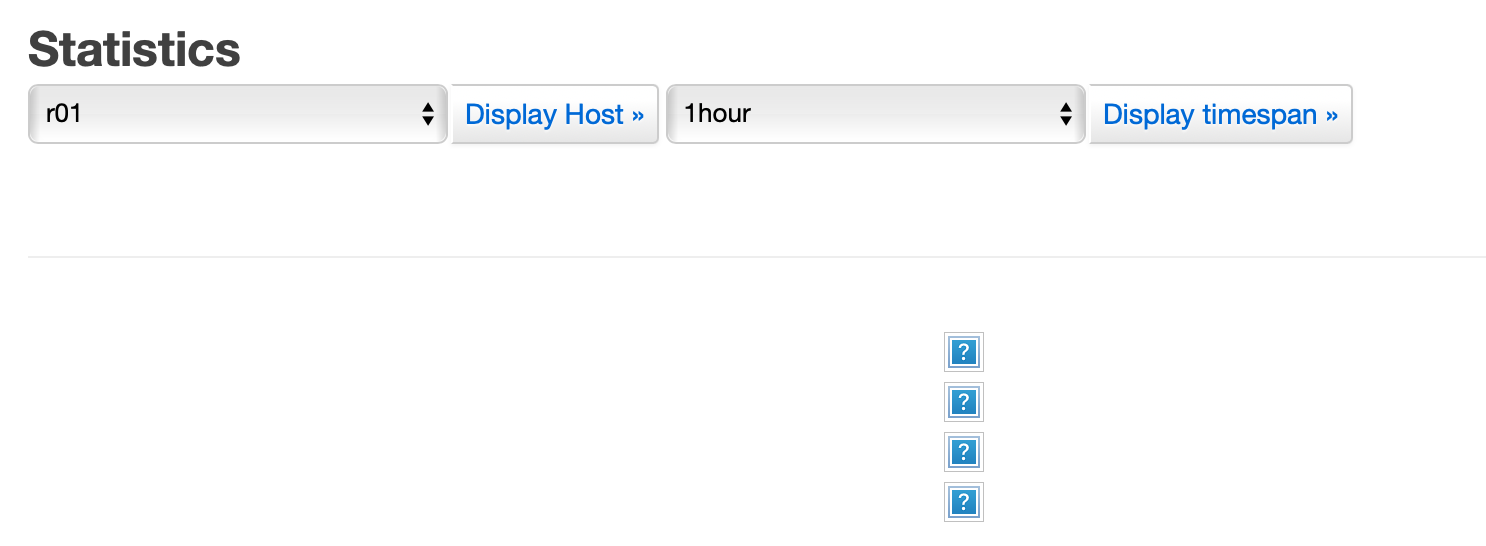
Same here, images are "broken":


And the red files are filled with "NaN" "data".
I have pointed it at correct OpenVPN status file in setup tab.

1 Like

Resuming the thread. The problem is still there and it seems it affects openvpn server entries, while client entries works ok

I have exactly the same problem, it appears that data is collected, but all images are broken

1 Like

Has anyone solved this problem?

We are in 2023 and this issue is still unresolved. What is the point of offering this plugin at all?

1 Like

I have the same trouble in 2024...

Sad :cry: