May be similar to LUCI slow down to death (WR1043N V1) but that thread went off in a different direction.
I have a number of routers:
BT Homehub 2a - OpenWrt Chaos Calmer 15.05 / LuCI (git-15.248.30277-3836b45)
BT Homehub 2b - OpenWrt Chaos Calmer 15.05 / LuCI (git-15.248.30277-3836b45)
BT Homehub 5a LEDE Reboot 17.01.0 r3205-59508e3 / LuCI lede-17.01 branch (git-17.051.53299-a100738)
None have DSL connected.
2A: (bcm63xx/HOMEHUB2A (0x6358/0xA1) - 64M Ram
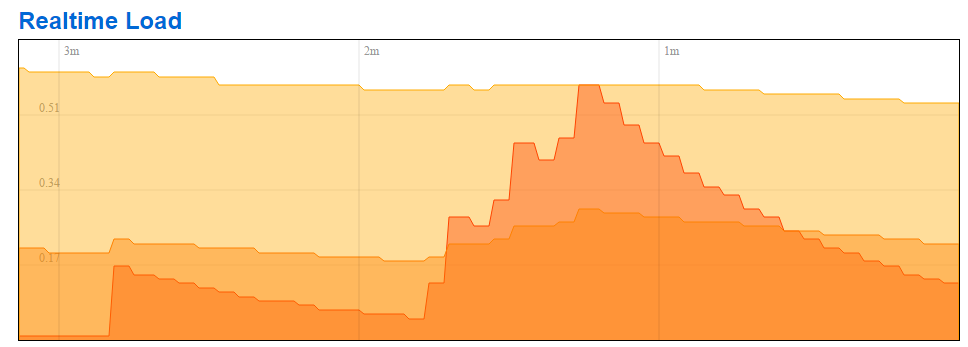
If the Overview screen is open with auto-refresh on, 'Load Average' climbs rapidly to >>2
turn off auto refresh, and load average falls fairly quickly.
top does not indicate excessive CPU usage.
BUT; it only does this when it get's into a certain state... maybe Overview open for a long time?
(i.e. whilst writing this, I turned off auto-update to test, messed with XHR.js, put the changes back, and now can't reproduce...)
2B: (Danube rev 1.5) - 64M Ram
If the Overview screen is open, aggressively refreshing (F5) can cause 'Load Average' to climb, but with just auto-refresh, it falls again.
top shows /sbin/dsl_cpe_control using cpu cycles as expected.
BUT; as above, I'm sure this router exhibited the same issue yesterday...
5A: (xRX200 rev 1.2) - 128M Ram
If the Overview screen is open with auto-refresh on, 'Load Average' climbs rapidly to >>2
if dsl_control is disabled in startup, and the unit rebooted, then it manages to cope; but i'm sure I've had a situation where it did not. It's almost as though 'something goes wrong' to trigger a state where multiple processes end up waiting on the same resource.
At first I blamed the DSL firmware/code, but now after finding it on both lantiq and broadcom, it feels more like a bug in the code called by the luci polling; but looking through the script I've not got enough experience to identify an issue. However, if it is just purely that luci polling ends up starting multiple 'polls' because one takes longer than a second to service, then maybe a change in the polling style would solve it - the xhr.js, when looked deeply, is fairly complex.
If anyone else is experiencing unexplained high 'Load Average' figures, the simple workaround is don't leave the Overview page open with auto-refresh turned on. But it would be good to get to the bottom of the issue...
Update:
I left to make coffee; come back to the 2A after 15 minutes to 'Load Average' at >2
turning off auto refresh caused it to fall, turn back on, caused it to rise again.
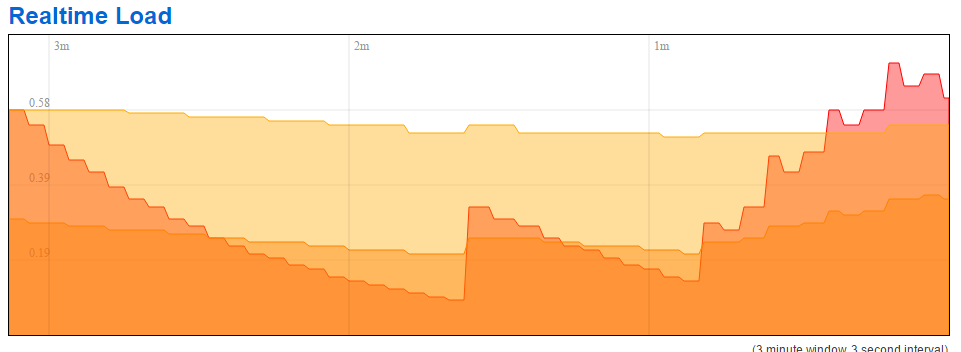
Shift-F5 in the browser, and it's now falling (with auto-refresh on).
It soon started to rise again, this time two shift-F5 to get it to calm down.
I do note in chrome developer tools that there are two luci polls in progress every 5 seconds (status and dyndns); on this router they take ~2.3s to service. but there is no apparent difference in response or poll style between 'rising' mode and 'not rising' mode. (I have a large hosts dataset it reads every time...). I also note that on the 2B, there is only one luci request in flight at a time (no dyndns). On the 5A (currently behaving), one poll at a time; and LEDE seems to alternate between status and hosts data.
 Damn. I understand. Maybe the time brings the solution
 ).
).