I 100% agree that active measurement on LTE is costly, and passive measurement to be preferred. That said, how to get there? one thought has been (within cake) to snapshot the last 1sec of bandwidth on the event of a drop or mark and punt that to userspace to do "something" with it, along with a passive measurement utility (pping), or use some sort of tc rule to gather that data.
2 Likes
as for the the measure without going to 8..8.8.8 idea, you send out a udp packet to some known-too-distant-location with a ttl of 1,2, or 3, and measure the time it takes to get back a icmp unreachable message.
1 Like
@moeller0 I finally have had a chance to work on this this evening. Things are looking positive - I believe with further tweaking this could lead to a viable solution. I hammered it this evening with Amazon Prime, multiple .iso downloads and waveform bufferbloat tests, and the bandwidth variations seemed to make sense to me.
I think I have discovered that with my LTE connection the useable bandwidth is not just a function of time. It is more complicated. As the connection gets used, the useable bandwidth appears to creep up - perhaps because the connection between modem and cell tower gets optimised upon heavy use. I think this tends to favour a simple algorithmic approach like we have been developing.
Here is my latest code:
#!/bin/sh

# sqm-autorate
# based on algorithm proposed by @moeller0 of OpenWrt
# requires iputils-ping, coreutils-date and coreutils-sleep

max_ul_rate=35000
min_ul_rate=25000

max_dl_rate=60000
min_dl_rate=20000

tick_duration=1

alpha_RTT_increase=0.1
alpha_RTT_decrease=0.9

rate_adjust_RTT_spike=0.1
rate_adjust_load_high=0.01
rate_adjust_load_low=0.005

load_thresh=0.5

max_delta_RTT=10

rx_bytes_path="/sys/class/net/wan/statistics/rx_bytes"
tx_bytes_path="/sys/class/net/wan/statistics/tx_bytes"

read -d '' reflectors << EOF
1.1.1.1
8.8.8.8
EOF

no_reflectors=$(echo "$reflectors" | wc -l)

RTTs=$(mktemp)

function get_avg_RTT {

for reflector in $reflectors;
do
        echo $(ping -i 0.01 -c 10 $reflector | tail -1 | awk '{print $4}' | cut -d '/' -f 2) >> $RTTs&
done
wait
avg_RTT=$(echo $(cat $RTTs) | awk '{ total += $2; count++ } END { print total/count }')
> $RTTs
}

function update_rates {
        get_avg_RTT
        delta_RTT=$(echo "scale=10; $avg_RTT - $prev_avg_RTT" | bc)

        if [ $(echo "$delta_RTT>=0" | bc) -eq 1 ]; then
                prev_avg_RTT=$(echo "scale=4; (1-$alpha_RTT_increase)*$prev_avg_RTT+$alpha_RTT_increase*$avg_RTT" | bc)
        else
                prev_avg_RTT=$(echo "scale=4; (1-$alpha_RTT_decrease)*$prev_avg_RTT+$alpha_RTT_decrease*$avg_RTT" | bc)
        fi

        cur_rx_bytes=$(cat $rx_bytes_path)
        cur_tx_bytes=$(cat $tx_bytes_path)
        t_cur_bytes=$(date +%s.%N)

        rx_load=$(echo "scale=10; (8/1000)*(($cur_rx_bytes-$prev_rx_bytes)/($t_cur_bytes-$t_prev_bytes)*(1/$cur_dl_rate))"|bc)
        tx_load=$(echo "scale=10; (8/1000)*(($cur_tx_bytes-$prev_tx_bytes)/($t_cur_bytes-$t_prev_bytes)*(1/$cur_ul_rate))"|bc)

        t_prev_bytes=$t_cur_bytes
        prev_rx_bytes=$cur_rx_bytes
        prev_tx_bytes=$cur_tx_bytes

        if [ $(echo "$delta_RTT > $max_delta_RTT" | bc -l) -eq 1 ]; then
                cur_dl_rate=$(echo "scale=10; $cur_dl_rate-$rate_adjust_RTT_spike*($max_dl_rate-$min_dl_rate)" | bc)
                cur_ul_rate=$(echo "scale=10; $cur_ul_rate-$rate_adjust_RTT_spike*($max_ul_rate-$min_ul_rate)" | bc)
        fi

        if [ $(echo "$delta_RTT < $max_delta_RTT && $rx_load > $load_thresh" |bc) -eq 1 ]; then
                cur_dl_rate=$(echo "scale=10; $cur_dl_rate + $rate_adjust_load_high*($max_dl_rate-$min_dl_rate)"|bc)
        fi

        if [ $(echo "$delta_RTT < $max_delta_RTT && $tx_load > $load_thresh" |bc) -eq 1 ]; then
                cur_ul_rate=$(echo "scale=10; $cur_ul_rate + $rate_adjust_load_high*($max_ul_rate-$min_ul_rate)"|bc)
        fi

        if [ $(echo "$delta_RTT < $max_delta_RTT && $rx_load < $load_thresh" |bc) -eq 1 ]; then
                cur_dl_rate=$(echo "scale=10; $cur_dl_rate - $rate_adjust_load_low*($max_dl_rate-$min_dl_rate)"|bc)
        fi

        if [ $(echo "$delta_RTT < $max_delta_RTT && $tx_load < $load_thresh" |bc) -eq 1 ]; then
                cur_ul_rate=$(echo "scale=10; $cur_ul_rate - $rate_adjust_load_low*($max_ul_rate-$min_ul_rate)"|bc)
        fi

        if [ $(echo "$cur_dl_rate<$min_dl_rate" | bc) -eq 1 ]; then
                cur_dl_rate=$min_dl_rate;
        fi

        if [ $(echo "$cur_ul_rate<$min_ul_rate" | bc) -eq 1 ]; then
                cur_ul_rate=$min_ul_rate;
        fi

        if [ $(echo "$cur_dl_rate>$max_dl_rate" | bc) -eq 1 ]; then
                cur_dl_rate=$max_dl_rate;
        fi

        if [ $(echo "$cur_ul_rate>$max_ul_rate" | bc) -eq 1 ]; then
                cur_ul_rate=$max_ul_rate;
        fi

        printf "%12.2f\t%12.2f\t%12.2f\t%12.2f\t%12.2f\t%12.2f\t%12.2f\n" $rx_load $tx_load $prev_avg_RTT $avg_RTT $delta_RTT $cur_dl_rate $cur_ul_rate
}


get_avg_RTT

prev_avg_RTT=$avg_RTT;

cur_dl_rate=$min_dl_rate
cur_ul_rate=$min_ul_rate

t_prev_bytes=$(date +%s.%N)

prev_rx_bytes=$(cat $rx_bytes_path)
prev_tx_bytes=$(cat $tx_bytes_path)

printf "%12s\t%12s\t%12s\t%12s\t%12s\t%12s\t%12s\t%12s\n" "rx_load" "tx_load" "prev_avg_RTT" "avg_RTT" "delta_RTT" "cur_dl_rate" "cur_ul_rate"

while true
do
        t_start=$(date +%s.%N)
        update_rates
        tc qdisc change root dev wan cake bandwidth "$cur_ul_rate"Kbit
        tc qdisc change root dev veth-lan cake bandwidth "$cur_dl_rate"Kbit
        t_end=$(date +%s.%N)
        sleep_duration=$(echo "$tick_duration-($t_end-$t_start)"|bc)
        if [ $(echo "$sleep_duration > 0" |bc) -eq 1 ]; then
                sleep $sleep_duration
        fi
done
I have found that it is better to create three adjust ratios:
- rate_adjust_RTT_spike (for when RTT spikes)
- rate_adjust_load_high (for when load is high)
- rate_adjust_load_low (for when load is low)
I found I needed higher resolution timing. So I installed coreutils-date and coreutils-sleep in order to get nanoseconds in the date and also sleep accurately.
I have set tick duration to 1 second.
The parameters that I have so far settled on are as follows:
tick_duration=1

alpha_RTT_increase=0.1
alpha_RTT_decrease=0.9

rate_adjust_RTT_spike=0.1
rate_adjust_load_high=0.01
rate_adjust_load_low=0.005

load_thresh=0.5

max_delta_RTT=10
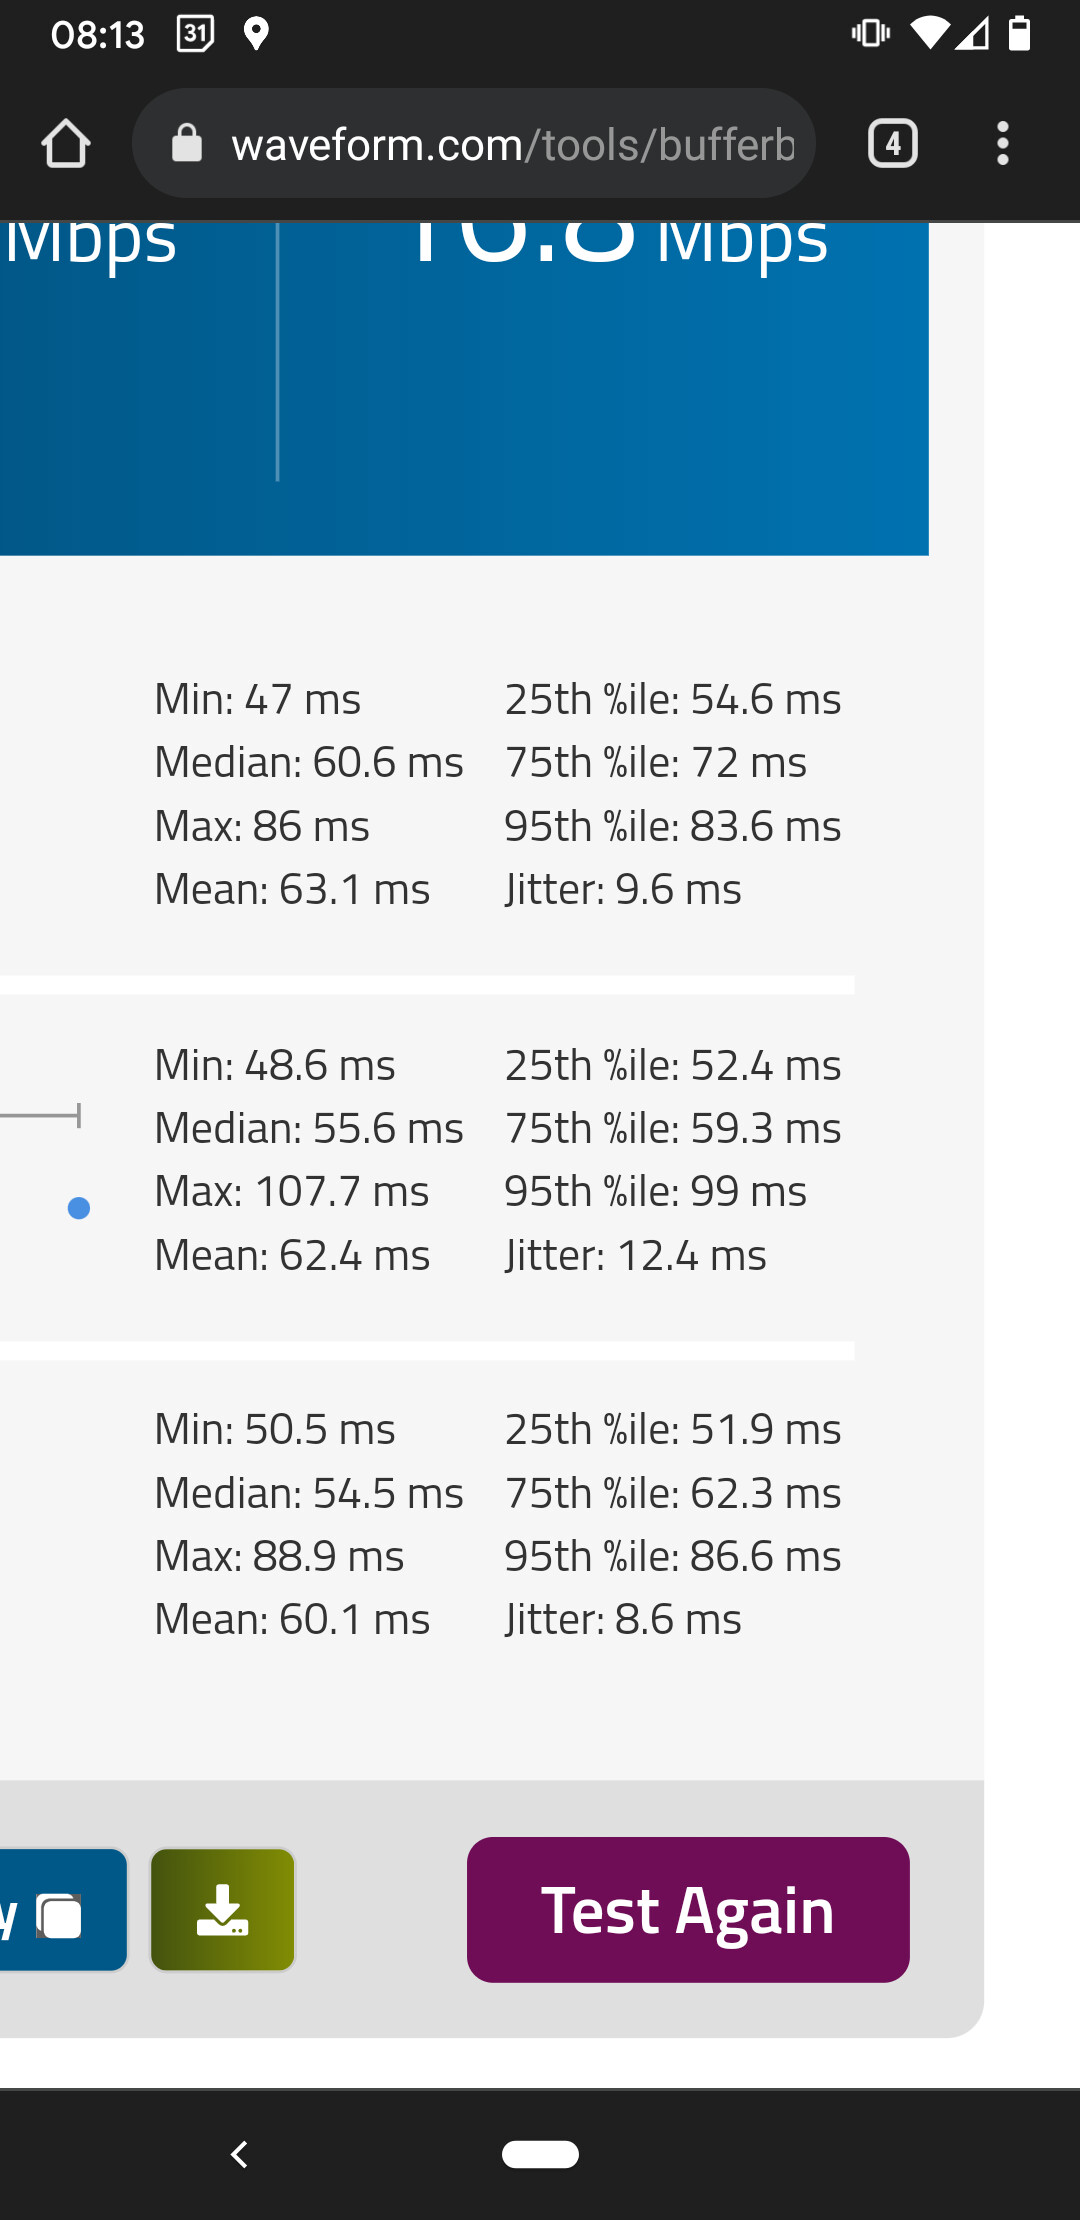
Here is some sample output:

I wonder if the prev_avg_RTT fluctuation above is pointless. I mean I can see by eye that it should be circa 50ms. Maybe I need to further reduce the adjust up alpha.
I may still change these significantly, but for me I am pretty much at the point where I think I should put this script into a service file and have it run in the background because this will offer an improvement over just lumping for 30 MBit/s all the time.
There are a few pretty significant RTT spikes as you can see. I need to try to work on avoiding that because I presume those might be sufficient to result in stutters in zoom/teams.
Any thoughts?
1 Like
Quick note, I am not affiliated with the OpenWrt project, I am just a user on this forum like you are. I think that is what you want to express, but I want to avoid ambiguity here. ![]()
Glad that you have something that works. I can see why with such small rate adjustment steps you need to run more often.
I wonder whether for the RTT @dlakelan's idea of getting a consensus from several sources (5 or 7) might not be more robust (so calculate the avg RTT for each source independently and then take the median value) the rationale being that every single ICMP reflector might have more urgent things to do than respond to your probes, but real congestion on your access link will affect all ICMP reflectors (which might justify to even take the minimum average RTT of the set, but my gut feeling is voting should be more robust).
2 Likes
@Lynx, I think you can make what @dtaht suggested about UDP traffic and @moeller0 about having an average per reflector and finally a median with this to lines of code:
Replace
echo $(/usr/bin/ping -i 0.01 -c 10 $reflector | tail -1 | awk '{print $4}' | cut -d '/' -f 2) >> $RTTs&
with
echo $(mtr -G 0.01 -c 10 -n -l -i 0.01 -m 3 -u $reflector | grep "p 2" | cut -d ' ' -f 3 | awk '{ a[i++] = $0 ; s += $0} END { print s/i }') >> $RTTs&
and replace
avg_RTT=$(echo $(cat $RTTs) | awk '{ total += $2; count++ } END { print total/count }')
with
avg_RTT=$(echo $(cat $RTTs) | sort -n | awk '{ a[i++] = $0 ; s += $0 } END { print (a[int(i / 2)] + a[int((i - 1) / 2)]) / 2 / 1000 }')
That will do. For this I use mtr sending UDP probes, mtr returns values in microseconds and that's why I divide the median by 1,000 before updating avg_RTT.
I tested it in my computer -just for fun- to cater for WiFi downloads buffer bloat and looks like it works, I'm using 4 reflectors, 2 are ipv4 and 2 are ipv6.
1 Like
Wow, fantastic thanks!
Regarding your test did you tweak any of the parameters or just use the ones I have temporarily settled on? I haven't entirely settled on these - it is just they seemed to give reasonable results on my LTE connection. So are you running on client devices rather than router?
Can you elaborate on the UDP traceroute idea? I don't yet understand the underlying concept there.
I am keen to test this, but do not seem to have mtr. I see the package here:
But opkg has no knowledge of it on my system as the latter command in:
opkg update
opkg list |grep -i mtr
returns nothing.
This is with 'OpenWrt SNAPSHOT r17815-66cbf5fd4' on an RT3200:
I started a github repository here:
And I have already put in your edits (although I have not tested these yet).
1 Like
OK I tested it, but @amteza we need a change given that I am sometimes seeing:
awk: cmd. line:1: Division by zero
I don't understand what mtr does yet, but I can recreate by just running:
root@OpenWrt:~# mtr -G 0.01 -c 10 -n -l -i 0.01 -m 3 -u 8.8.8.8 | grep "p 2" | cut -d ' ' -f 3 | awk '{ a[i++] = $0 ; s += $0} END { print s/i }'
43176.8
root@OpenWrt:~# mtr -G 0.01 -c 10 -n -l -i 0.01 -m 3 -u | grep "p 2" | cut -d ' ' -f 3 | awk '{ a[i++] = $0 ; s += $0} END { print s/i }'
awk: cmd. line:1: Division by zero
Does it still make sense to define and use the multiple 'reflectors'? And what should these be set to?
I chose some reasonable reflectors in my script you could look there, it was stuff like Google DNS, Facebook, cloudflare, akamai, etc should be near the bottom of my script.
It's perhaps worth it to use increase across multiple reflectors to avoid responding when a given single reflector is busy or congested
Thanks. Do you get the mtr stuff? I'm a bit lost with that.
mtr is a program that runs a traceroute and collects statistics along the path, so it will do the work of collecting ping statistics for you.
In this line:
you ask mtr to do a traceroute without specifying a destination, so it borks
Yeah I did that deliberately to see if that would trigger the divide by zero and it did. So in the script I presume it gives the divide by zero because the packet gets lost or dropped or something?
But what is the motivation to use mtr rather than ping? And does it make sense in that event to have multiple destinations that are too far away for it to work as described above?
I haven't followed too carefully the idea, but I think if you call mtr you can have it do the stats for you, hence you don't have to do "median" in shell script or awk or something.
the part about sending packets with insufficient time to live is that it can let you probe intermediate locations along the path. that's how traceroute works, but you can do it with UDP packets as well.
All IP packets carry information for how many hops a packet is to be forwarded (time to live TTL in IPv4, Hop limit in IPv6) this is initially set to sone value <= 255 and then decremented by one by each node handling the packet once this reaches zero the packet is dropped and an ICMP message is send to the senders address informing of that event. This is how MTR and traceroute probe the RTT of intermediate hops: e.g. when probing 8.8.8.8 it will send a packet with TTL=1 which the next IP router will need to decrement, and since it reached zero that hop generates an ICMP message and sends it back, stopping the time between sending the TTL=1 packet and receiving the ICMP (type: either Time exceeded, or Destination unreachable) gives a proxy for the RTT to that hop (proxy because ICMP generation will take some time and is occasionally rate-limited and/or deprioritized and hence this RTT >= the true path RTT to that hop, but this is the best we can get, and often pretty good). Traceroute MTR, will basically send packets with increasing TTL-values until the final target is reached and hence can give you RTTs to all IP hops along the path. Now there is some slack in that e.g. MPLS nodes in a route will by default not decrement the TTL and hence will be invisible for traceroute, but as I said that generally works pretty well.
Since the TTL/Hop limit fields is part of the IPv[4|6] header this will work pretty much independent of the transport protocol used (TCP/UDP/ICMP).
The beauty of doing this is that it should allow to get RTTs from closer network elements wich give better readings; my hunch though is that using a set of known well connected/CDNd servers should be pretty usable as well.
Mmmh I see:
root@turris:~# opkg find mtr
mtr - 0.93-1 - mtr combines the functionality of the 'traceroute' and 'ping' programs
 in a single network diagnostic tool.
 As mtr starts, it investigates the network connection between the host
 mtr runs on and a user-specified destination host. After it
 determines the address of each network hop between the machines,
 it sends a sequence ICMP ECHO requests to each one to determine the
 quality of the link to each machine. As it does this, it prints
 running statistics about each machine.
1 Like
Hi, there. Sorry about that, I'm not sure why you are seeing the error (update: when you don't get ping results it happens, you can filter it, though). To be completely honest I did some changes to the script so mine is a bit different, see below:
#!/bin/ash
#shellcheck shell=dash

# sqm-autorate
# based on algorithm proposed by @moeller0 of OpenWrt
# requires mtr, coreutils-date and coreutils-sleep

# select interfaces to use with sqm
RX_INTERFACE="ifb4eth0"
TX_INTERFACE="eth0"

max_ul_rate=46000
min_ul_rate=46000

max_dl_rate=950000
min_dl_rate=200000

tick_duration=1

alpha_RTT_increase=0.1
alpha_RTT_decrease=0.9

rate_adjust_RTT_spike=0.1
rate_adjust_load_high=0.01
rate_adjust_load_low=0.005

load_thresh=0.5

max_delta_RTT=10

rx_bytes_path="/sys/class/net/$RX_INTERFACE/statistics/rx_bytes"
tx_bytes_path="/sys/class/net/$TX_INTERFACE/statistics/tx_bytes"

# read reflectors addressess
read -r reflectors << EOF
1.1.1.1
8.8.8.8
2606:4700:4700::1111
2001:4860:4860::8888
EOF

# ready temp file
RTTs=$(mktemp)

# get median RTT from reflectors
get_med_RTT() {
        for reflector in $reflectors; do
                # average RTT of 10 udp pings to DNS reflectors in microseconds
                mtr -c 10 -G 0.1 -i 0.01 -m 3 -l -u -P 53 "$reflector" | grep 'p 2' | awk '{ a[i++] = $3 ; s += $3} END { print s/i }' >> "$RTTs" &
        done
        wait

        # sort RTTs and get median in milliseconds
        med_RTT=$(sort -n < "$RTTs" | awk '{ a[i++] = $0 ; s += $0 } END { print (a[int(i / 2)] + a[int((i - 1) / 2)]) / 2 / 1000 }')

        # empty temp file
        echo -n "" > "$RTTs"
}

update_rates () {
        get_med_RTT
        delta_RTT=$(echo "scale=10; $med_RTT - $prev_med_RTT" | bc)

        if [ "$(echo "$delta_RTT >= 0" | bc)" -eq 1 ]; then
                prev_med_RTT=$(echo "scale=4; (1-$alpha_RTT_increase)*$prev_med_RTT+$alpha_RTT_increase*$med_RTT" | bc)
        else
                prev_med_RTT=$(echo "scale=4; (1-$alpha_RTT_decrease)*$prev_med_RTT+$alpha_RTT_decrease*$med_RTT" | bc)
        fi

        cur_rx_bytes=$(cat $rx_bytes_path)
        cur_tx_bytes=$(cat $tx_bytes_path)
        t_cur_bytes=$(date +%s.%N)

        rx_load=$(echo "scale=10; (8/1000)*(($cur_rx_bytes-$prev_rx_bytes)/($t_cur_bytes-$t_prev_bytes)*(1/$cur_dl_rate))" | bc)
        tx_load=$(echo "scale=10; (8/1000)*(($cur_tx_bytes-$prev_tx_bytes)/($t_cur_bytes-$t_prev_bytes)*(1/$cur_ul_rate))" | bc)

        t_prev_bytes=$t_cur_bytes
        prev_rx_bytes=$cur_rx_bytes
        prev_tx_bytes=$cur_tx_bytes

        # process delta
        if [ "$(echo "$delta_RTT > $max_delta_RTT" | bc)" -eq 1 ]; then
                cur_dl_rate=$(echo "scale=10; $cur_dl_rate-$rate_adjust_RTT_spike*($max_dl_rate-$min_dl_rate)" | bc)
                cur_ul_rate=$(echo "scale=10; $cur_ul_rate-$rate_adjust_RTT_spike*($max_ul_rate-$min_ul_rate)" | bc)
        elif [ "$(echo "$delta_RTT < $max_delta_RTT" | bc)" -eq 1 ]; then
                if [ "$(echo "$rx_load > $load_thresh" | bc)" -eq 1 ]; then
                        cur_dl_rate=$(echo "scale=10; $cur_dl_rate + $rate_adjust_load_high*($max_dl_rate-$min_dl_rate)" | bc)
                elif [ "$(echo "$rx_load < $load_thresh" | bc)" -eq 1 ]; then
                        cur_dl_rate=$(echo "scale=10; $cur_dl_rate - $rate_adjust_load_low*($max_dl_rate-$min_dl_rate)" | bc)
                fi

                if [ "$(echo "$tx_load > $load_thresh" | bc)" -eq 1 ]; then
                        cur_ul_rate=$(echo "scale=10; $cur_ul_rate + $rate_adjust_load_high*($max_ul_rate-$min_ul_rate)" | bc)
                elif [ "$(echo "$tx_load < $load_thresh" | bc)" -eq 1 ]; then
                        cur_ul_rate=$(echo "scale=10; $cur_ul_rate - $rate_adjust_load_low*($max_ul_rate-$min_ul_rate)" | bc)
                fi
        fi

        # adjust limits
        if [ "$(echo "$cur_dl_rate<$min_dl_rate" | bc)" -eq 1 ]; then
                cur_dl_rate=$min_dl_rate;
        fi

        if [ "$(echo "$cur_ul_rate<$min_ul_rate" | bc)" -eq 1 ]; then
                cur_ul_rate=$min_ul_rate;
        fi

        if [ "$(echo "$cur_dl_rate>$max_dl_rate" | bc)" -eq 1 ]; then
                cur_dl_rate=$max_dl_rate;
        fi

        if [ "$(echo "$cur_ul_rate>$max_ul_rate" | bc)" -eq 1 ]; then
                cur_ul_rate=$max_ul_rate;
        fi

        printf "%12.2f\t%12.2f\t%12.2f\t%12.2f\t%12.2f\t%12.2f\t%12.2f\n" "$rx_load" "$tx_load" "$prev_med_RTT" "$med_RTT" "$delta_RTT" $cur_dl_rate $cur_ul_rate
}


get_med_RTT

prev_med_RTT=$med_RTT

cur_dl_rate=$min_dl_rate
cur_ul_rate=$min_ul_rate

t_prev_bytes=$(date +%s.%N)

prev_rx_bytes=$(cat $rx_bytes_path)
prev_tx_bytes=$(cat $tx_bytes_path)

printf "\n%12s\t%12s\t%12s\t%12s\t%12s\t%12s\t%12s\n" "rx_load" "tx_load" "prev_med_RTT" "med_RTT" "delta_RTT" "cur_dl_rate" "cur_ul_rate"

while true ; do
        t_start=$(date +%s.%N)
        update_rates
        tc qdisc change root dev $TX_INTERFACE cake bandwidth "$cur_ul_rate"Kbit
        tc qdisc change root dev $RX_INTERFACE cake bandwidth "$cur_dl_rate"Kbit
        t_end=$(date +%s.%N)
        sleep_duration=$(echo "$tick_duration-($t_end-$t_start)" | bc)
        if [ "$(echo "$sleep_duration > 0" | bc)" -eq 1 ]; then
                sleep "$sleep_duration"
        fi
done
In this one, I'm sending probes only to port 53 as they are supposed to be DNS servers but it should not matter.
A quick clarification, because I'm using -m 3 to limit the number of hops, that is why I pipe results to grep 'p 2', this will take only results from the 3rd hop.
@moeller0 thank you for the very insightful explanation.
Why bother with multiple destinations and up to 3 hops. Why not just just single hop?
Trying to work out what's better from theoretical perspective for our purposes here. Which is the last mile bit between ISP and modem.
Honestly, I don't have an answer, just saw @dtaht suggestion and implemented it for you. Truth be told if you go with just 1, 2 or 3 hops you won't be leaving your ISP's network, so you can use directly one of those hops' IP and not caring much for other reflectors, I guess.
As I said, I'm trying this for fun, as my scenario is not really going to gain much from this. Assymetric 1000/50, Rpi4 as router and all traffic over WiFi.
Cable modem -> Rpi4 (sqm here in WAN interface) -> AP <-> wireless uplink (let's talk about latency) 
2 Likes
I really appreciate your contribution and testing @amteza. Just trying to figure out now which approach is best with limited understanding of the underlying networking concepts. But the latter is improving with this thread.
@moeller0 I understood your very helpful and interesting explanation above about the use of mtr.
Now I am wondering if we should be using it or ping.
If mtr why not just first hop on any arbitrary path say to 1.1.1.1 and average that?
And there is the averaging, which is interrelated.
I need your guidance as to which approach you'd recommend: ping vs mtr (and which form of averaging).
For ping (?), I've been trying to think about why taking the median is preferable to averaging across everything. And to confirm that is taking the median across the average RTTs?
You wrote:
I am being dense here but am not quite following why adopting the median approach solves the issue of avoiding one reflector not reflecting well? Is 'voting' taking the median of the averages? Would min average not make more sense? Why do you say voting would be more robust?
Actually I wonder if looking at the mean is not enough? Should I be trying to factor in spread too? Or is that unecessary? Could just looking at mean result in letting through significant jitter increase? Or will working with means to detect bufferbloat take care of that anyway?
Well, no hop on the internet owes you ICMP processing, let alone speedy generation of ICMP responses; most will generate them, but for bigger routers, routing/forwarding happens in a dedicated beefy ASIC, while all rare work like generating ICMP responses is punted to the generally much punier CPU. Now these router CPUs are not only relatively weak (I guess they are fine as they are, simply tailored to expected processing load) but also involved in stuff important for a routers functionality; so as a consequence they will treat ICMP responses as low(er) priority job and might even rate limit it. As a consequence a high RTT from a single hop might indicate that packets really took that long to get there and back, or that that node simply took its sweet time to process the input and generate the ICMP response. We are interested in the former not the latter here.
That uncertainty about the true source of a high RTT is why I believe that @dlakelan's idea of monitoring a small set of end-hosts (which might still rate-limit and deprioritize ICMP packets, but typically are expected to talk ICMP and also often have quite beefy CPUs) is the way to go.
Since any of these sources might still suffer from RTT increases unrelated to your current cLTE rate we want to be conservative in evaluating the results.
A mean will be affected by all, while a median much less so. But thinking of it actually it is the minimum we are interested in here. But for true congestion the median and the mean will be pretty close and the median will not care for e.g. an unreachable host which might result in an erroneous 0ms RTT report (no idea whether that is actually possible though, I am arguing from principle here, not on data, so this might be bunk).
Does this make sense?
BTW, I really like the idea of getting one way delay measurements additionally as that might allow to control up and downlink rates independently... but that is clearly not relevant for getting the first version working robustly and reliably....
Your code your choice, mtr can do pretty much all that ping can do short of the timestamping I believe.
Because as I tried to explain an increased RTT from that node might either reflect true congestion or that this node is just slow in responding ICMP packets (and that slowness can vary over time). But such "artifical" delay will not affect packets that are simply forwarded/routed, while true congestion delay will affect all packets.
I would as I tried ot explain take the median, even though the minimum is what we are really after, but the median should be a bit more robust against unexpected RTT reports.
Well, why not try them both out and figure out which approach works best then?
By the same argument you can take the individual medians as well, averaging there really only serves as a "temporal" filter to down-weigh individual RTT reports sine congestion should affect all reports, while individual outliers can be ignored for our purpose (IMHO).
What if a reflector does not respond at all and you get an accidental 0ms RTT report somehow? Might be impossible...
The median is one rough form of voting (giving a value that the >= 50% of the probes met or exceeded).
Yes, the minimum is the relevant measure.
Because then we do not need to prove that an accidental 0ms RTT can not happen (only that not more than half our reports accidentally are zero ![]() )
)
Well consider this, 3 nodes, true RTT to each 100ms, deltaRTT threshold 30ms
if any one of them gives an average RTT of 131*3-200 = 193 ms (because of being busy doing other stuff) we would detect a reason to scale down the rate even though this is just one reflector being a bit slow....
I think that averaging (or taking the median) per reflector first is sort of okay to give some outlier rejection, and the same applies to looking at the set of reflectors. But maybe I am just too cautious here and simply concatenating all reflector's individual values and taking the first mean > 0 ms might be just as good?
1 Like
Thank you so much for taking the time to explain all that. Very helpful.
I like extremes so any theoretical issue with just taking the minimum RTT across all reflectors (setting aside the RTT=0 possibility for the moment)?
Also could the baseline_RTT be set such that if it would increase it increases slowly as per alpha, but if it would decrease it is just set to the lower RTT just encountered?
Should work, if you are willing to trust any reflector to be telling the "truth".
Sure, but thing might get wobbly, one reason to use an EWMA is to dampen potential oscillations. Also changing the shaper rates will have a reasonable lower temporal limit somewhere.. no idea though where this limit sits.