Ah I'm confused actually. I have a complex setup because I have Zyxel NR7101 (192.168.0.1) and my main router behind that (192.168.1.1) and then clients behind the main router. It's not double nat because I disabled masquerading as required, but clearly this is messing up the mtr stuff.
Here is a traceroute from the NR7101:
root@OpenWrt:~# traceroute google.com
traceroute to google.com (142.250.187.206), 30 hops max, 46 byte packets
 1  *  *  *
 2  192.168.213.21 (192.168.213.21)  47.631 ms  42.624 ms  41.697 ms
 3  192.168.213.22 (192.168.213.22)  40.792 ms  40.481 ms  41.806 ms
 4  *  *  *
 5  *  *  *
 6  63.130.127.221 (63.130.127.221)  48.594 ms  58.781 ms  50.809 ms
 7  90.255.251.18 (90.255.251.18)  59.742 ms  52.789 ms  50.813 ms
 8  *  *  *
 9  142.251.52.148 (142.251.52.148)  55.637 ms  53.723 ms  142.251.54.46 (142.251.54.46)  63.835 ms
10  74.125.242.83 (74.125.242.83)  61.702 ms  142.251.54.33 (142.251.54.33)  65.785 ms  62.741 ms
11  216.239.59.5 (216.239.59.5)  67.623 ms  lhr25s33-in-f14.1e100.net (142.250.187.206)  71.779 ms  216.239.59.5 (216.239.59.5)  70.763 ms
I can't run mtr through VPN from NR7101 because that's on a downstream router.
OK, that is a tad faster than the other one (3.2ms in best) is your remote VPN-endpoint really that close by (OK 3ms still allow for up to ~300km fiber distance)?
If you repeat both tests for 1000 times (-c 1000) does the tunneled version still show the same amount of packet loss?
# delay threshold in ms is the extent of OWD increase to classify as a delay
# these are automatically adjusted based on maximum on the wire packet size
# (adjustment significant at sub 12Mbit/s rates, else negligible)
dl_delay_thr_ms=12.5 # (milliseconds)
ul_delay_thr_ms=12.5 # (milliseconds)
So you are saying to compare min/mid tracking I need to adjust those accordingly?
And what about the following? How should I adjust this or just leave it the same to test?
With the above settings my bandwidth was pinned down to 5 Mbit/s...
I'm running the mtr test but actually it's over WiFi so maybe the packet loss of 1% was just WiFi related? I presume I'd need to run this over wired client. Maybe I can run from Windows machine with linux virtual client? OK I've also started it from Ubuntu virtual machine (wired to router)..
First, here is the result from the WiFi client through VPN tunnel:
Yes and no. Just keep in mind that when comparing with the same ul/dl_delay_thr_ms the min-method will likely result in less throughput and less latency increase than the mid-method. If you look at both parameters this will even out, but when just looking at one you might get led astray.
However this can only be adjusted statically if there is no periodic change in baseline (because for that you need some way to track the changes).
Changing that only makes sense if you want to compare EWMA with SMA...
Was, but that might have changed across the day, no? It is a bit tricky to measure differences over a variable condition link as yours you will just need to change quickly and repeat the tests multiple time for each approach.
Ah OK that adds another layer of potential differences... wired would be simpler to interpret.
And now across the tunnel the best RTT is even lower, I fear I can not make much sense out of these mtr results, I am getting more and more conscious how challenging a variable rate link like your is
OK here is my testing from the old code (again resulting in the horrible pinning around 5 MBit/s at times with some excursions at other times to say 35 Mbit/s or more):
Subjectively I much prefer what is happening with the new code (whether that's a threshold issue or not).
Well... I have tested the main branch so far, with my ultra-conservative config that is tuned to my old slow LTE connection. Except that something changed and it now delivers almost 40 Mbps. So please treat it as a deliberately misconfigured test. And that's why I maintain that the base and maximum rates are meaningless parameters that should be eliminated, and that the decay to the base rate doesn't make sense (and is disabled in my config).
I watched a YouTube video and performed a fast.com speed test. Unfortunately the waveform speed test responds with error 503 here at the moment, so I can't do it.
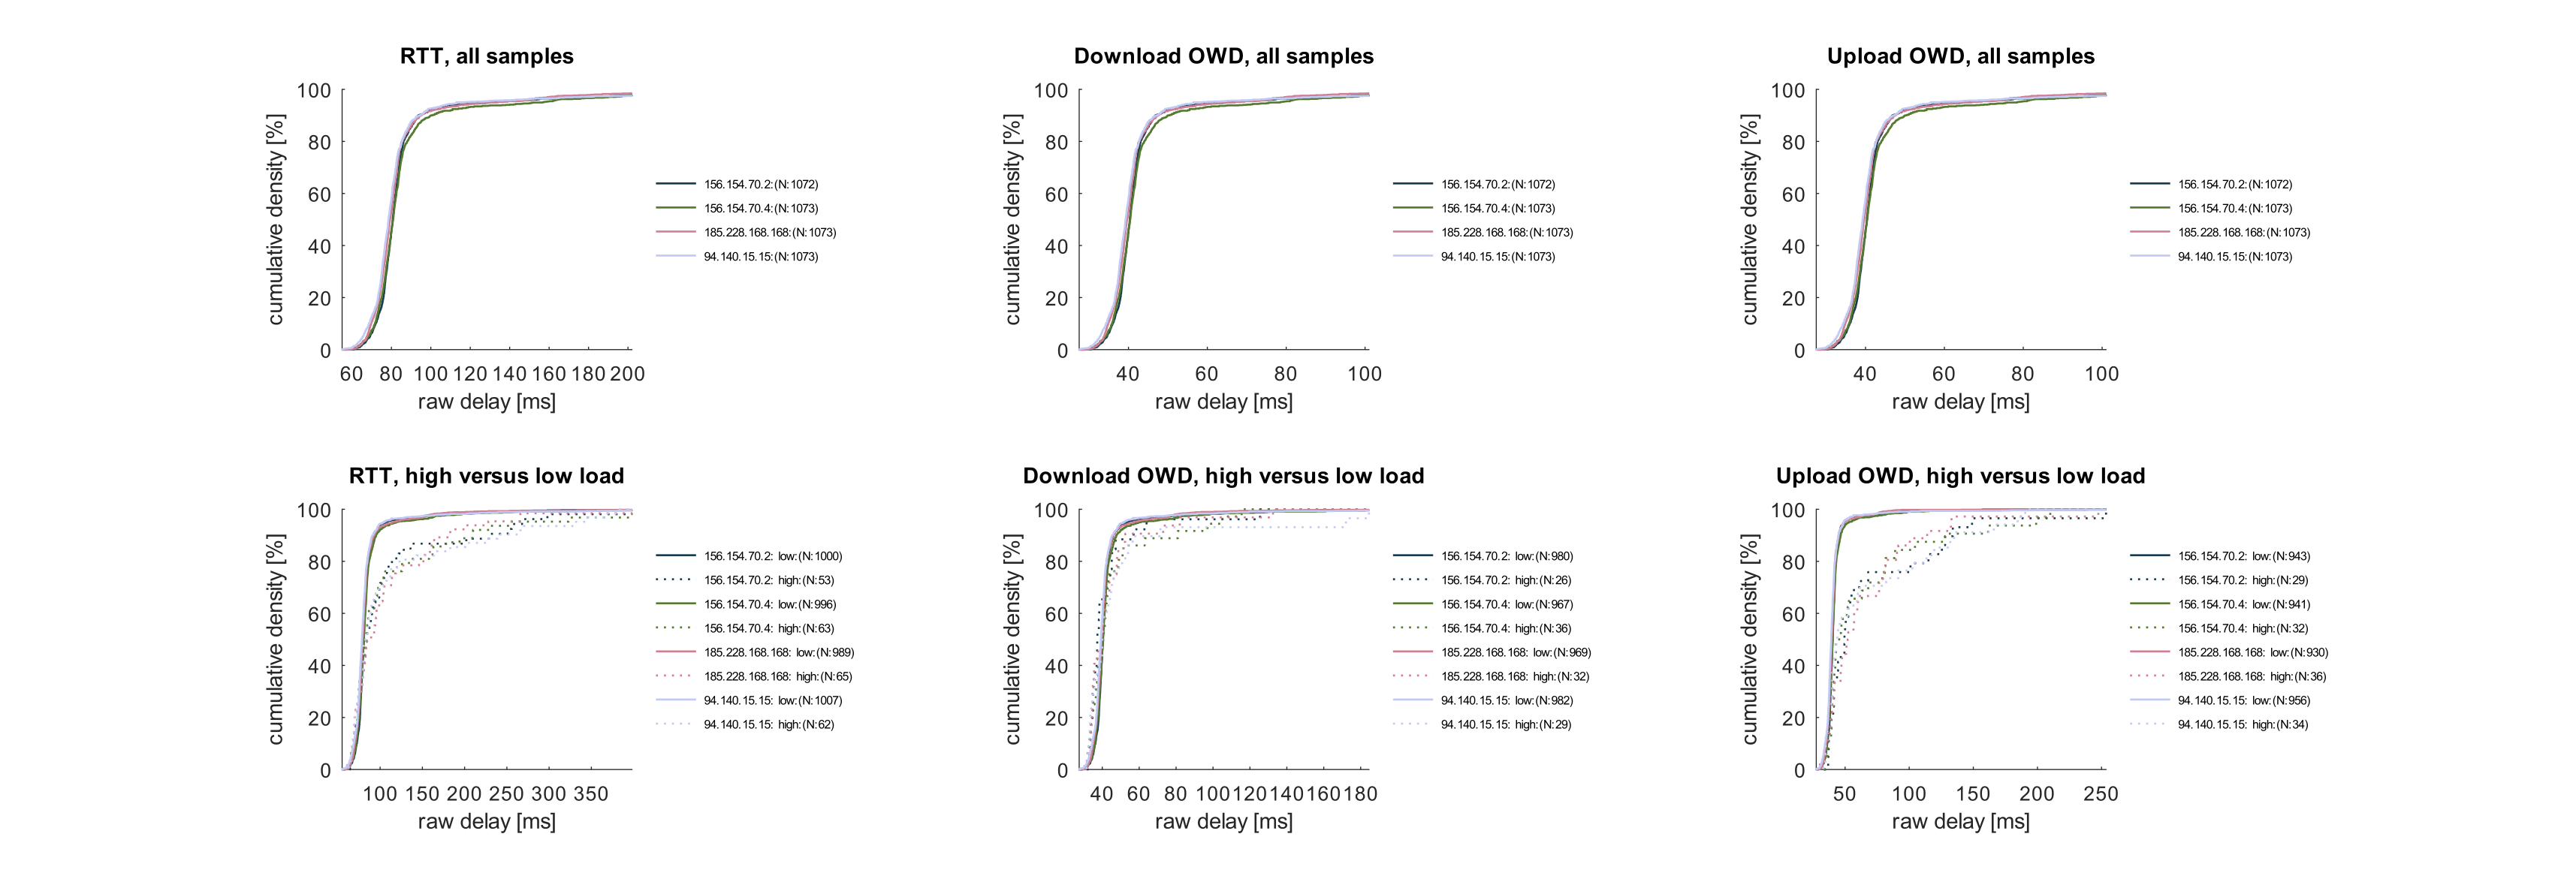
The fn_parse_autorate_log.m script is creating gigapixel images, so I downscaled the plot by a factor of 8 before uploading. The CDFs all come as black images, maybe because of the near-OOM situation.
Samples per reflector:
ReflectorID: 156.154.70.2; N: 923
ReflectorID: 156.154.70.4; N: 912
ReflectorID: 185.228.168.168; N: 910
ReflectorID: 94.140.15.15; N: 931
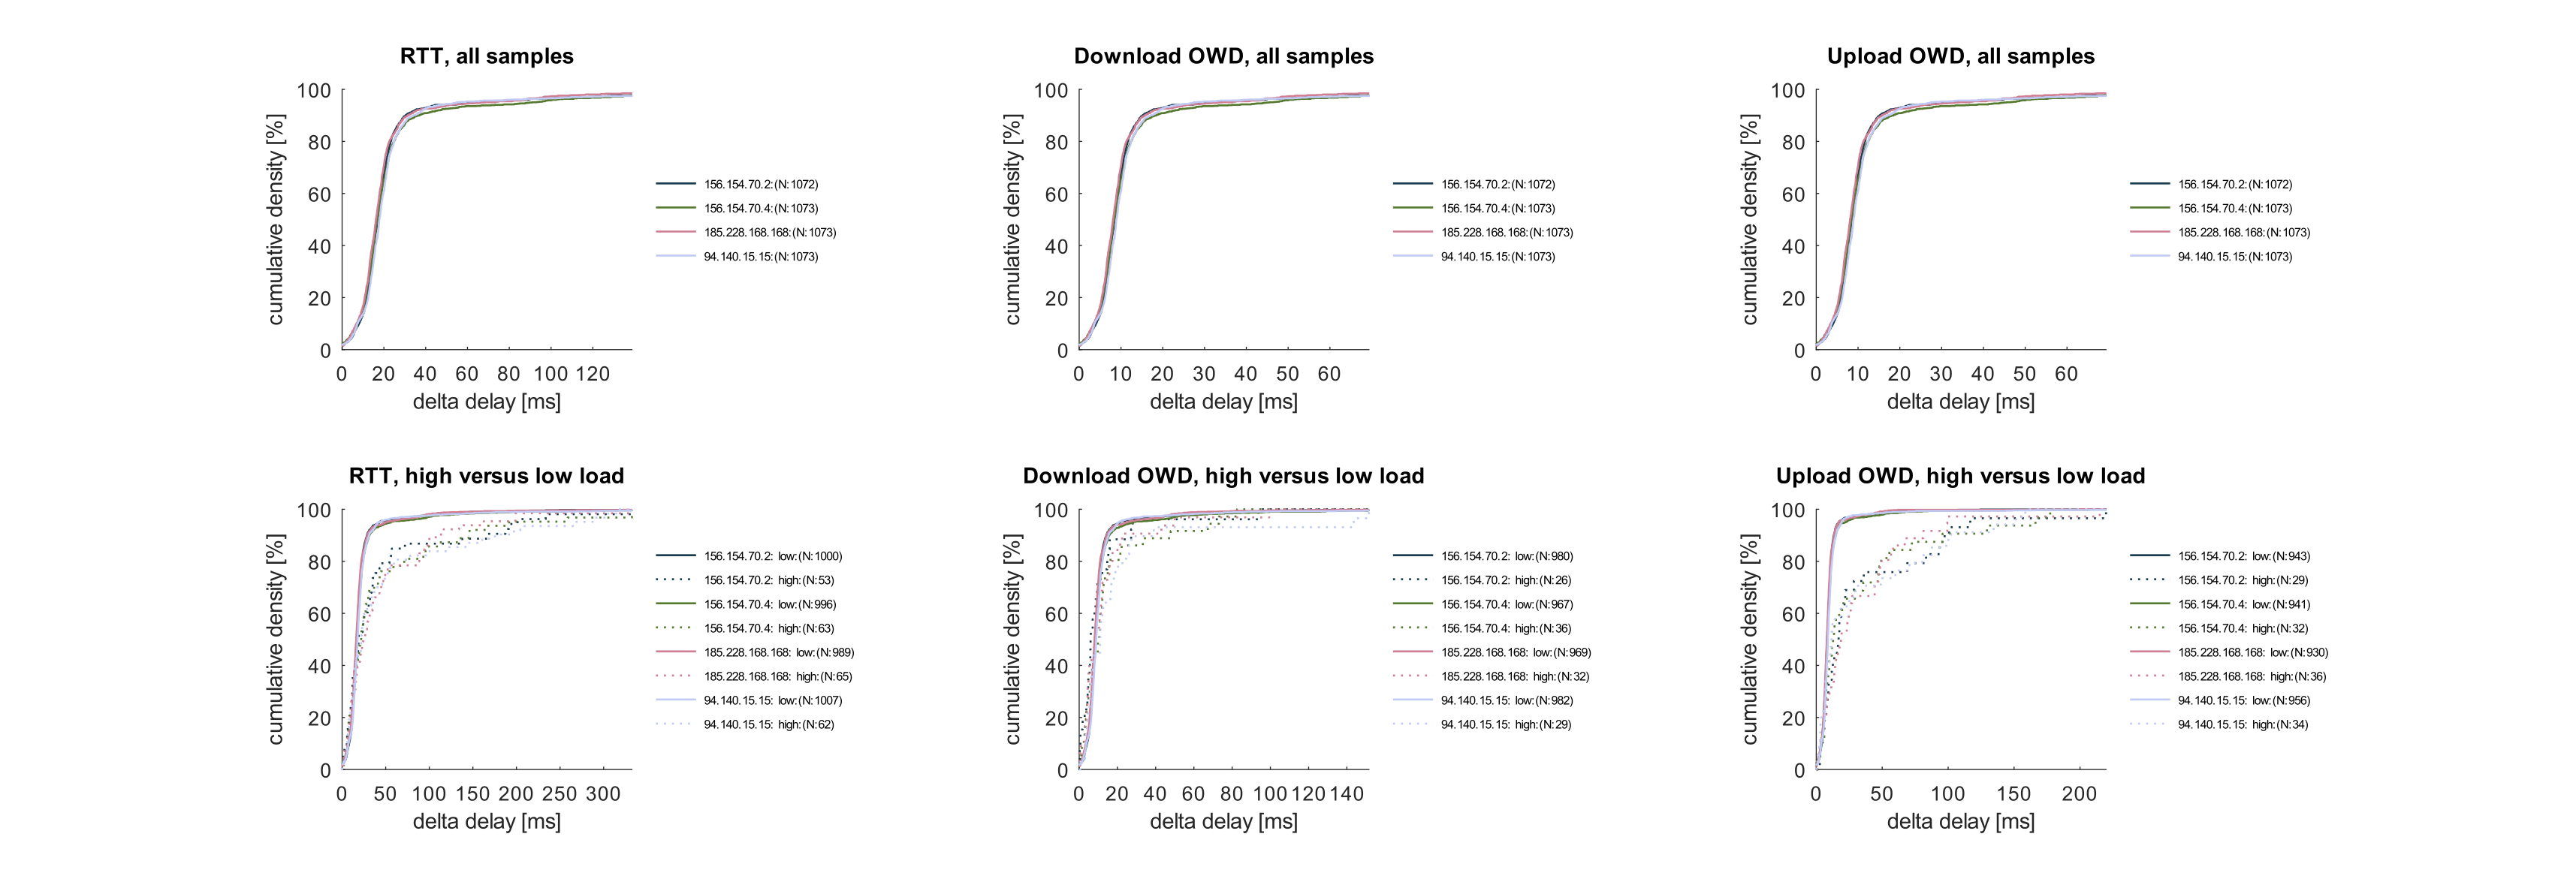
DL: maximum 95.000%-ile delta delay over all 4 reflectors: 22.730 ms.
DL: maximum 99.000%-ile delta delay over all 4 reflectors: 67.220 ms.
DL: maximum 99.500%-ile delta delay over all 4 reflectors: 126.170 ms.
DL: maximum 99.900%-ile delta delay over all 4 reflectors: 318.540 ms.
DL: maximum 99.950%-ile delta delay over all 4 reflectors: 318.540 ms.
DL: maximum 99.990%-ile delta delay over all 4 reflectors: 318.540 ms.
DL: maximum 99.999%-ile delta delay over all 4 reflectors: 318.540 ms.
UL: maximum 95.000%-ile delta delay over all 4 reflectors: 22.730 ms.
UL: maximum 99.000%-ile delta delay over all 4 reflectors: 67.220 ms.
UL: maximum 99.500%-ile delta delay over all 4 reflectors: 126.170 ms.
UL: maximum 99.900%-ile delta delay over all 4 reflectors: 318.540 ms.
UL: maximum 99.950%-ile delta delay over all 4 reflectors: 318.540 ms.
UL: maximum 99.990%-ile delta delay over all 4 reflectors: 318.540 ms.
UL: maximum 99.999%-ile delta delay over all 4 reflectors: 318.540 ms.
Next step: try with @Lynx's original settings instead of the "misconfigured" ones.
Ace is that the effect of your new Chinese antennas? Hooray for those! I'd really like your view on testing the sma code against the old code. I prefer the results, albeit @moeller0 remains to be convinced that it makes any sense whatsoever. I am persisting because it still makes sense in my mind (albeit I'm a bit dense on this stuff and trying to work on patent opposition at the same time!). Maybe you have some thoughts on the discussion above about tracking minimum vs tracking middle?
BTW specify output .pdf for now on the plotting code - that seems to overcome some bug.
Regarding the Chinese antennas - this is not the only factor. At night the speed was always good, and 9PM localtime was always broken before I bought the antennas.
Well, regarding the "crap" - with your default settings, the main branch is crap, also tops at 5 Mbps. So I am not sure if you want me to test the experimental branch with your settings (to see if SMA fixes this), or with my "misconfigured" ones.
Well the settings do require at least some tweaking for a given connection - it looks from that graph like the delay thresholds (red lines) are just way too aggressive for your connection. If you increase those a bit I'm sure it wouldn't be as bad.
My issue is that with tracking the minimum the red lines don't seem to work for different times of the day or week.
If we could find adjustment of these that worked for different cases that'd be ace.
That I happily accept, your network, your policy (however you might want to test the new mode with say Zoom or Skype while creating load to confirm that latency under load truly stays acceptable). I do however think that this middle tracking is not something that should be made default (just as I disagreed when sqm-autorate decided to not use raw deltaDelays, but low pass filter these with EWMA).
Looking at the data, yes increasing the threshold (try 25ms for the threshold) should more or less solve your issue with "getting stuck". IMHO in a cleaner way than pretending the threshold is X but only comparing that to half of the actual deltaDelay.
I agree (to you disabling parameters you do not like/need) and disagree that base and maximum are useless. Especially base is super easy to use, set it to max or min if you do not want it to have any influence on the shaper. Maximum rate is quite helpful if you know the hard maximum there is zero need to probe any further which on my link results in nicer cleaner behavior at the top end, and functionally it is easy to "disable" by simply setting it to something higher than a link can carry.
It defaults to 600 dpi for bitmaps, but personally I always save PDFs anyway they are smaller and all in all more useful (as one can zoom in in a meaningful way). Also the "png" exporter in octave is simply broken for some figures...
The figure looks odd, quite some crossing of the threshold but essentially no rate reductions.
Well, humor me and explain how it does more than hiding part of the variable delay I get it you are willing to trade in more latency-increase for higher throughput, but think we already have two [perfect toggles for that purpose the baseline growth alpha and the baseline. The middle tracking really just muddies the water where we model variant and invariant portions of the realized delay.
Again, please explain, why ignoring part of the empirically measured variance of the unloaded delay is a great method to maintain low latency performance on variable rate links. Keeping in mind that our challenge is essentially deciding for each delay sample whether it belongs to the idle or congested distribution?
Yes, or use .tif if you want a bitmap, the png export in octave is incompatible with our figures*.
*) I used octave here as I am reasonably fluent in matlab but wanted this to be generally usable, but octave really is showing its relative small user and tester base, this thing is not all that polished.
I wish we could separate the issues here EWMA versus SMA and middle- versus minimum-tracking these are not the same and might have different "solutions", no?
Yes, try something like 50-100ms which according to the CDFs should work OK.
Because your link has varying bufferbloat... Really, try the EWMA code with just changing alpha_baseline_increase to 0.9 or so if you want closer following of the "baseline", but keep the minimum finder that will give you a much faster minimum tracking, as you did not simply change from min to middle tracking but you increase the temporal change rate massively... I still dislike such close tracking as it will mis-interpret sustained congestion as acceptable but that is a policy decision for each network so I simply do not need to configure it that way.
Just to chip in and add that I really admire your persistence here. I am going to try EWMA with the 0.9 as you suggested. It's your insight that has brought this project so far. And as you say I want something that works for a lot of different users and use cases.
So I set:
 RTT baseline against which to measure delays
# the idea is that the baseline is allowed to increase slowly to allow for path changes
# and slowly enough such that bufferbloat will be corrected well before the baseline increases,
# but it will decrease very rapidly to ensure delays are measured against the shortest path
alpha_baseline_increase=0.9    # how rapidly baseline RTT is allowed to increase
alpha_baseline_decrease=0.9   # how rapidly baseline RTT is allowed to decrease
no more change? Will that approximate what I am seeing with my mid tracking SMA at 20 samples?
Oh wait you also stated this:
So I need to also set:
# delay threshold in ms is the extent of OWD increase to classify as a delay
# these are automatically adjusted based on maximum on the wire packet size
# (adjustment significant at sub 12Mbit/s rates, else negligible)
dl_delay_thr_ms=25 # (milliseconds)
ul_delay_thr_ms=25 # (milliseconds)
Anyway here are the results with the default settings from the experimental branch. It just stays at 10000 kbps - which is different from what I had with the main branch. But you changed the defaults, I picked up those changes (remember, this is just a test with all the defaults except the interface names and log retention settings), so it would be wrong to come to a conclusion that the SMA branch is better. It was tested with different settings. Next time, please don't change the unrelated defaults in a branch whose sole purpose is to test an algorithm change.
The testcase is just a piece of a YouTube video - no speedtest.
EDIT: all plots were invalid due to the old script not being killed properly, thus deleted to avoid further confusion. I detected this by noticing that the time range overlaps with the previous plot.
Next test: the experimental branch + "misconfigured" settings for the crappy slow LTE connection.
Probably not exactly, I base this on the observation that often people use alpha = 2/(N+1) see https://en.wikipedia.org/wiki/Moving_average , plugging in N = 20 gives
2/(20+1) = 0.0952380952381 but we use the inverse, so 1-2/(20+1) = 0.904761904762. But this is purely theoretical and might need a bit of tuning...
Please adjust the two threshold values to something in the range of 50-100 otherwise the testing is rather moot, even without load you have constant "reduce shaper" noise which indicates the thresholds are not suited to your link. We are still thinking about how to propose a suitable threshold based on the log data but so far the only solution is eye-balling the delay curves/CDFs.