I've implemented that above. The question is whether it adds value. What happened before was that we'd have a partial line write on tsping getting terminated. That partial line write would then get combined with the next good line up until the newline. But I've prevented that by terminating the parse_preprocessor (and hence discarding partial line) on terminating the pinger binary. Could there still be situations in which lines get mixed up? Maybe if the pinger binary messes up or other issues. What do you think? Shall we keep it or ditch it?
Keep it, this kind of sanity checking is something we should only abandon if we are sure it costs too much performance...
1 Like
I forget whether on your setup you can easily test tsping? If so, any chance you could test the latest cake-autorate code? It's got a super easy installer now that always pulls the latest code.
No, I would first need to build tsping against the turrisOS SDK something I a have not yet tried...
I looked into building custom packages here: https://gitlab.nic.cz/turris/os/build, and I also came across this example. But I think it would take me a while to figure out exactly how to proceed. @Lochnair put together very helpful instructions for the simple OpenWrt SDK case here.
@moeller0 I also just added an autogenerated 'log_file_rotate' script that sits in the /var/run directory together with the existing autogenerated 'log_file_export' script:
I think this is useful because it means you can locally or remotely and manually or via a script:
- rotate the log file to start afresh by calling /var/run/cake-autorate/primary/log_file_rotate
- perform speed tests
- export the log file by calling /var/run/cake-autorate/primary/log_file_export
- process the exported log file data using your Matlab/Octave script or otherwise
Example output:
root@OpenWrt-1:~# /var/run/cake-autorate/primary/log_file_rotate
Successfully signalled maintain_log_file process to request log file rotation.
root@OpenWrt-1:~# /var/run/cake-autorate/primary/log_file_export
Successfully signalled maintain_log_file process to request log file export.
Log file export complete.
Log file available at location: /var/log/cake-autorate.primary_2023_05_19_10_29_32.log.gz
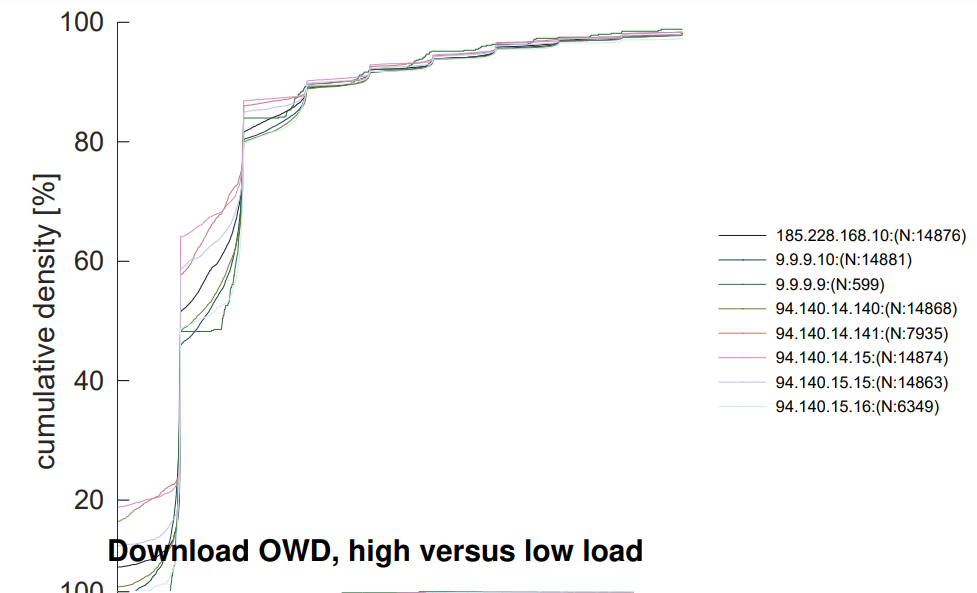
@moeller0 and for fun, here is a new plot for almost two hours of tsping data during light use:
timecourse:
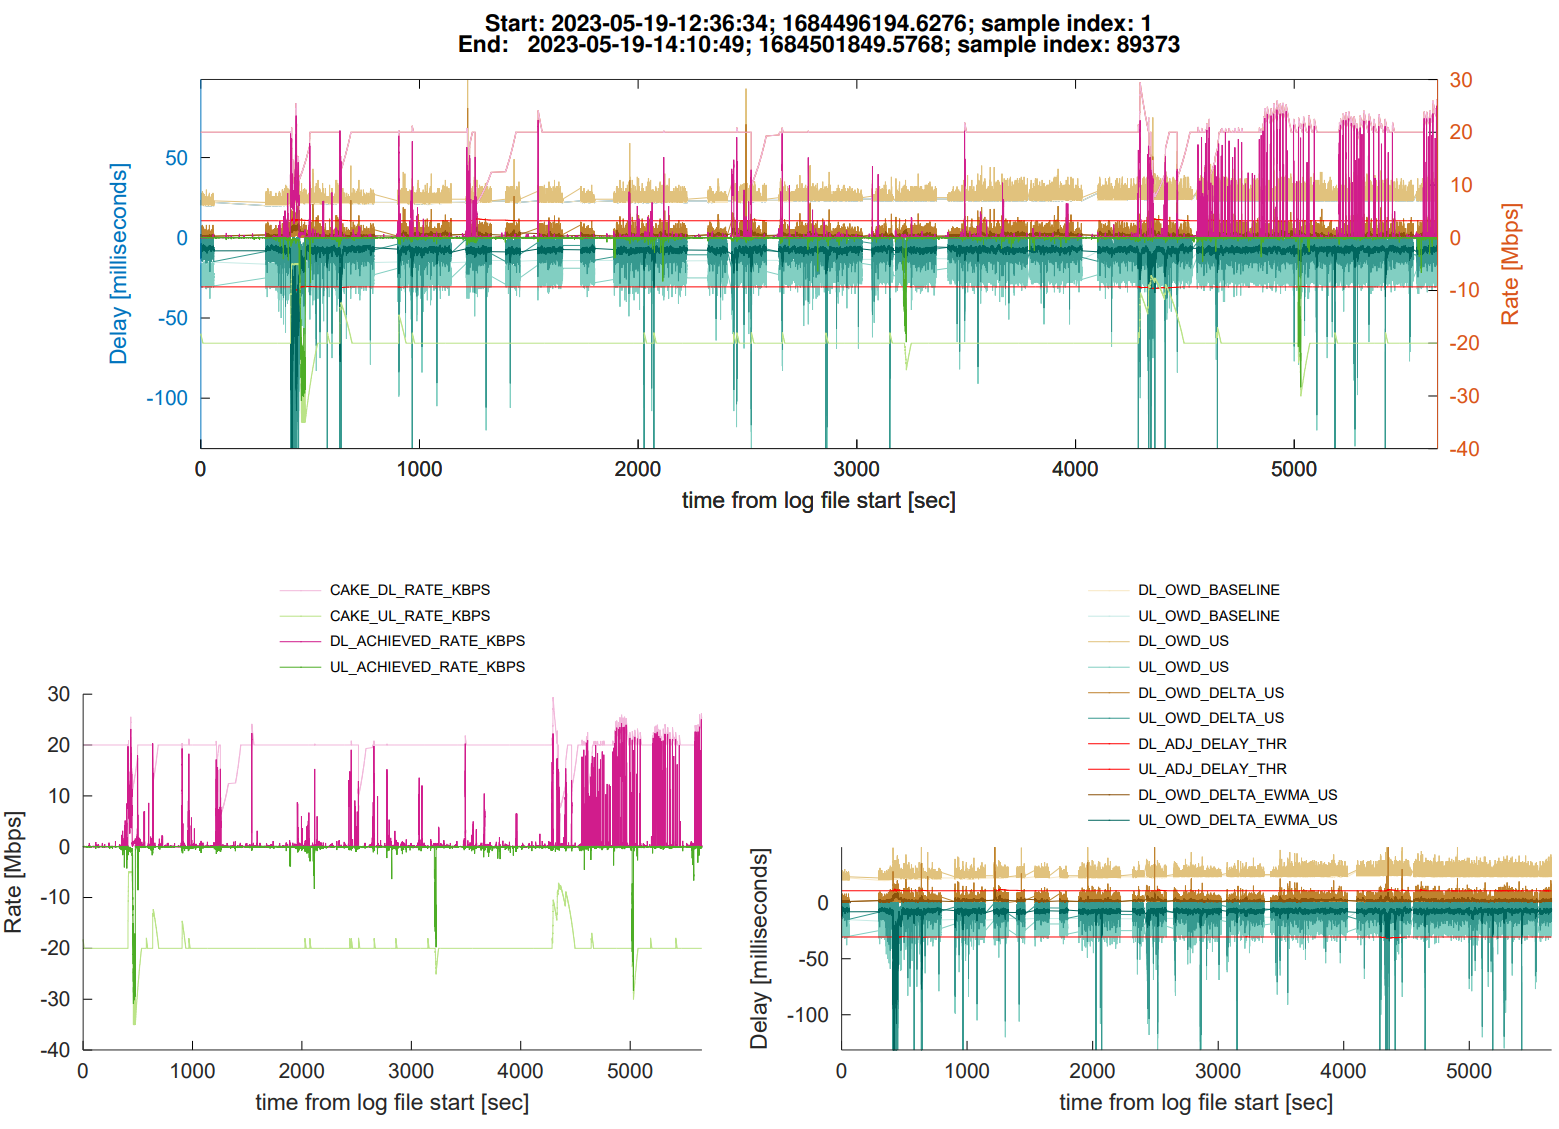
raw CDFs:

delta CDFs:

What are these funky shapes about I wonder:
Compressed log file here:
Ya, I should upgrade the router at some point, it is more a matter of time right now. I will try that earlier commit to see if the CPU changes at all. I will report that I just logged on and on the current version (pulled from github May 6) cake-autorate stopped working right around 2 days ago based on the last entry in the log.
So there are no entries in the log after 2 days ago but cake-autorate is still "running". According to ps, there are 199 processes of cake-autorate.sh, most of them being zombie processes. fping is still running.
Here is the end of the meaningful part of the log file. After this there is just a few hundred more lines of LOAD and then it stops:
LOAD; 2023-05-17-22:20:27; 1684380027.094564; 1684380027.093594; 426; 26; 14925; 2060
DEBUG; 2023-05-17-22:20:27; 1684380027.094500; Warning: no reflector response within: 0.500000 seconds. Checking loads.
DEBUG; 2023-05-17-22:20:27; 1684380027.097071; load check is: ((426 kbps > 10 kbps && 597 kbps > 10 kbps))
DEBUG; 2023-05-17-22:20:27; 1684380027.099343; load above connection stall threshold so resuming normal operation.
DEBUG; 2023-05-17-22:20:27; 1684380027.103759; Warning: no reflector response within: 0.500000 seconds. Checking loads.
DEBUG; 2023-05-17-22:20:27; 1684380027.106654; load check is: ((426 kbps > 10 kbps && 26 kbps > 10 kbps))
DEBUG; 2023-05-17-22:20:27; 1684380027.109407; load above connection stall threshold so resuming normal operation.
DEBUG; 2023-05-17-22:20:27; 1684380027.113749; Warning: no reflector response within: 0.500000 seconds. Checking loads.
DEBUG; 2023-05-17-22:20:27; 1684380027.116646; load check is: ((426 kbps > 10 kbps && 26 kbps > 10 kbps))
DEBUG; 2023-05-17-22:20:27; 1684380027.119409; load above connection stall threshold so resuming normal operation.
DEBUG; 2023-05-17-22:20:27; 1684380027.123760; Warning: no reflector response within: 0.500000 seconds. Checking loads.
DEBUG; 2023-05-17-22:20:27; 1684380027.126652; load check is: ((426 kbps > 10 kbps && 26 kbps > 10 kbps))
DEBUG; 2023-05-17-22:20:27; 1684380027.129405; load above connection stall threshold so resuming normal operation.
LOAD; 2023-05-17-22:20:27; 1684380027.304570; 1684380027.303600; 5; 5; 14925; 2060
DEBUG; 2023-05-17-22:20:27; 1684380027.304487; Warning: no reflector response within: 0.500000 seconds. Checking loads.
DEBUG; 2023-05-17-22:20:27; 1684380027.307027; load check is: ((5 kbps > 10 kbps && 26 kbps > 10 kbps))
DEBUG; 2023-05-17-22:20:27; 1684380027.309756; Changing main state from: RUNNING to: STALL
LOAD; 2023-05-17-22:20:27; 1684380027.515499; 1684380027.514085; 0; 11; 14925; 2060
LOAD; 2023-05-17-22:20:27; 1684380027.725437; 1684380027.724071; 168; 183; 14925; 2060
DEBUG; 2023-05-17-22:20:27; 1684380027.725149; Connection stall ended. Resuming normal operation.
LOAD; 2023-05-17-22:20:27; 1684380027.934557; 1684380027.933552; 125; 29; 14925; 2060
LOAD; 2023-05-17-22:20:28; 1684380028.144503; 1684380028.143515; 4; 0; 14925; 2060
LOAD; 2023-05-17-22:20:28; 1684380028.354535; 1684380028.353538; 5; 0; 14925; 2060
LOAD; 2023-05-17-22:20:28; 1684380028.564544; 1684380028.563543; 5; 6; 14925; 2060
LOAD; 2023-05-17-22:20:28; 1684380028.774456; 1684380028.773466; 0; 0; 14925; 2060
LOAD; 2023-05-17-22:20:28; 1684380028.984427; 1684380028.983422; 0; 0; 14925; 2060
I've double-checked and there is plenty of room on the filesystem. Have you been letting it run for long periods or do you restart the script periodically?
Yes - I think I tracked that issue down and resolved it. I think it was caused by the forking of sleep reads and is resolved by:
Since May 6 I have pushed a lot of different commits with various important fixes and improvements - see here:
Things seem stable again for me now.
It is hard to say with 100% certainty as the CPU usage for the CAKE component is variable depending on the current download speed which is highly variable with Starlink, but I went back and forth a couple times between the commit I pulled on May 6 and the pre-FIFO change commit you linked to above and it does seem like the CPU usage for me is lower before the FIFO change. Before that point, when the download speed gets around 100 Mbps, one core gets 90-100% in htop but the other 3 cores are lower, around 60-70%. After the FIFO change when the download speed is around 100 Mbps then all 4 cores are around that 90-100%.
I just saw your PM about the latest change, I will pull that commit and try now.
Please try the latest commit as of now. Take care to update all the files (at the least: cake-autorate.sh, cake-autorate_lib.sh, cake-autorate_defaults.sh, the service script cake-autorate) - a run from @rany2's installer should suffice to update everything to the latest commit. The latter was designed to rapidly update to the latest commit, whilst retaining the custom config.
Are you using fping or tsping by the way? I've switched across to tsping but am still maintaining support for ping and regular iputils-ping.
I'm running cake-autorate for long periods myself now - circa 24 hours per run between code updates and re-run as service.
Again, sorry about the stability issues with the latest code on 'master' - some time ago I substantially rewrote many aspects of cake-autorate and there were (and possible still are) a few things needing ironed out. As you can see from the commit history I've been pretty busy!
I'd really appreciate input from a couple of users to help ensure we get things 100% stable again on 'master'.
Once things look stable, I'm keen to finally settle on a commit for a version 2.0.0 release.
Great, thanks for your work on this! I updated to the latest commit and your sleep fix definitely made a difference. Now when it gets above 100 Mbps down one core is still getting 90-100% CPU but the other 3 are more like 60-70%, so there is a little breathing room on my little router. The bandwidth while waveform is sometimes showing above 130 Mbps which I didn't see before with cake-autorate running, although once it settled down it ended up right around 100 Mbps download. I'll have to try it earlier in the morning sometime when Starlink tends to be a little faster, but of course 100 Mbps is not a problem at all if we can keep latency down. Previously it seems like the CPU was limiting the speed when cake-autorate was running but now I think I might be getting the full bandwidth.
I'm still using fping. I'd like to try tsping once it is in the OpenWrt package repository.
I've just been letting cake-autorate run so in the latest run it had been going for 11 days before it got in that weird state. Do you think I should be restarting it every day?
Cool. Is that with the default 20Hz ping frequency (or a reduced frequency)?
Low latency 100MBit/s is surely all anyone needs. I'd be delighted with that, but my 4G tops out at 80Mbit/s at the absolute theoretical maximum without carrier aggregation.
You could radically cut down CPU use by setting:
no_pingers=4 # number of pingers to maintain
And to work well with this:
bufferbloat_detection_window=4   # number of samples to retain in detection window
bufferbloat_detection_thr=2      # number of delayed samples for bufferbloat detection
Regarding stability, cake-autorate should, of course, just keep running in the background and do whatever it needs to do to manage the pingers to keep going. My latest round of testing and fixes, and with your help with testing, we can hopefully iron out any remaining issues.
And so with respect to:
Please don't - please keep checking that all is well and let me know if it goes into a bad state hopefully with log covering the period. If you have spare router memory please significantly increase the log duration to as long as possible subject to memory, keeping in mind that the maximum memory footprint will be 2x the maximum size set given rotation and retention of the previous .old log file (or perhaps you can use USB?) - I have set:
log_file_max_time_mins=60  # maximum time between log file rotations
log_file_max_size_KB=50000  # maximum KB (i.e. bytes/1024) worth of log lines between log file rotations
However, for the long term, we can as a failsafe have the procd service respawn cake-autorate instance(s) on failure. But of course that's no good for when we are trying to identify and iron out any issues.
I've made an attempt to address it here: https://github.com/Lochnair/tsping/commit/6ac8401cd906c439d990666cb57d827288dfc92a
Not sure if this is a correct way to handle it though.
Excellent! Also, we haven't quite bottomed out the timing discussion yet.
As I understand it, right now tsping adopts the following approach:

But after the last reflector ping, rather than just sleep, we have target + sleep. I think it should just be sleep if we keep the existing approach - as I wrote here:
As @patrakov identified on GitHub:
the present implementation is arguably broken if one pinger is used - giving an infinitesimal spacing.
As I wrote earlier, I like the fping approach.
Regarding time interval, fping uses:
−p, −−period= MSEC
In looping or counting modes (−l, −c, or −C), this parameter sets the time in milliseconds that fping waits between successive packets to an individual target. Default is 1000 and minimum is 10.
−i, −−interval= MSEC
The minimum amount of time (in milliseconds) between sending a ping packet to any target (default is 10, minimum is 1).
So with:
fping ${ping_extra_args} --timestamp --loop --period "${reflector_ping_interval_ms}" --interval "${ping_response_interval_ms}" --timeout 10000 "${reflectors[@]:0:${no_pingers}}"
as I understand it, this means that ${reflector_ping_interval_ms} separates ping sends to a particular target, and ${ping_response_interval_ms} separates ping sends to any target.
Right now I have coded in cake-autorate the following.
For fping:
${ping_prefix_string} fping ${ping_extra_args} --timestamp --loop --period "${reflector_ping_interval_ms}" --interval "${ping_response_interval_ms}" --timeout 10000 "${reflectors[@]:0:${no_pingers}}" 2> /dev/null >&"${parse_preprocessor_fd}" &
For tsping:
${ping_prefix_string} tsping ${ping_extra_args} --print-timestamps --machine-readable=' ' --sleep-time "0" --target-spacing "${ping_response_interval_ms}" "${reflectors[@]:0:${no_pingers}}" 2>/dev/null >&"${parse_preprocessor_fd}" &
Still working, I haven't restarted. And yes, the around 100 Mbps download speed is with the default pinger frequency. I will note for you that I disabled the Starlink compensation feature for now as I noticed that the upload speed is better without it on, and Starlink may have been making changes as there doesn't seem to be as much bufferbloat in the upload direction anymore. Perhaps once I am using tsping I will experiment with this more.
1 Like
How about now? My tsping variant has been running 24/7 for quite some time now. All seems well so far with the code on the 'master' branch right now.
And how is CPU use on your EdgeRouter X with the MT7621A at max throughput on your Starlink connection?
On my RT3200 with the MT7622BV at max throughout on my LTE connection, I think there are still plenty of spare CPU cycles.
Here is an htop snapshot under saturating load at around the worst loading I could generate with many concurrent speed tests (I switched from 'ondemand' to 'performance' in terms of the performance scheduler right before the speed tests):
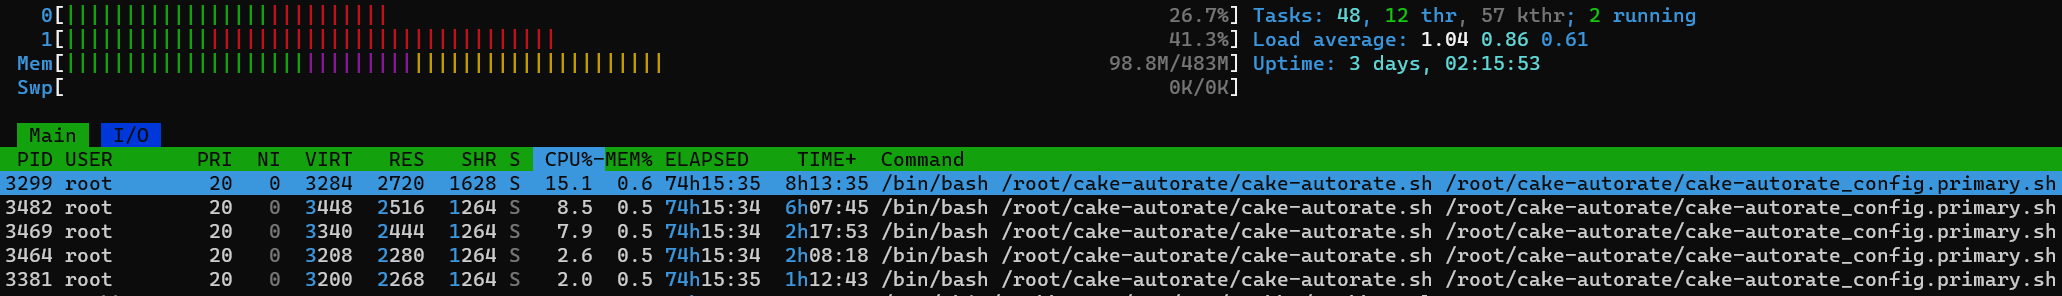
That's not too bad right?
It seems that we could potentially reduce CPU cycles a little bit further by sending data between processes in say 250 character chunks and then splitting up like so:
root@OpenWrt-1:~# time for ((i=80000; i--;)); do printf "%s\n" "DATA; 2023-05-25-08:15:30; 1684998930.549480; 1684998930.547750; 10; 8; 0; 0; 1684998930.529694; 94.140.15.15; 9; 25002; 25000; 1397; -2; 10600; 11407; 17000; 8862; 5593; 30600; 0; 0; dl_idle; ul_idle; 20000; 20000"  >&"${fd}"; read -u "${fd}" -a a; done

real    0m42.387s
user    0m28.998s
sys     0m12.756s

root@OpenWrt-1:~# time for ((i=80000; i--;)); do printf "%-250s" "DATA; 2023-05-25-08:15:30; 1684998930.549480; 1684998930.547750; 10; 8; 0; 0; 1684998930.529694; 94.140.15.15; 9; 25002; 25000; 1397; -2; 10600;
 11407; 17000; 8862; 5593; 30600; 0; 0; dl_idle; ul_idle; 20000; 20000"  >&"${fd}"; read -N 250 -u "${fd}" a; a=(${a}); done

real    0m33.782s
user    0m30.728s
sys     0m1.389s
That is, assuming the above test is applicable to the asynchronous write and read case.
It'd be helpful to see the output of the above two timed commands on a bash shell from your router.
root@OpenWrt-1:~# bash
root@OpenWrt-1:~# exec {fd}<> <(:)
root@OpenWrt-1:~# time for ((i=80000; i--;)); do printf "%s\n" "DATA; 2023-05-25-08:15:30; 1684998930.549480; 1684998930.547750; 10; 8; 0; 0; 1684998930.529694; 94.140.15.15; 9; 25002; 25000; 1397; -2; 10600; 11407; 17000; 8862; 5593; 30600; 0; 0; dl_idle; ul_idle; 20000; 20000"  >&"${fd}"; read -u "${fd}" -a a; done
root@OpenWrt-1:~# time for ((i=80000; i--;)); do printf "%-250s" "DATA; 2023-05-25-08:15:30; 1684998930.549480; 1684998930.547750; 10; 8; 0; 0; 1684998930.529694; 94.140.15.15; 9; 25002; 25000; 1397; -2; 10600;
 11407; 17000; 8862; 5593; 30600; 0; 0; dl_idle; ul_idle; 20000; 20000"  >&"${fd}"; read -N 250 -u "${fd}" a; a=(${a}); done
It's still running without a restart after about 6 days. I think in the past it has made it to at least 10 days, though, before something happened to get in that weird state. So I'll keep watching it.
When the download speed test gets around 100 Mbps I'm seeing one core in htop get to around 95% and the other 3 cores get to around 60-70%.
Here's the result of your benchmark on this slower CPU (fairly idle network at the time but cake-autorate was still running):
root@OpenWrt:~/cake-autorate# bash
root@OpenWrt:~/cake-autorate# exec {fd}<> <(:)
root@OpenWrt:~/cake-autorate# time for ((i=80000; i--;)); do printf "%s\n" "DATA; 2023-05-25-08:15:30; 1684998930.549480; 1684998930.547750; 10; 8; 0; 0; 1684998930.529694; 94.140.15.15; 9; 25002; 25000; 1397; -2; 10600; 11407; 17000; 8862; 5593; 30600; 0; 0; dl_idle; ul_idle; 20000; 20000"  >&"${fd}"; read -u "${fd}" -a a; done
real    2m15.011s
user    1m43.416s
sys     0m31.544s
root@OpenWrt:~/cake-autorate#
root@OpenWrt:~/cake-autorate# time for ((i=80000; i--;)); do printf "%-250s" "DATA; 2023-05-25-08:15:30; 1684998930.549480; 1684998930.547750; 10; 8; 0; 0; 1684998930.529694; 94.140.15.15; 9; 25002; 25000; 1397; -2; 10600;
 11407; 17000; 8862; 5593; 30600; 0; 0; dl_idle; ul_idle; 20000; 20000"  >&"${fd}"; read -N 250 -u "${fd}" a; a=(${a}); done
real    1m59.650s
user    1m56.367s
sys     0m3.237s
So ya, that does seem like it would be an improvement. But I also wouldn't spend a ton of time making those optimizations if they are going to take you a while -- I know my current router is old and I'll upgrade at some point when I have time. Thanks.
1 Like
Thanks for the update and for running that test.
The improvement over 80000 iterations from 2m15.011s to 1m59.650s is not exactly earth shattering, and I suppose that this circa 10% efficiency gain associated with reading larger chunks rather than individual bytes would only be achieved for the fraction of time spent reading, and thus if implemented in cake-autorate would presumably give less than a 10% gain in terms of overall CPU usage? Albeit I am only guessing here, and I am not sure if things would scale this way in the real-world context and with multiple writers and readers. So the real-world difference could in practice be more or less.
The significance of the change seems like it may be device specific. Here is the same from my desktop:
:~$ time for ((i=80000; i--;)); do printf "%s\n" "DATA; 2023-05-25-08:15:30; 1684998930.549480; 1684998930.547750; 10; 8; 0; 0; 1684998930.529694; 94.140.15.15; 9; 25002; 25000; 1397; -2; 10600; 11407; 17000; 8862; 5593; 30600; 0; 0; dl_idle; ul_idle; 20000; 20000"  >&"${fd}"; read -u "${fd}" -a a; done

real    0m4.453s
user    0m2.462s
sys     0m1.991s

:~$ time for ((i=80000; i--;)); do printf "%-250s" "DATA; 2023-05-25-08:15:30; 1684998930.549480; 1684998930.547750; 10; 8; 0; 0; 1684998930.529694; 94.140.15.15; 9; 25002; 25000; 1397; -2; 10600;
 11407; 17000; 8862; 5593; 30600; 0; 0; dl_idle; ul_idle; 20000; 20000"  >&"${fd}"; read -N 250 -u "${fd}" a; a=(${a}); done

real    0m2.223s
user    0m2.093s
sys     0m0.131s
That's a 2x speedup.
Even if the change is small, I suppose every little helps for the cases in which the CPU is saturated.
I'm waiting for @richb-hanover-priv to do some testing on his his old Archer C7. I am pretty sure that will require a reduced pinger frequency compared to the defaults. @richb-hanover-priv perhaps you could try defaults, and then:
no_pingers=3 # number of pingers to maintain
Hmmm when do you think tsping would be available through the opkg.
it looks extremely promising however even with the explanation on how to compile it... it may be too complicated for me to the point where I'm starting to feel like I might have a learning disability ![]()
Is there an easier way to install tsping for one who doesn't have a linux VM configured to compile the files needed. I'm not entirely sure how to add a repository to openwrt or how to use the openwrt sdk.
Hopefully soon - @Lochnair?
Which device do you have again? I think it's more or less just a case of copying and pasting the commands that @Lochnair wrote on his readme into SSH client.