Depends on where you live. Inside the EU the EU Regulation 2015/2120 sets pretty explicit limits on when and how ISPs are allowed to treat end-user traffic differentially. That thing is "beautiful" laywerese but still worth a read including the preamble before article 1.
Internally most ISPs likely use some internal prioritization, e.g. if network control traffic is using the same pipes as end-user traffic I expect ISPs will prioritize their control traffic with understandable justification.
I would expect an important point in that function would be source verification/admission control, so only a few select machines are allowed to emit higher priority traffic.
The bash implementation can be made to work with using only a few percent of CPU (depending on various configurable factors) so unless connection saturates CPU (and most use cases like LTE won't) then is CPU use such an issue?
I imagine that the perl approach probably uses between 1 to 2%.
No it isn't, but then getting CPU usage further down isn't my main goal here, it's a side benefit.
I mostly thought it'd be an interesting challenge to do this in Rust, anything else in kinda secondary.
It is not only CPU but also the need for a run-time environment, compared to ideally a single statically compiled binary...
Also a fully fledged language might implement something like usable (multidimensional) arrays, better concurrency constructs, maybe even usable plotting primitives out of the box.
With Need help with USB tethering issues in mind, did you ever (roughly) establish how much data this kind of adaptive link tuning costs to keep the measurements going? Obviously this depends on a lot of factors, configuration (ping frequency), type of reflectors, link speed, variances in link speed, etc, but it would be interesting to have a rough order of magnitude.
A normal ping packet of 56 bytes corresponds to an 84 byte IPv4 packet, so for IPv4 links you need to calculate roughly:
effective aggregate ping frequency [Hz] * (84 + per-packet-overhead)[B] * duration [s]
but this is only an upper bound, as the current code will try to put the ping probes to sleep when the wan link is essentially idle.
Maybe we could print an informative text somewhere on start up telling the user about the rate of the load ad well as the total traffic volume per day or so. The only challenge is where to print that.... maybe just into the system log?
To give some numbers, let's assume my link with the current defaults:
on a metered link where every byte is charged/accounted, the defaults are a bit on the heavy side, however due to the ping sleep code the number above would require that the network is continuously loaded above the "idle-sleep" threshold.
Also 56 is the default ping payload, but timestamps are available down to 16 bytes IIRC which would reduce the numbers down to:
I know I have been arguing for keeping the default ping size before (as I expect everything to be optimized for that size) but for metered links maybe something like -s 16 might be a better default, assuming that this works for everybody else's links (LTE, starlink, ...) as well.
P.S.: I think my calculations are correct, but there might be conceptual errors in there, so take with a grain of salt.
@Lynx a quick test yesterday with rates set to (Mbps):
dl_max: 105
dl_base: 75
dl_min: 50
ul_max: 35
ul_base: 25
ul_min: 17
both 105 and 35 are my hard limits for fixed SQM which work well.
During a speedtest things behaved as expected, the tested direction increased from base to max, while the unloaded direction stayed at base rate (since the upper limits are chosen to be still in the acceptable latency under load territory, hence no reduction to minimum rate).
Due to some issues with logging when started from the command line and not as a background service, I did not let it run any longer, so those tests will have to wait a bit.
But I think it's important to point out that it's light and, other than ICMPs, passive. It is not as if we run bandwidth tests every so often. So I'm not sure users need to worry about quota use, etc.
For many mobile plans that is a considerable chunk of the monthly quota (for some it will even exceed the quota)... yes the sleeping code (which I also argued against *) will help but in a hard to quantify way.
*) But hey, I am willing to learn, my own mobile plan is auto-upgrading but 3.7 GiB would crash me through the two lowest price tiers without transferring a single byte of useful data. (I am not using autorate on that link or tethering at all, just to illustrate why I consider 3.7 GiB a problem and the sleep code an elegant way to reduce that without incurring noticeable delays).
We are talking about the fact that the autorate approach will generate its own measurement traffic which on a metered link like yours where to ISP will throttle the rate after using up one's "high speed mobile data" allowance poses its own challenges.
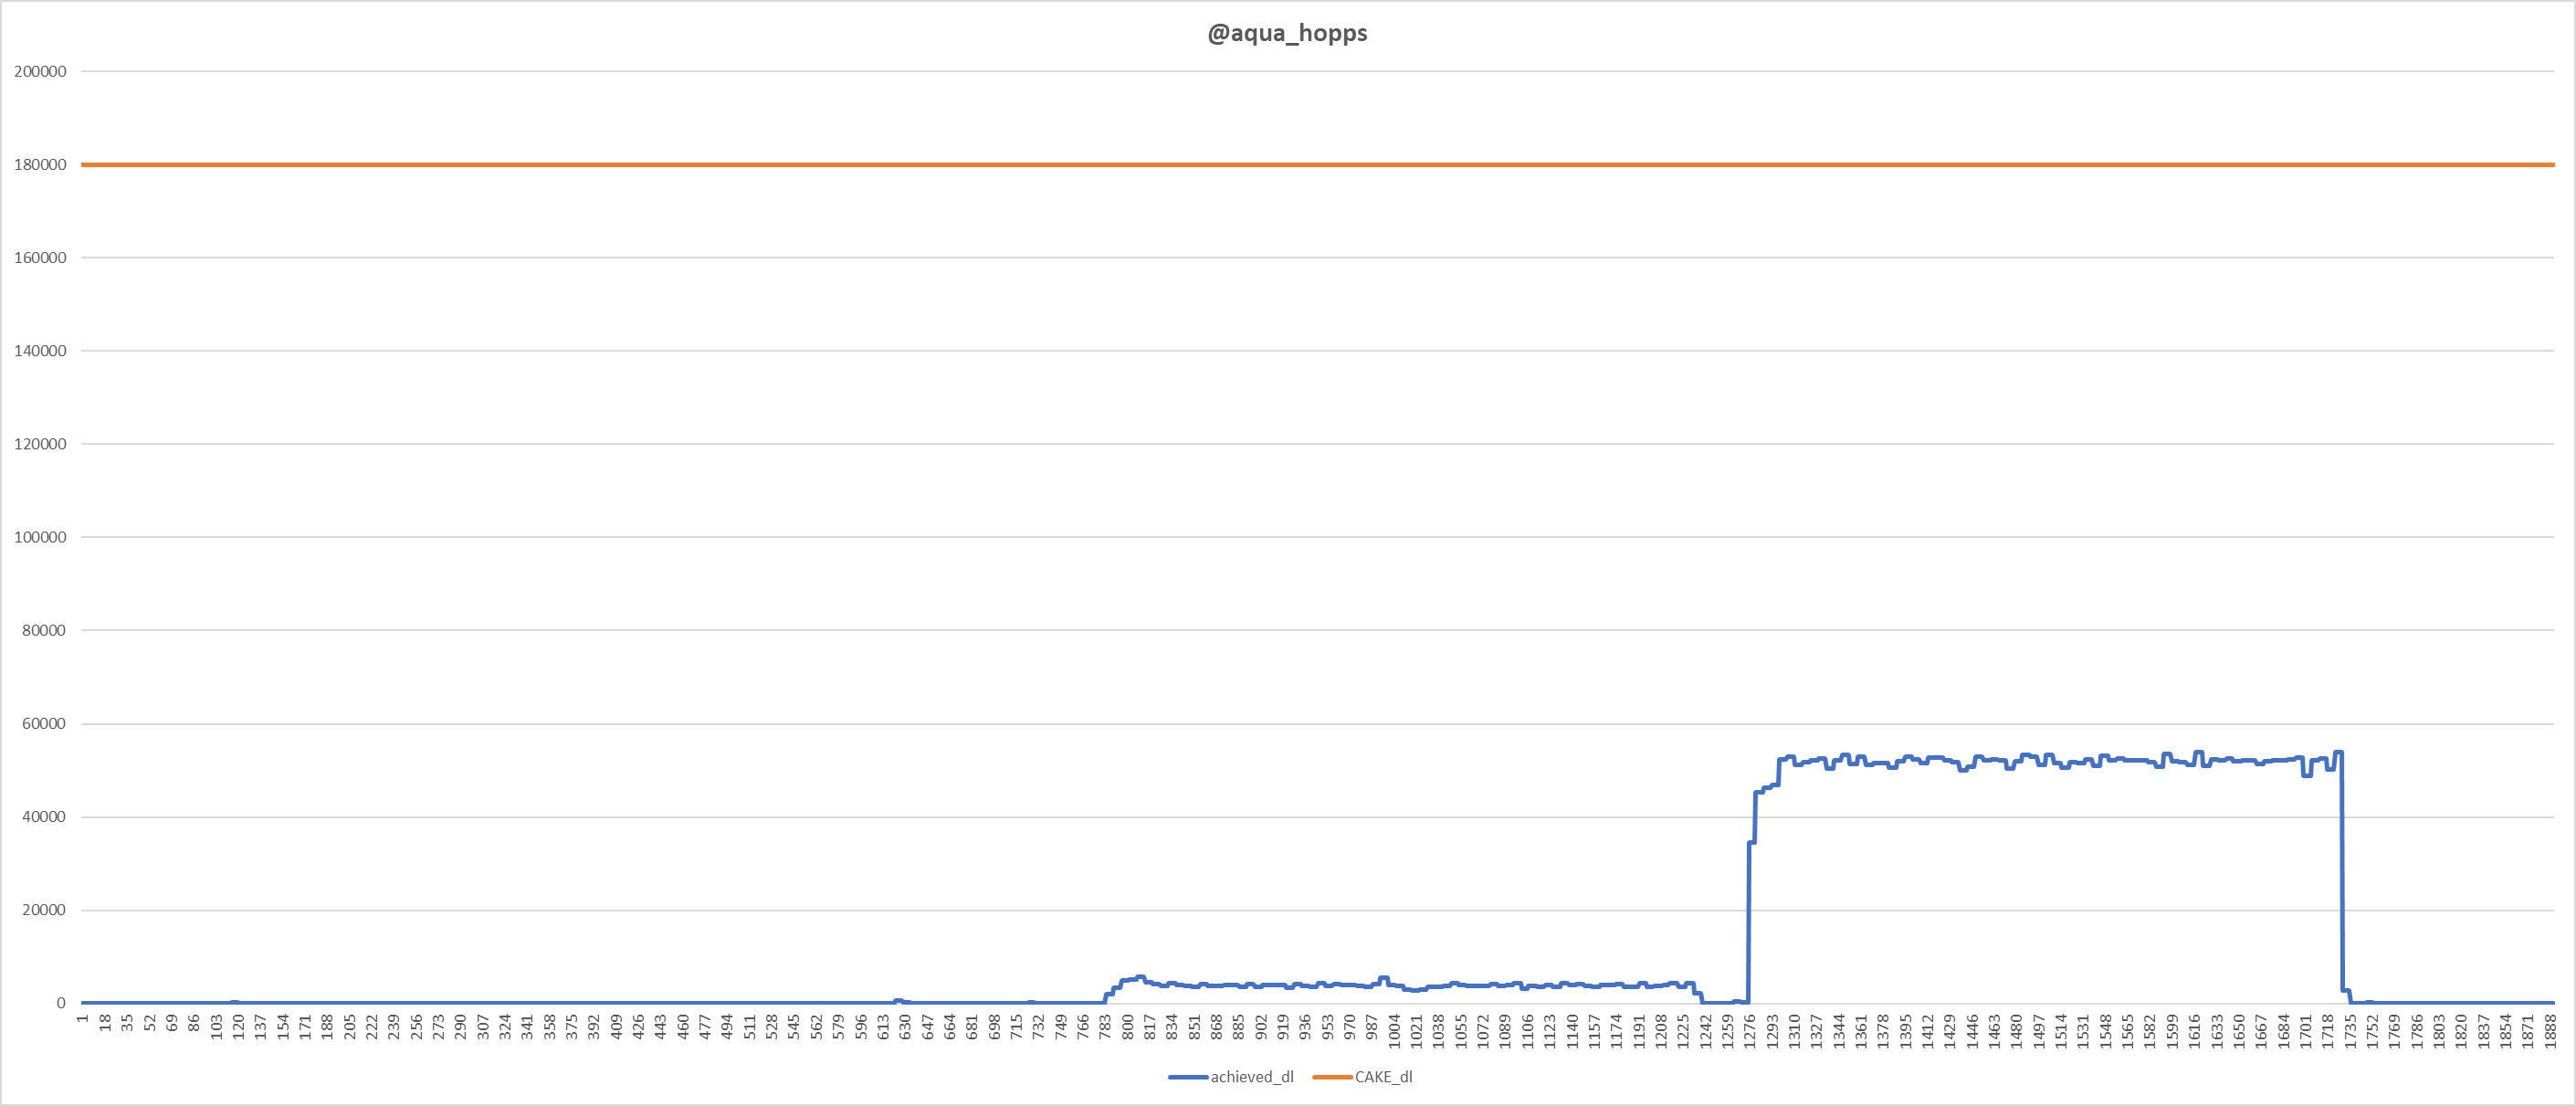
It's working for me flawlessly on the upload interface, but not for the download interface.
Even when matching out the baseline download bandwidth, the load is classified as low.
This prevented the download bandwidth from ramping up to the configured max bandwidth.
It would be nice if someone can guide me if I have misconfogiured something.
Here are my setup (transparent bridge): eth1 <--> eth0
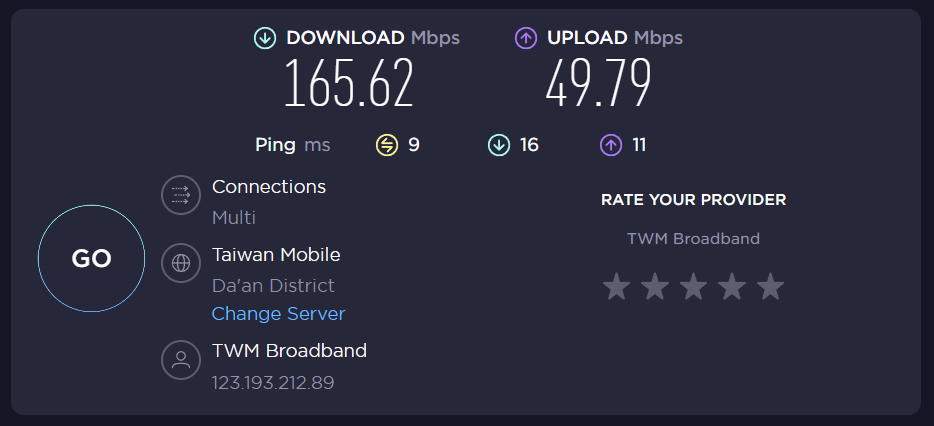
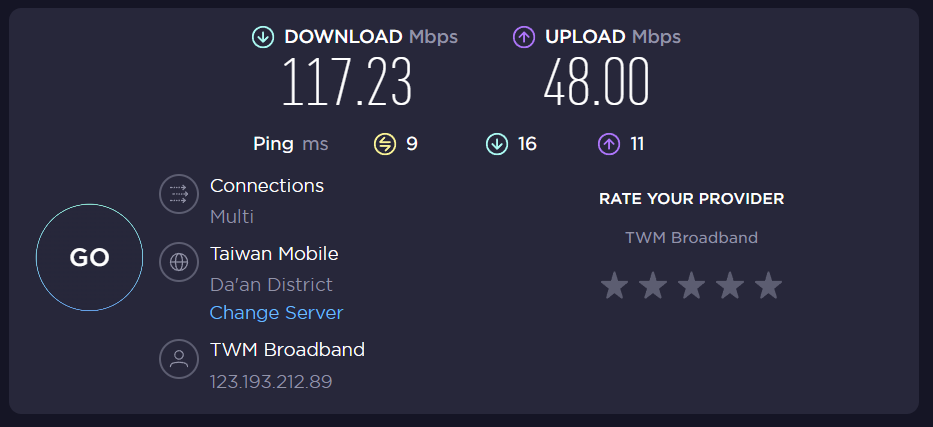
can you post the result of the speed test? Maybe a speedtest with sqm/autorare disabled, and one speedtest with SQM enables statically and no autorate.
It could be that your router is simply running out of CPU cycles when shaping at 185 Mbps. And if the achievable throughput stays below 75% of the shaper rate autorate will not increase the shaper rate.
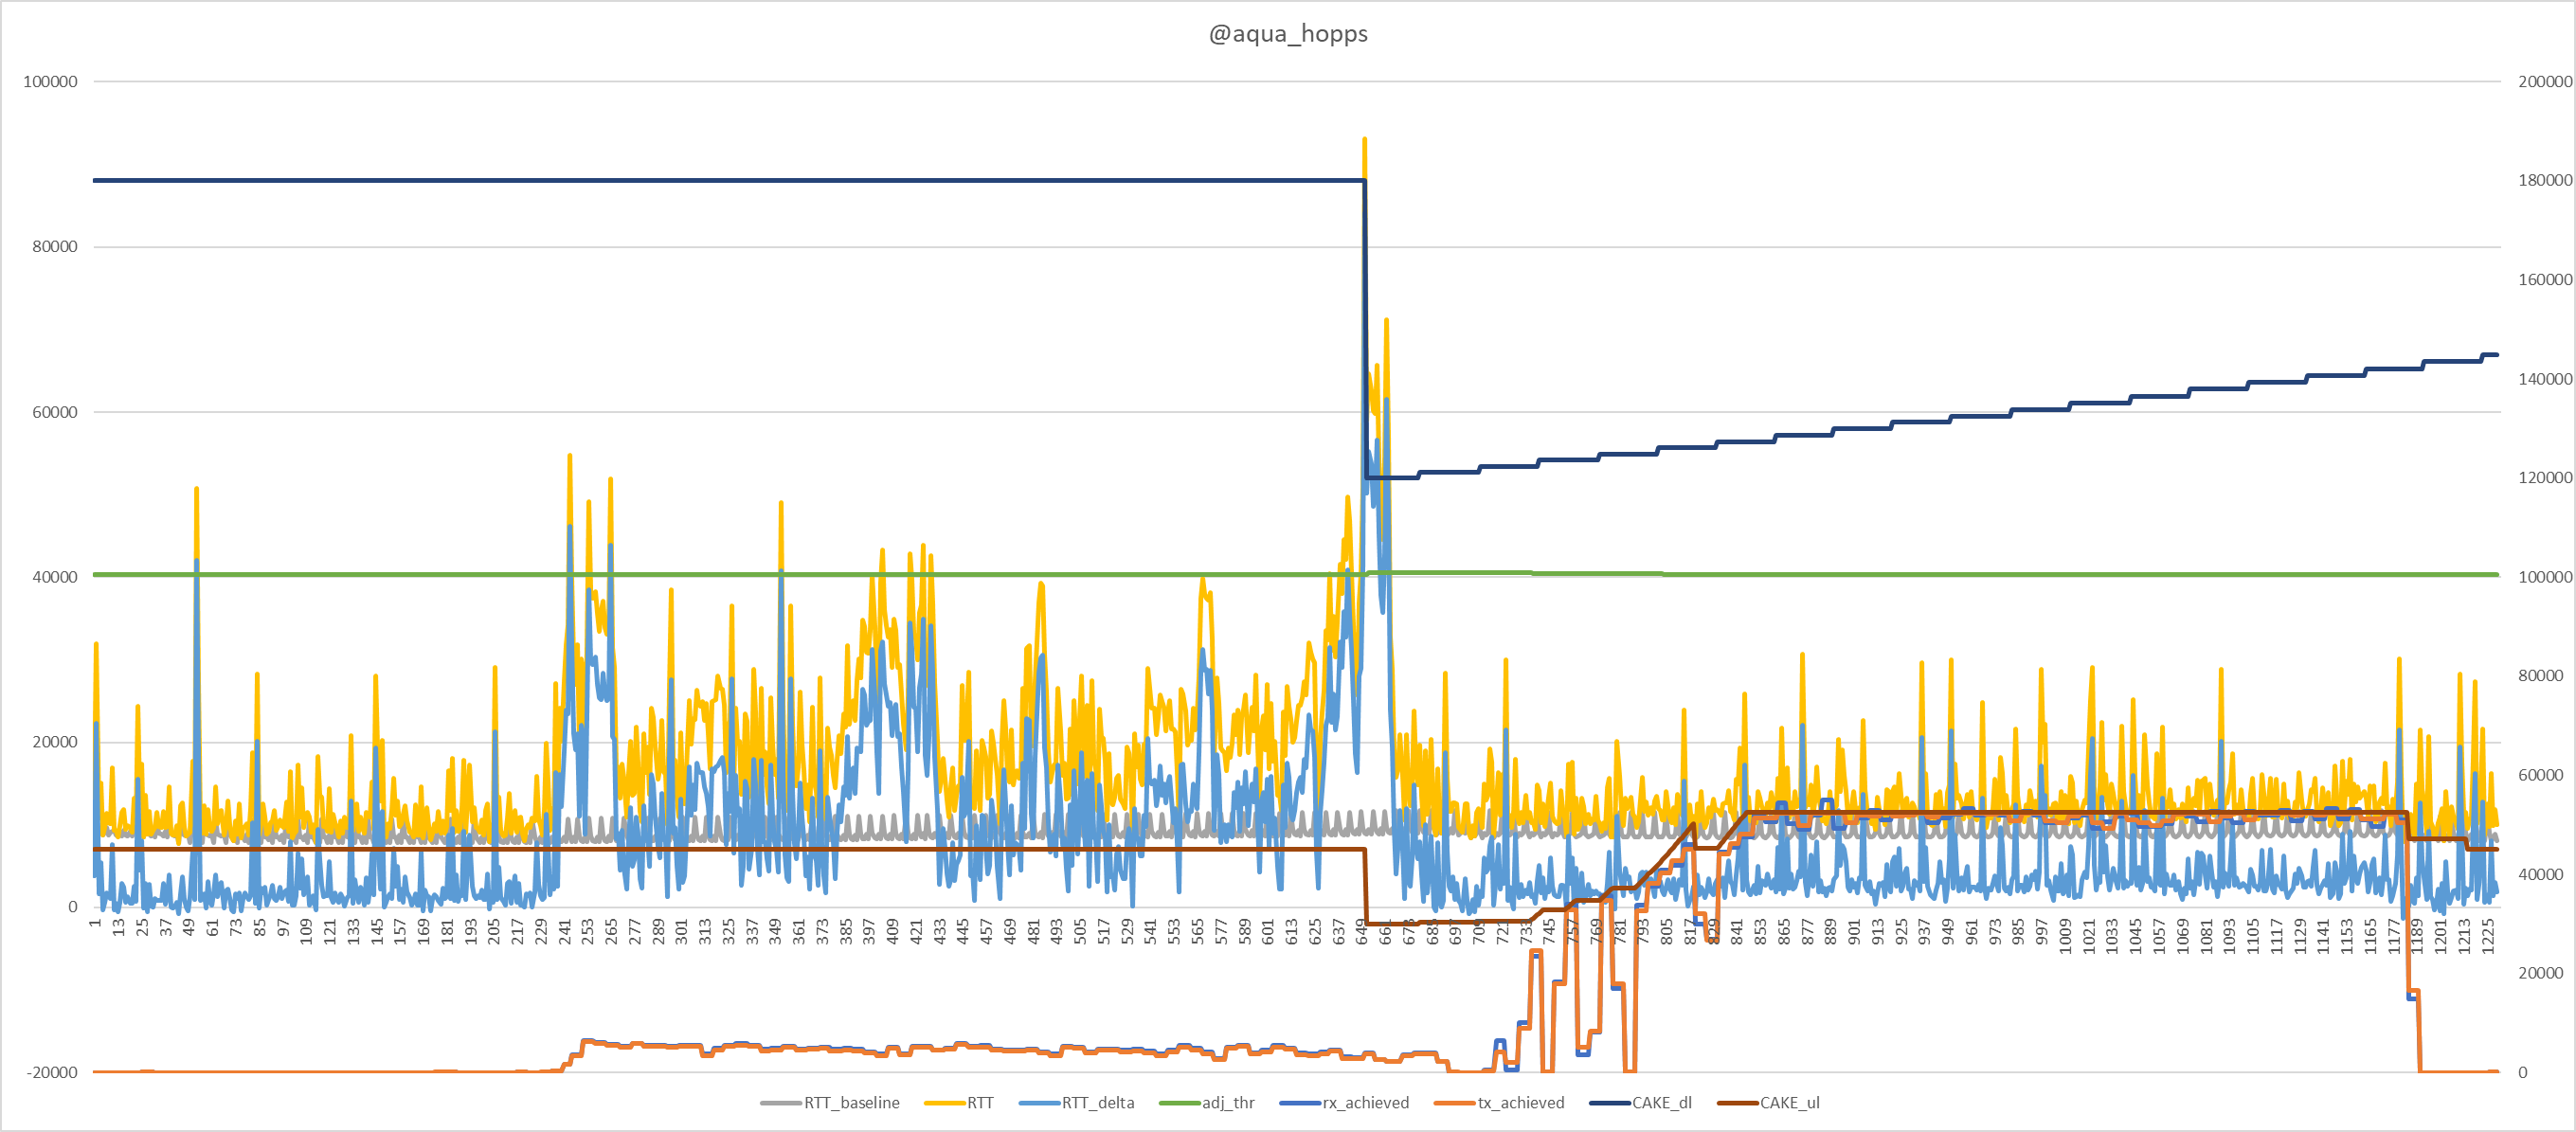
We can see that we are not close to the bandwidth limit for download. But it only stayed at the base threshold. However, we do see the upload bandwidth ramping up during load.
The OpenWRT system is running two threads from a ryzen 3600 in a VM. It should be powerful enough even for 1Gbps.
I don't have the most stable ISP. Often times during peak hours, the bandwidth drops.
This is why I see cake-autorate as an opportunity to setting an avg baseline and then ramping up the bandwidth if available.
Looking at the ping values under load in the no SQM case indicates some RTT increase under load, but given you 40ms threshold not sure why this is enough to throttle you from 207 down to 167?
# verify these are correct using 'cat /sys/class/...'
case "${dl_if}" in
    \veth*)
        rx_bytes_path="/sys/class/net/${dl_if}/statistics/tx_bytes"
        ;;
    \ifb*)
        rx_bytes_path="/sys/class/net/${dl_if}/statistics/tx_bytes"
        ;;
    *)
        rx_bytes_path="/sys/class/net/${dl_if}/statistics/rx_bytes"
        ;;
esac

case "${ul_if}" in
    \veth*)
        tx_bytes_path="/sys/class/net/${ul_if}/statistics/rx_bytes"
        ;;
    \ifb*)
        tx_bytes_path="/sys/class/net/${ul_if}/statistics/rx_bytes"
        ;;
    *)
        tx_bytes_path="/sys/class/net/${ul_if}/statistics/tx_bytes"
        ;;
esac

if (( $debug )) ; then
    echo "DEBUG rx_bytes_path: $rx_bytes_path"
    echo "DEBUG tx_bytes_path: $tx_bytes_path"
fi