In conjunction. the SQM setup will create the queues etc. This will simply modify the bandwidth settings of those queues.
1 Like
Is there a recommended queue?
Any congestion control change needed?
Currently, the Archer C7 v2 is using Cubic, but Reno is available.
I think it has to be CAKE
It's a misunderstanding to think that those settings affect anything. They only affect traffic to/from the router itself, so if it's downloading a package or similar.
Right.
What I was asking is what queue setup script?
piece_of_cake.qos
simple.qos
simplest_tbf.qos
layer_cake.qos
simplest.qos
it should be piece_of_cake or layer_cake depending on if you want the layers or not.
1 Like
Perhaps you will find this inspiring, on your curve fits: https://www.youtube.com/watch?v=dBHbLV7xEhc
1 Like
I am in a bad position to test, with a reliable fixed rate link, any auto-tuning is going to be noticeably worse that setting the correct rate.... so I do not have the correct reference to "bad" conditions without auto-tuning...
But I will still go and test (probably around the weekend), currently I am still playing with @Lynx shell version (for OpenWrt your lua harness/frameworks seems like a great way forward, but to include into sqm-scripts as an example a ideally pure shell version will be helpful no matter what; I would, if I manage to convince @tohojo after this has reached some level of maturity, to both include a shell example as well as a link to your nicer lua version).
No question there, the current shell script misses some sort of "stay the course"/cruise mode in which it just keeps the current rate. I think it is easy to come up with ideas here, but harder to test whether these do not introduce unexpected side-effects/corner-cases. Anyway, this is something I would like to revisit (probably after taking a deep look into your solution), but currently my play list contains:
- check the RTT detector for robustness against missing samples (what if one of the reflectors does not respond, what if no reflector responds in time). Well possible that the current script already does the right thing, but I really need to see that in action to trust it.
- try to convert as much of the math to pure shell math, I like bc, but for allowing faster cycle times and operation on flash starved routers less requirements would be better.
- revisit the one-way-delay measurement idea to independently control up- and downlink (this is tricky as ICMP timestamp requests are honored only by few servers and has some issues with huge offsets that might require to calculate deltaRTT per reflector* and then select from deltaRTTs instead of a single reference RTT).
*) and that has issues with posix sh not having arrays...
1 Like
@moeller0 I have had a chance to do some testing. There is some kind of bug with the passing of values to get_next_shaper_rate(), which results in:
20211110T105215.281622563;          0.57;          0.05;         47.02;         47.34;          0.32;      39272.00;      25000.00;
20211110T105216.373477610;          0.44;          0.03;         47.05;         50.00;          2.98;      20000.00;      25000.00;
I tried to debug by putting in echo commands but get weird invalid number / out of range error messages. But I think in any case it seems at least cur_rate_adjust_low is not getting set correctly:
sh: scale=10; 20000 - 1.5030 * (60000 - 20000)
20000: out of range
sh: scale=10; 25000 - 1.5030 * (35000 - 25000)
25000: out of range
Since the 1.5030 there should be 0.005.
It is not obvious to me why cur_rate_adjust_load_low is not getting set correctly?
If you try just putting in 'echo $cur_rate_adjust_load_low' after the setting of the local variable it screws up. So something is presumably broken there?
For now I have reverted the pull request and when either of us have fixed we can put it back in.
Fair enough, I will play around with my version a bit more
Well if using echo to return a value in a shell function then echo can not be used any more for debugging...
Ah, my bad.
I verified that the present version is working again.
Looking forward to trying @yelreve's script too sometime soon. Hopefully any benefits in that can be merged in.
@yelreve have you solved:
The above is hugely desirable but seems tricky.
Check this post out:
@tievolu deserves kudos for this contribution, and also for writing 1700 lines for his own personal DIY autorate script ![]() !
!
The challenge remains trying to amalgamate all these great ideas and promote collaboration. Here is another cheesy management graphic ![]() .
.

I used to work at a defence firm that was successful as a public body until it became part privatised and then all these moron managers came in with management degrees from mickey mouse universities, with their gantt charts and assigning hourly rates to everyone, internal budgeting, etc. And they gave themselves huge salaries and bonuses. Makes me annoyed even thinking about it actually.
1 Like
@moeller0 I reverted the revert because I figured out the issue. It was just a simple case of swapping $10 with ${10}.
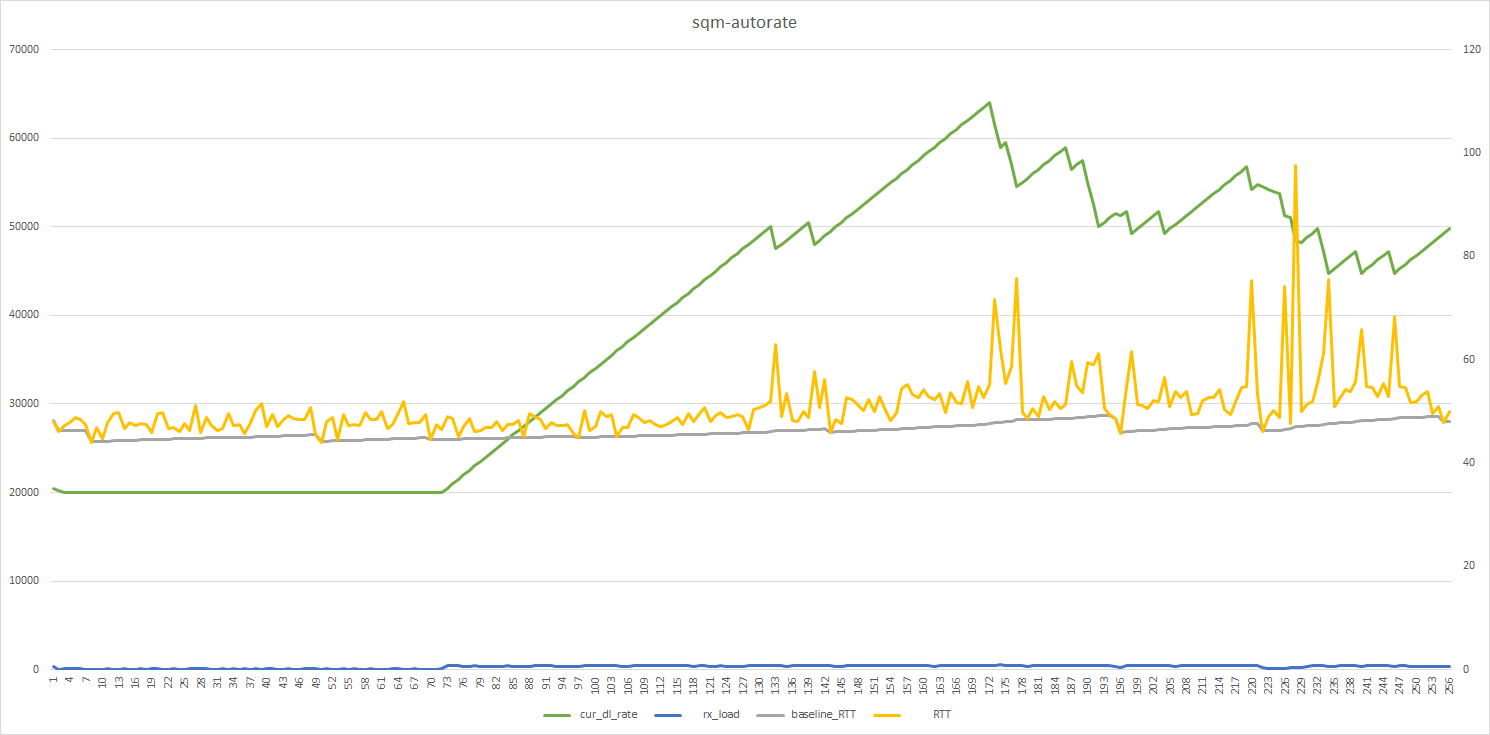
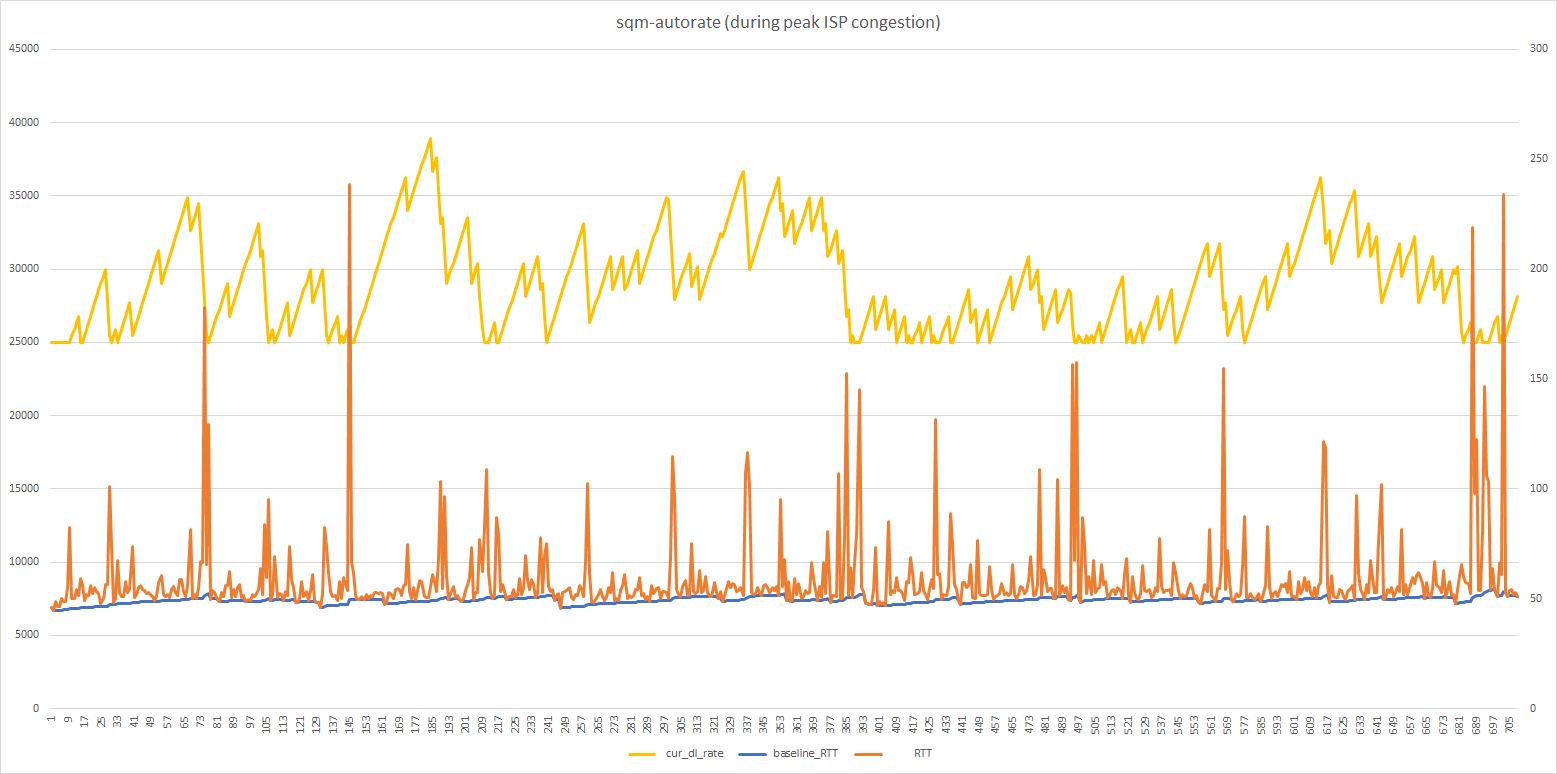
I tested the script with all your adjustments in the absolute worst time for ISP congestion and here is the result.
Raw data here:
Graph (worst time for ISP congestion - circa 10pm):
Compare with from earlier today (10am or so):

Albeit the latter is with the script without your commits. But perhaps the state prior to your commits is misleading because I always took the minimum of the minimum RTT?
@moeller0 do you suppose we'd need lower tick time for my connection to catch the bufferbloat before it results in such large spikes? Or am I ramping up too quickly?
@yelreve I really am going to test your solution soon. From my limited understanding of some of your concepts, I think they'd help here. Any thoughts on that and how it might perform when you see the above? As you can see my LTE connection during peak hours is super tricky to work with! Looks like the ramping up and down rate may indeed benefit from some form of dynamic adjustment along the lines I think you mention above (although I haven't yet got a solid grip on that yet).
1 Like
My hunch is that during congested epochs, our mild scale down might be too mild, and we need several steps to climb below the true bottleneck rate, and during all that time until cake is sending proper slow down signals, too much incoming/outgoing data accumulates in under-managed buffers and it just takes a while to service/clear those buffers and hence the measured bufferbloat get larger. Also the two plots seem to have different scales so the upper plot appears to have more frequent RTT spikes, but partly that seems to come from 3 times as much data points, no? A quick test for my hypothesis would be to significantly increase rate_adjust_RTT_spike maybe to 0.2, so just 5 steps instead of 20, that might help a bit (if only because we will spend more time climbing up to the true ceiling again and during the climb up we experience less/no bufferbloat).
That works, interesting! I had fixed it by using something like:
cur_rate_adjust_load_high=$9 ; shift 9
cur_rate_adjust_load_low=$1
But it seems it is only about $10 not being recognized as a number...
I have not changed that (yet). I more or less believe now that "min of mins" is an acceptable measure here (unless we get spurious 0ms results, but so far no indication that we do); and baseline_RTT is still the exponentially weighted moving average of the min-of-mins, because EWMA is a very cheap way to keep some history and persistence while still allowing to adapt to new baselines. I still assume that path changes that can structurally change the baseline RTT are relative rare.
It's probably $1 followed by the character 0
1 Like
Okay, so a single unresponsive reflector is just ignored, as it should be
# list of reflectors to use
reflectors="1.1.1.1 \
               8.8.8.8 \
               9.9.9.9
               1.2.3.4"


no_reflectors=$(echo "$reflectors" | wc -l)

RTTs=$( mktemp )

# ping config strings
ping_options_string="-w 1 -W 1 -Q 184"<># this is the full 8bit TOS value for EF (6bit dscp 46) Note to convert from decimal DSCP to decimal TOS multiply by four (or rather shift by two bits)


# get minimum RTT across entire set of reflectors
get_RTT() {

    for reflector in $reflectors;
    do
           if [ "$debug" -eq "1" ] ; then
               echo "current reflector: $reflector"
               echo "/usr/bin/ping ${ping_options_string} -i 0.01 -c 3 $reflector | tail -1 | awk '{print $4}' | cut -d '/' -f 2"
           fi
            echo $( /usr/bin/ping ${ping_options_string} -i 0.01 -c 3 $reflector | tail -1 | awk '{print $4}' | cut -d '/' -f 2 ) >> $RTTs&
    done
    wait
    RTT=$(echo $(cat $RTTs) | awk 'min=="" || $1 < min {min=$1} END {print min}')
    > $RTTs
}
That is 1.2.3.4 will time out after a second, increasing the cycletime somewhat, but probably still bearable, but if all reflectors fail to report a RTT the script breaks.... Will need to look into that.
1 Like
This sort of thing is part of the reason why my perl script ended up at ~1700 lines of code. Once you've got the core functionality working, the error handling work begins! I've got a whole load of stuff in my script to sensibly handle the connection going down and coming back up, among lots of other things.
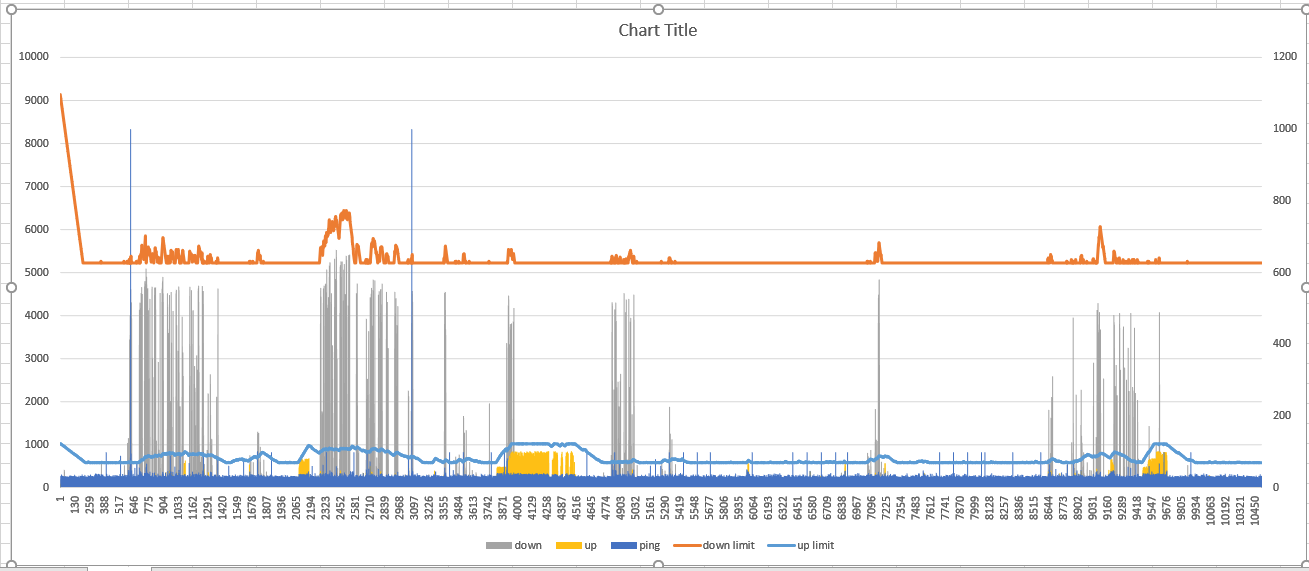
Just for fun here are a couple of plots of my script handling bufferbloat during periods of heavy usage, primarily on the upload side. I'm still using the opposite tactic of reducing the bandwidth limit when bufferbloat is detected, but it works pretty well, with RTT times very rarely going above 60ms. Pings are sent to three DNS servers every two seconds, and each point on the plot is a summary of 5 pings. Since I'm tracking request/response times separately with nping, you can also see how only the upload (top half of each plot) was modified in these two situations, while the download (bottom half) was left alone.

It's also interesting to see the breakdown of request/response times. I'm on a Virgin Media M350 cable connection (402.5 Mb down / 38.5 Mb up according to the modem), and my downstream latency is significantly lower and much more consistent than my upstream. Presumably that's a consequence of how DOCSIS works.
2 Likes
Yepp, looks like it. Now, my plan is to come up with a function to test reachability of the set of reflectors, to be run if no RTT estimate could be made and inform the user if all reflectors where down. In that case it makes sense to also reduce the rate quickly to the set minimum. And stop all other adjustments until RTT can be measured again.
BTW, I fully understand why most attempts at solving this issue have not used shell ![]() but I also believe that shell should allow to solve 80% of the problem, which might be good enough.
but I also believe that shell should allow to solve 80% of the problem, which might be good enough.
IMHO that is a policy question an admin needs to decide, as the best strategy depends on the goal/priority, do you want best throughput with bearable bufferbloat or do you want low bufferbloat with the highest rate that achieve that bufferbloat... Plus it probably varies depending on link properties. E.g. on my fixed rate link the script really does not help much. I tested with setting the limits to 100 and 120% of my normal shaper rate (with the upper limit above my true bottleneck rate) and @Lynx's script did the right thing, increasing rate under load gently enough to stay within the deltaRTT target while giving my 110/36.4 Mbps instead of my 100/36.0 Mbps I use for static shaping.
Ah, hence the distribution values.
Yes, that is one thing I also want to play with, following your lead/code (and list of known reflectors) with @Lynx's learning the baselineRTT approach, I guess I will just get local time when sending the requests im ms and subtract these fron the returned values, these clearly will not be interpretable as true one way delays, but all we need are the realtive changes of these values to their EWMA values, and that should not even need offset correction (as long as the values do not overrun shell variable size).
Maybe, maybe not, a DOCSIS request/grant cycle, the method in which the modem requests time slots to transmit data, takes around 2-4ms, with some optimizations to reduce that for sustained loads, while on the downstream the head-end simply schedules the different modems as it pleases without having to request permission to send, shaving off a few ms from the on-way delay. I have no hard data to base this on, but I would be amazed if that difference would be noticeable more than 10ms, and probably less. That wild guestimate however fits roughly with what is visible in your plots. Another reason for different one-way delays is that routing often is not symmetric for the path to and from an end-point and one might simply take the scenic route collecting a bit more transmission delay.
1 Like
Nice(!) - didn't think of that.
You can use netdev to monitor connectivity changes for a service. It will trigger a restart.
Here are some statistics from my ADSL.
I calculate the p95 as a baseline for rtt not the median and load threshold 0.1. (I want bursty youtube traffic to increase bandwidth)
1 Like
The one thing in my limited nping test I noticed was that the RTTs were pretty high compared to normal echo requests, not sue whether that was a fluke of 9.9.9.9 (which might actually direct to different back-end machines for the two different requests) or whether that is consistent... This might limit the number of RTT samples obtainable per cycle, but in all honesty, if we get samples from different reflectors a single sample per reflector seems sufficient.
Yes, the directional request/response times don't actually need to be perfectly correct - just consistent enough to compare with one another. "Correcting" them with an offset seemed easier at the time when I was converting my script from using regular ping to nping, since the rest of the script was (and still is) based on monitoring absolute ping times, rather than how they compare with previous pings.
The correcting-with-an-offset approach actually seems to work surprisingly well though, and the offsets for the ping targets I use are usually only of the order of a couple of milliseconds anyway once NTP has settled down after a reboot, unless the target server's clock is way off.