I should have noted in my version announcement post that I had the only reported case of this bug, but it was a bug nonetheless and we wanted to head it off before anyone else had a bad experience with it.
Ok, @Lynx if you want to plot particular sections, grab the julia code from the develop/juliavis branch... the last lines of this code are:
## plot a timeseries zoomed to a particular region:

plotts(dat,"zoomedts.png",(0,100))
you can change (0,100) to whatever range of x values you want, and simply copy and paste that into the Julia repl after first running the whole script... so for example you can do:
include("plotstats.jl") # will load and run the whole thing

plotts(dat,"zoomedts.png",(25000,25100))
which will plot 25000 seconds to 25100 seconds and put it in "zoomedts.png"
NOTE: do not edit the file and then rerun the whole thing, that'll take much longer, just this one line entered at the repl completes before your eye blinks. you can then enter it again and again... plotting whatever region you like.
I send a PR to split max_delta_owd into ul_ max_delta_owd and dl_ max_delta_owd and expose this in the config file. The reason is that on my link I see noticeably less latency under load in upstream compared to downstream direction and the only sane way to deal with that IMHO is to have independent thresholds.
This initially helps in getting upload to show some signs of control, but quickly fails as the baseline adjusts IMHO way too fast and with a 5 minute saturating load the shifting base line is just a reflection of the actual load caused congestion.
Got some more data 
I am running Max delta OWD as 25
Current config:
option transmit_kbits_base '25000'
        option receive_kbits_base '45000'
        option transmit_kbits_min '10000'
        option receive_kbits_min '25000'
CSV's:
https://drive.google.com/drive/folders/16pFADXK_kmd54g1GMpIhRP9xd6eENYmV?usp=sharing
I am still getting noticably more of "this site can't be reached" when browsing on chrome
And there is definitely some oscillation going on when looking at upload speeds, it goes up very fast and decent, and then absolutely drops like a stone, this is unlike my previous experiences.
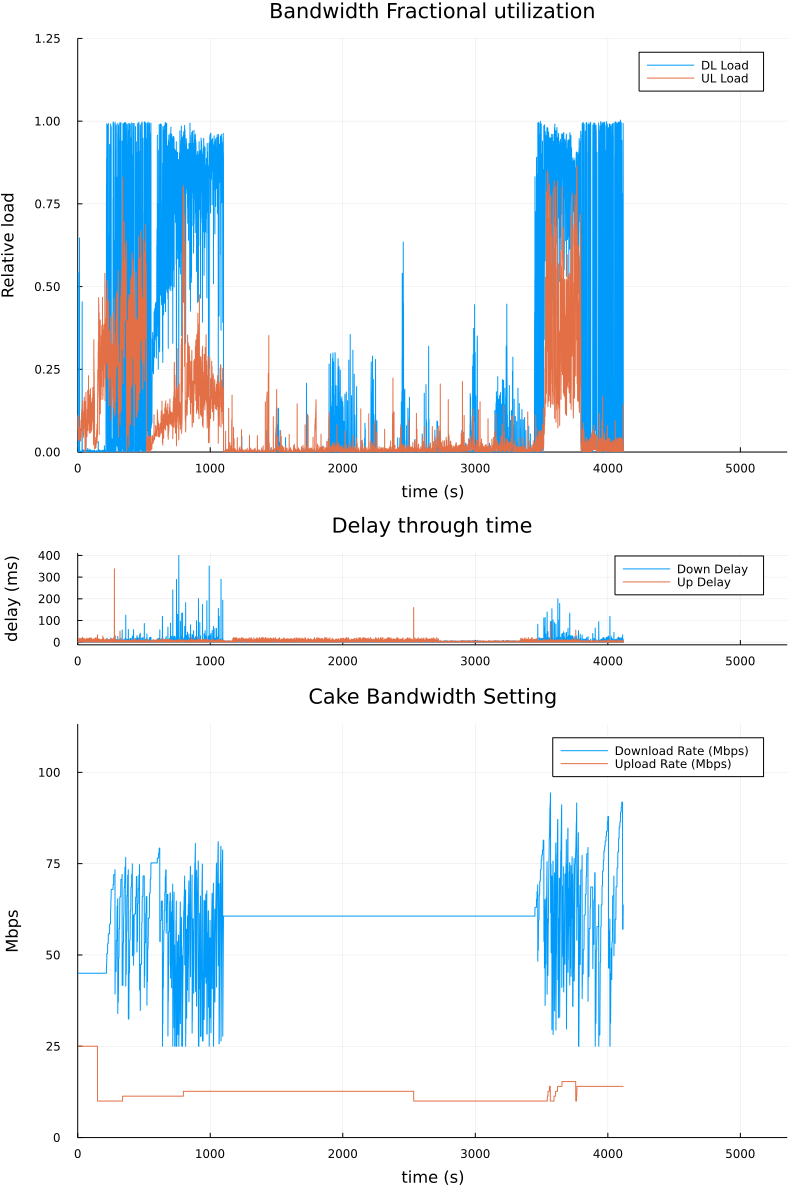
Plotted data:

I will need a bit of time to look at the CSV files themselves. Yeah, something still needs some tuning here. But that's why we test and greatly appreciate your willingness to put up with the pain points while we improve together. 
...
Well that didn't take too long...
1641411551,944241523,0.001672,0.066000,0.792430,8.503760,45000,25000
1641411552,447413293,0.001898,0.051554,2.727457,34.044649,45000,10000
34+ ms delta.
1641413937,648459721,0.000656,0.009891,0.416508,8.028999,60639,12669
1641413938,152356287,0.000320,0.000926,4.382111,160.031899,60639,10000
160+ ms delta. Yikes!
2 Likes
Thank's @_FailSafe please do tell me if there is anything you want me to test, or if longer runs are needed or anything similar
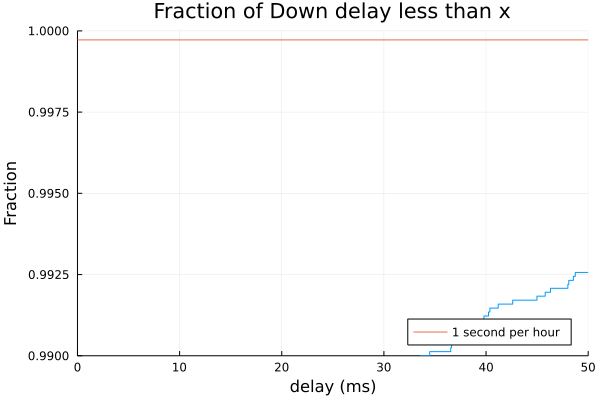
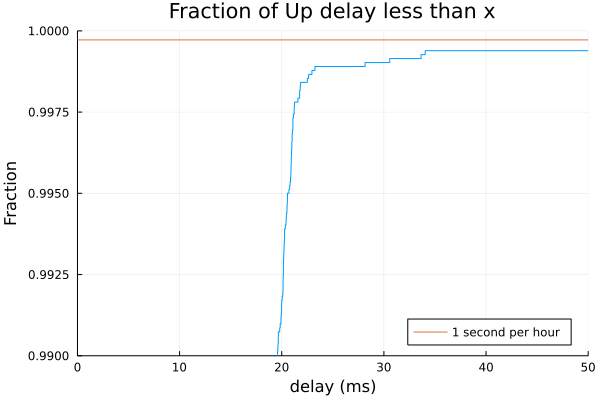
EDIT: yeah, the famous 3 digits i spoke off on my line  they happen, and I am certain that as long as I want to experiment with maximizing throughput, they are unavoidable
@_FailSafe can you use the latest julia thing to plot that timeseries for times (0,1200)? It looks to me like that would be really interesting to see zoomed.
Also I think @moeller0's idea of splitting up and down delay triggers may be necessary for @Nomid as well. we should definitely consider that.
I'm thinking a learning period where we run at minimum rates and just watch what the delay does may be a good way to set the triggers...
1 Like
@Nomid I wonder what your latency spikes are all about. Can you remind me what your LTE stats are again? You get fantastic throughout.
Out of curiosity have you tried going through a VPN? My ISP applies some traffic shaping so I have everything go over WireGuard.
| CSQ : | 31 | |
|---|---|---|
| Signal Strength : | 100% | |
| RSSI : | -52 dBm | |
| ECIO3G/RSRQ4G/SS_RSRQ5G : | -14 dB | |
| RSCP3G/RSRP4G/SS_RSRP5G : | -83 dBm (RxD -140 dBm) | |
| SINR : | 16 dB |
I need some new pigtails for my modem, but other than that it looks OK
I have considered a VPN, but i haven't convinced myself and my lazy side
Yeah, if we saturate the load for a long time with no even brief periods of rest, and no amount of adjusting the rates causes the latency to fall back... then the baseline will wind up too high. But I think this means that minimum is set too high? Because dropping down to minimum should cause latency to reset?
Mmmh, so switching from:
table.insert(up_del, owd_recent[reflector_ip].up_ewma - owd_baseline[reflector_ip].up_ewma)
                         table.insert(down_del, owd_recent[reflector_ip].down_ewma - owd_baseline[reflector_ip].down_ewma)
to
                        table.insert(up_del, owd_recent[reflector_ip].ul_current_owd_ms - owd_baseline[reflector_ip].up_ewma)
                         table.insert(down_del, owd_recent[reflector_ip].dl_current_owd_ms - owd_baseline[reflector_ip].down_ewma)
so taking the raw OWDs instead of low pass filtered versions and changing local slow_factor = .9 to local slow_factor = .995, as well as setting:
        option transmit_OWD_threshold_ms '5'
        option receive_OWD_threshold_ms '10'
finally got me a version that survives my 5 minute bidirectional saturation stress test, without any of the final rates being totally unreasonable....:
[INFO - 20220105T22:28:58]: next_ul_rate 27533 next_dl_rate 103766
[INFO - 20220105T22:28:59]: reflector: 9.9.9.11 up_del: 0.90188308596799  down_del: 0.92514003902876
[INFO - 20220105T22:28:59]: reflector: 176.9.93.198 up_del: 0.9409435206  down_del: 0.69191912678638
[INFO - 20220105T22:28:59]: reflector: 149.112.112.112 up_del: -0.0063055118483319  down_del: 0.74202667118637
[INFO - 20220105T22:28:59]: reflector: 176.9.1.117 up_del: -0.039999897757289  down_del: 0.99499990216035
[INFO - 20220105T22:28:59]: reflector: 51.89.30.51 up_del: 0.96521217452258  down_del: -0.03919523972607
[INFO - 20220105T22:28:59]: up_del_stat 0.90188308596799 down_del_stat 0.74202667118637
[INFO - 20220105T22:28:59]: next_ul_rate 27533 next_dl_rate 103766
[INFO - 20220105T22:28:59]: reflector: 9.9.9.11 up_del: 0.89737367053815  down_del: 0.92051433883361
[INFO - 20220105T22:28:59]: reflector: 176.9.93.198 up_del: 0.936238802997  down_del: 0.68845953115245
[INFO - 20220105T22:28:59]: reflector: 149.112.112.112 up_del: 0.98872601571091  down_del: 0.73831653783044
[INFO - 20220105T22:28:59]: reflector: 176.9.1.117 up_del: -0.0079999795514603  down_del: 0.99002490264955
[INFO - 20220105T22:28:59]: reflector: 51.89.30.51 up_del: -0.03461388635003  down_del: 0.95600073647256
[INFO - 20220105T22:28:59]: up_del_stat 0.89737367053815 down_del_stat 0.92051433883361
[INFO - 20220105T22:28:59]: next_ul_rate 27533 next_dl_rate 103766
[INFO - 20220105T22:29:00]: reflector: 9.9.9.11 up_del: 0.89288680218546  down_del: 0.91591176713944
[INFO - 20220105T22:29:00]: reflector: 176.9.93.198 up_del: 0.93155760898201  down_del: 0.68501723349669
[INFO - 20220105T22:29:00]: reflector: 149.112.112.112 up_del: -0.011217614367645  down_del: 0.73462495514129
[INFO - 20220105T22:29:00]: reflector: 176.9.1.117 up_del: -0.0015999959102935  down_del: -0.0099252218637016
[INFO - 20220105T22:29:00]: reflector: 51.89.30.51 up_del: -0.034440816918277  down_del: 0.95122073279019
[INFO - 20220105T22:29:00]: up_del_stat -0.0015999959102935 down_del_stat 0.73462495514129
[INFO - 20220105T22:29:00]: next_ul_rate 27533 next_dl_rate 103766
[INFO - 20220105T22:29:00]: reflector: 9.9.9.11 up_del: 1.8834223681745  down_del: 0.91133220830375
[INFO - 20220105T22:29:00]: reflector: 176.9.93.198 up_del: -0.068100179062899  down_del: 0.68159214732921
[INFO - 20220105T22:29:00]: reflector: 149.112.112.112 up_del: 0.98383847370419  down_del: 0.73095183036558
[INFO - 20220105T22:29:00]: reflector: 176.9.1.117 up_del: 0.99340800406926  down_del: -0.0098755957543837
[INFO - 20220105T22:29:00]: reflector: 51.89.30.51 up_del: 0.96073138716631  down_del: 0.94646462912624
[INFO - 20220105T22:29:00]: up_del_stat 0.98383847370419 down_del_stat 0.73095183036558
[INFO - 20220105T22:29:00]: next_ul_rate 27533 next_dl_rate 103766
The link syncs at 110/31 which results in a maximum gross shaper rate equivalent of (11064/65) = 108.31 and (3164/65) = 30.52 (to deal with PTM's 64/65 encoding, where every 65th octet is a control byte and not payload).
It even survived a second 5 minute stress test with acceptable wiggling around the true (fixed) bottleneck rates. And best of all it did not need hours of burn-in to achieve that  (but a fixed rate link should be easy to autorate).
you can make the comparison be continuously as close to most recent as you like by setting fast factor near 0 without code modifications. Fast and slow factors are something we haven't been optimizing at all so far. Can you try with fast factor 0.1 or 0.05 and slow factor 0.995 ?
There is some reason to use some filtering with the fast version, as we can experience very brief transient delays that aren't indication of bufferbloat really.

@Nomid Are you running any background traffic like torrents or any other sizable downloads at the same time you're speed testing?
Nah, I have not tackled that issue yet, minimum rates are still at 1500...
Well, with the changes described above it went well, and a concurrent gping to 8.8.8.8 showed that the RTT was not continuously raised but fell back to what I assume true path related delay, so the EWMA probably could replenish. I do not consider a 5 minute saturating load that exotic (have a look at the sized or recent game updates that on a slow link will hog the lines for longer than 5 minutes).
No it never did that. My assumption is that the recent_ewma instead of the raw_OWD smoothed down the latency spikes enough to rarely trigger a supra threshold delay event and hence the EWMAs happily "ate" the increased congestion OWDs and adjusted upward enough that in spite of apparent bufferbloat in the gping, autorate never noticed.
gotcha, can you try original code with fast factor 0.1 or 0.05?
Perhaps i should have clarified methodology a bit ![]() I apologize
I apologize
Torrenting is basically my speedtest, so nicely spotted, there is a waveform test in there somewhere, which came out an A (which is actually unusual, on it's own with no load it never happens, unless i clamp my line down to 15/25 Mbit, i have high 2 digits to 3 digits latency). I usually set up a 4K stream on one laptop, some torrenting on another, and then i do some web browsing on a 3 machine to get a feel of the line when trying to stress SQM and the Lua
But why should I? Recent EWMA is used in two places, one I agree with (decreasing the baseline quicker if the baseline was higher than the current sample, but gently) and one I do not think as optimal (the one in ratecontrol()). These are conceptually two different things that will IMHO not be served well with one fast_factor, and on theoretical grounds I think ratecontrol() should work on raw OWDs. (A low pass filtered spike will be less likely to trigger a rate change, but still increases the baseline)
Why? Low-pass filtering the OWDs makes IMHO very little sense, while low-pass filtering the baseline does make some sense (less chance of crazy oscillations in the difference between the two). I do not see how one EWMA can fit both purposes here. But I might be overlooking something...
This is exactly the kind of tea leaf reading I would very much like to avoid, especially doing that at different places in opposing directions. As I said, taking the 3rd lowest sample increases sensitivity, but taking deltas from the EWMAs decreases sensitivity, why not only adjust sensitivity at one place?
If our OWD measurements are untrustworthy, let's improve them or add another layer of simple RTT measurements as on-line sanity check, but let's not op n the can of worms trying to divine bad from acceptable OWD excursions. That way lays madness (that is I will not be able to understand things anymore, my push to keep things as simple as possible comes from my limited capacity to understand cleverer approaches).
1 Like
Because after putting in hundreds of hours of development the team who wrote all this for the benefit of the community would love to benefit from understanding better how things behave?
2 Likes
Puzzled, I thought we have a pretty good understanding of what the fast_factor and use of recent_ewma in ratecontrol() does to the detected delta_owds: it acts as a low pass filter which mostly reduces the magnitude of individual delta_owds thereby reducing the sensitivity of the script implicitly.
If the argument is that there are too many OWD spikes close to the threshold that are not access link congestion related the cleanest solution would be to simply explicitly increase the threshold values directly, no?
But theory is theory and data is data:
method: ewma: recent_ewma - baseline_ewma; raw: recent_current_owd_ms - baseline_ewma
fast: baseline_calculator slow_factor
slow: baseline_calculator fast_factor
ul_max_delta_owd: OWD threshold for upload
dl_max_delta_owd: OWD threshold for download
sane_deltas: do the per reflector reports contain artificial zeros
sane_final_rates: are both rates below the known bottleneck capacity of the link
method  fast  slow  ul_max_delta_owd  dl_max_delta_owd  sane_deltas sane_final_rates
ewma    0.05  0.995       5ms              10ms              no          yes
ewma    0.05  0.9         5ms              10ms              no          no
ewma    0.05  0.99        5ms              10ms              no          semi (might have stopped at unfortunate time)
raw     0.2   0.995       5ms              10ms              yes         yes
all configurations tested with a five minute bidirectionally saturating flent test.
2 Likes
will take a look at that a bit later. My biggest concern in the absence of any filtering on the current tick is that the entire line can suffer hiccups of tens or even hundreds of ms of delay which can make all of the reflectors appear to be bufferbloated and cause the rates to drop to a minimum all at once. It's not clear that this is easily avoidable, or that the fast ewma is the solution, but it is a known problem that several people have experienced. Just accepting each and every ping as actually representative of some sort of "reactable delay" is not necessarily going to work well for many people. Setting the trigger higher also isn't necessarily ok either. These delay spikes can be 50 or 150 ms and setting 150ms as a trigger will be largely useless
as I said, will look into this later thanks for the testing.