Yes, pinging reflectors located on the WAN side will not show LAN_side WiFi bufferbloat. I think redoing his test with internal reflectors should help. And I agree he needs to use purely internal reflectors. This just illustrates that GiGo is still alive and well, or rather that configuring your script has some hidden dragons.
Yes, still does, but it is important to select the reflectors such thatt they all live on the remote side of the problematic link.
I'm pinging downstairs AP (Ethernet connected) and upstairs AP (wireless connected). Wouldn't it make more sense a median in this case? My thinking is the Ethernet connection is FDX and won't suffer much. Another approach might be just drop pinging downstairs AP and just ping upstairs one getting the minimum value, I reckon.
Hi i try yesterday the script with VDSL connection.
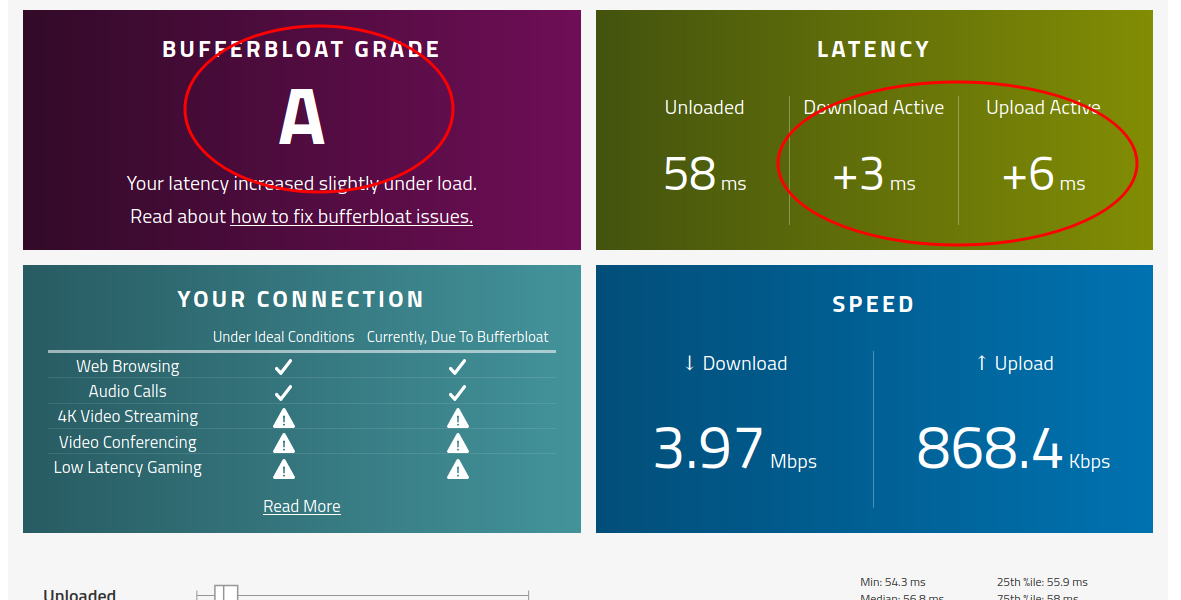
For sure seems that is working and drop bufferbloat even in high load traffic...3 linux iso downloads+android TV+upload video to Youtube all at the same time and doing speedtest to see what it can do.
Pc wasn't in first priority from firewall DSCP tag and i use layer cake in SQM.
I realize 3 "problems" until now.
First problem is that i put the file to create the service to enable it via Luci but when i "click" to enable and then click "start" it looks like it starts the service i think...then i go to another menu in Luci..etc SQM and going back in services tab..service is "disabled" not enabled.
Why this is happening?
Also no logs in file.
Biggest problem was when try to play online.
Many many times was disconnected from game servers during gameplay...i cannot finish neither one game session..during gameplay was disconnected..it look likes internet drop off and connects back...or to many packet loss etc.
I dont think it is packet loss because somehow i will be "finding" it during several speedtests.I think that it totally "drops internet" for etc 2 seconds but it is enough to disconnect me from game because it is real time..all of you..you understand what i mean.
Settings was ...
Looks pretty good there, no? Hey @moeller0 we have turned that GiGo into G.I. Joe - he will: 'bust a cap' in that bufferbloat ass!
How do you rate the performance in your WiFi case @amteza and what changes have you made over the default? How did you get tick of 0.1s? I assumed such low values would not be possible in shell.
It seems the overall simple routine in the shell script works. Perhaps just some tweaking needed now to make it more robust or to implement in C? Any thoughts @moeller0?
@Knomax I don't know why the service file is not launching the script. Is it in /root with 'chmod +x' set? You have set a very low minimum bandwidth which presumably lingers after manual run and then stays there since the service file does not execute script. Just a guess.
Based on @Lynx algorithm I devised something on my own.
Calculate/update median ping via this simple online algorithm: FAME
If delta > 5ms
  if rx_load>tx_load
    reduce download speed as Lynx dictates (rate_adjust_RTT_spike)
    reduce upload speed half of (rate_adjust_RTT_spike)
  else
    reduce upload speed as Lynx dictates (rate_adjust_RTT_spike)
    reduce download speed half of (rate_adjust_RTT_spike)
else
   try to increase bandwidth as Lynx dictates: rate_adjust_load_high
make sure that speed is not exceeding maximum or minimum
Python:
#!/usr/bin/env python3
from multiping import multi_ping
import subprocess,time
def command(argument):
try:
data=subprocess.run(argument.split(),check=True,capture_output=True)
return data
except:
raise
class RunningPercentile:
def __init__(self,x,step=1):
self.step = max(x/2.0,step)
self.x = x
#print(x,self.step)
def push(self, observation):
if self.x > observation:
self.x -= self.step
elif self.x < observation:
self.x += self.step
if abs(observation - self.x) < self.step:
self.step /= 2.0
addrs = ["8.8.8.8", "1.1.1.1"]
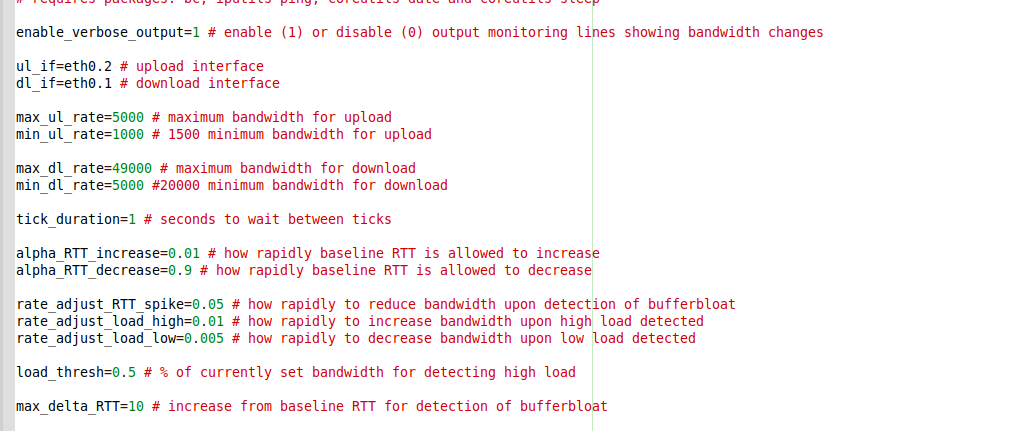
ul_if="pppoe-wan" # upload interface
dl_if="ifb4pppoe-wan" # download interface
cur_ul_rate=max_ul_rate=1000
min_ul_rate=500
cur_dl_rate=max_dl_rate=9157
min_dl_rate=4000
tick_duration=1 # seconds to wait between ticks
rate_adjust_RTT_spike=0.05 # how rapidly to reduce bandwidth upon detection of bufferbloat
rate_adjust_load_high=0.01 # how rapidly to increase bandwidth upon high load detected
max_delta_RTT=5 # increase from baseline RTT for detection of bufferbloat
def read_bytes(x,mode):
with open("/sys/class/net/"+x+"/statistics/"+mode) as f:
for line in f:
return(int(line))
def myping():
try:
responses, no_responses = multi_ping(addrs,10)
return(1000*min(responses.values()))
except:
return(1000)
mean=RunningPercentile(myping())
t_prev_bytes=time.time()
prev_rx_bytes=read_bytes(dl_if,"rx_bytes")
prev_tx_bytes=read_bytes(ul_if,"tx_bytes")
#print(prev_rx_bytes)
#print(prev_tx_bytes)
def update_rates():
global prev_rx_bytes
global prev_tx_bytes
global t_prev_bytes
global cur_dl_rate
global cur_ul_rate
current_ping=myping()
delta_RTT=current_ping-mean.x
mean.push(current_ping)
#print(delta_RTT,mean.x)
cur_rx_bytes=read_bytes(dl_if,"rx_bytes")
cur_tx_bytes=read_bytes(ul_if,"tx_bytes")
t_cur_bytes=time.time()
rx_load=(8.0/1000.0)*(cur_rx_bytes-prev_rx_bytes)/(t_cur_bytes-t_prev_bytes)*(1.0/cur_dl_rate)
tx_load=(8.0/1000.0)*(cur_tx_bytes-prev_tx_bytes)/(t_cur_bytes-t_prev_bytes)*(1.0/cur_ul_rate)
t_prev_bytes=t_cur_bytes
prev_rx_bytes=cur_rx_bytes
prev_tx_bytes=cur_tx_bytes
if delta_RTT > max_delta_RTT:
if rx_load > tx_load:
cur_dl_rate=cur_dl_rate-rate_adjust_RTT_spike*(max_dl_rate-min_dl_rate)
cur_ul_rate=cur_ul_rate-rate_adjust_RTT_spike*.5*(max_ul_rate-min_ul_rate)
else:
cur_dl_rate=cur_dl_rate-rate_adjust_RTT_spike*.5*(max_dl_rate-min_dl_rate)
cur_ul_rate=cur_ul_rate-rate_adjust_RTT_spike*(max_ul_rate-min_ul_rate)
else:
cur_dl_rate=cur_dl_rate + rate_adjust_load_high*(max_dl_rate-min_dl_rate)
cur_ul_rate=cur_ul_rate + rate_adjust_load_high*(max_ul_rate-min_ul_rate)
if cur_dl_rate<min_dl_rate:
cur_dl_rate=min_dl_rate
if cur_ul_rate<min_ul_rate:
cur_ul_rate=min_ul_rate
if cur_dl_rate>max_dl_rate:
cur_dl_rate=max_dl_rate
if cur_ul_rate>max_ul_rate:
cur_ul_rate=max_ul_rate
print("%.2f; %.2f; %.2f; %.2f; %.2f; %.2f; %.2f; %.2f;" % (rx_load,tx_load,mean.x,mean.step,current_ping,delta_RTT,cur_dl_rate,cur_ul_rate), file=open("/tmp/autorate.txt","w"))
while True:
t_start=time.time()
update_rates()
command("tc qdisc change root dev " + ul_if + " cake bandwidth " + str(int(cur_ul_rate)) + "Kbit")
command("tc qdisc change root dev " + dl_if + " cake bandwidth " + str(int(cur_dl_rate)) + "Kbit")
t_end=time.time()
sleep_duration=tick_duration-(t_end-t_start)
if sleep_duration > 0.0:
time.sleep(sleep_duration)
Wrong permissions in file....service working now.
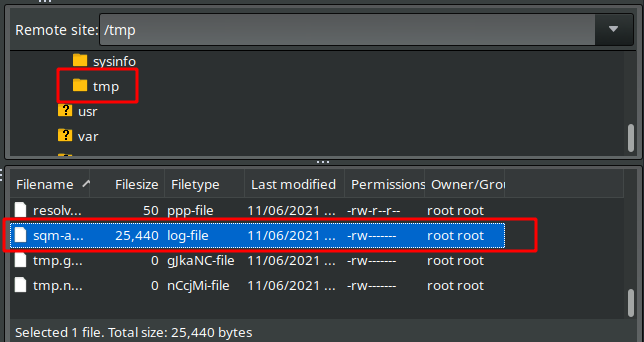
What about log file it increases Filesize continuously!!!!!!
If router running 24hours can be to big.
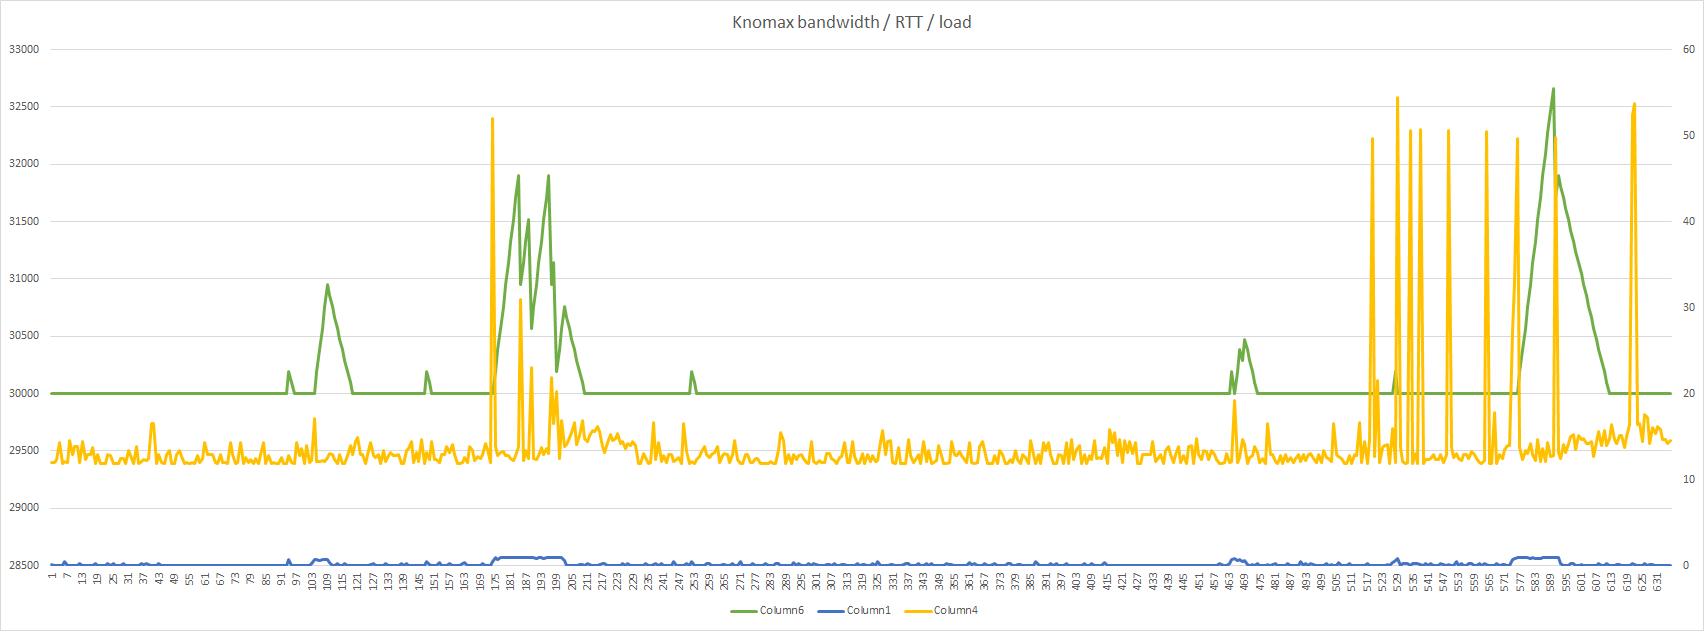
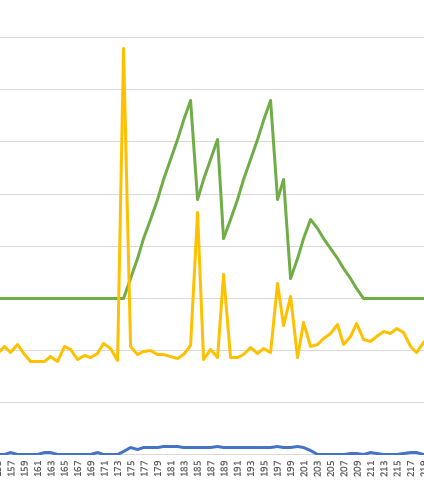
Following the first unexpected ping spike, this looks like what I expect to see - bandwidth (green) increases until RTT (orange) spikes occur or load (blue) goes low:
This is what the routine is designed to do.
What I am troubled by is that you appear to have ping spikes that are not associated with the bandwidth ramping up. In particular, this (presumably relating to your connection, not the script) looks bad to me:
If you have the script not running, and just set CAKE bandwidth to your minimum, and just run ping 8.8.8.8 do you see jumps from your baseline 12ms or so up to 60ms? Those jumps don't look healthy to me. Maybe you need to complain to your ISP.
I would first go at trying to clean it up in shell a bit and add few bits more of information (like adding a timestamp to each log entry, the differences between old and new rates, and potentially also information about the CPU load per CPU on the router). C is not my forte, and I love the flexibility of shell/other interpreted languages where users can make changes directly on their devices. Yes, shell is somewhat limited (especially posix compliant shell) but we might be able to work around its limitations (like using time in units of microseconds and just use integer arithmetic instead of floating point in bc/dc).
Well you can set tick to any old value, whether the cycle time actually meets that setting is another question this is why I propose to replace:
Here is an idea, if you plot rate as ratio between maximum and minimum you can simply add the load curves as additional lines to the plot (or scale everything to %)
@moeller0 are the ping spikes on the VDSL connection above not reflective of something that cannot be fixed with CAKE? Ping spikes to 50ms every now and then without load seems bad, no?
Yes these spikes look odd, in that they seem to be rate independent and pretty uniform in magnitude. These might (deep speculation) be related to some periodic work the router does, and which, if an RTT probe happens at the same time introduces such delay....
cpu gives the total over all CPUs but for thinns like cake we are intersted in the individual CPUs, because cake's CPU (e.g. cpu0) maxed out and the other CPU (e.g. cpu1) idle end up with cpu being report as 50% idle...
Wouldn't irqbalance always solve that? Or only sometimes? I don't understand why that's not enabled by default actually.
@Knomax what router do you use? Is your router CPU getting loaded with something that might explain your ping spikes? Do you do anything funky on it? You are not running a plex server on it or something are you? Maybe enable irqblance anyway just to help spread load over the CPU cores.
opkg update
opkg install irqbalance
Enable by changing 0 to 1 in /etc/config/irqbalance:
config irqbalance 'irqbalance'
        option enabled '1'
This may not be the cause of your issue, but unless I am mistaken enabling irqbalance will only help under any high load.
It should help but it will not solve all. For example on mvebu (at least on the SoC used in the turris omnia) it seems ethernet IRQ processing needs to be done by CPU0, so irqbalance is not going to help with these...
If I had to speculate, I would guess that for single core routers it would be wasted space (so not included in the default set of packages) and even for multicore routers it is not strictly required... It would be convenient though if it came as default on multi-core routers that are not flash-poor. There probably is a really good reason for not including it though that I am just not recognizing.
I've updated the lua service implementation to use the simpler RTT tracking method proposed by @openwrticon, really like the FAME algorithm you highlighted.
The service will now consider ping readings below moving the median * 1.2 as eligible for bandwidth increases, and ping readings above the median * 2 will trigger the decrease logic. These numbers might need some tweaking.
See the lua extract below for implementation of the fast algorithm for mean estimation (FAME) and simplified updatePingStatistics function.
I've added an 'rtt' config parameter in which the user should specify their unloaded rtt - this defaults to 50 ms.
function movingMedian(persist, observation)
	if not persist.median or not persist.step then
		persist.median = observation
		persist.step = math.max(math.abs(observation / 2), 1)
	end
	if persist.median > observation then
		persist.median = persist.median - persist.step
	elseif persist.median < observation then
		persist.median = persist.median + persist.step
	end
	if math.abs(observation - persist.median) < persist.step then
		persist.step = persist.step / 2
	end
	return persist.median
end

function updatePingStatistics()
	if not ping.persist then
		ping.clear = 0
		ping.latent = 0
		ping.persist = {}
		if ping.current > rtt then
			movingMedian(ping.persist, rtt)
		end
	end

	ping.median = movingMedian(ping.persist, ping.current)
	ping.limit = ping.median * 2
	ping.target = ping.median * 1.2

	if ping.current > ping.limit then
		ping.clear = 0
		ping.latent = ping.latent + interval
		return
	end

	if ping.current > ping.target then
		return
	end

	ping.clear = ping.clear + interval
	ping.latent = 0
end