CAKE w/ Adaptive Bandwidth [October 2021 to September 2022]

A little update...

I have done a little more testing but I haven't had time to do a whole lot more. My goal is to isolate the Starlink specific test from the rest of autorate, in order to verify if reducing the CAKE bandwidth during the Starlink switches will reduce the latency spikes, since the latency spikes during the Starlink switches are predictable.

To do this, I altered the parameters in the autorate code to essentially keep CAKE at the maximum bandwidth (200/30 down/up) for all times except during the Starlink switch times, so it essentially wouldn't be doing any autorating except for the dropping to minimum during the Starlink switches.

Then I would ran a 5 minute flent test with that functionality followed by my control which is the exact same code EXCEPT I altered the Starlink times in the autorate code to subtract 7 seconds from each. So it is still lowering the CAKE bandwidth the same amount of time each minute, only it is doing it at the "wrong" times. If the Starlink specific code is useful, then there should be a clear difference in the results.

Unfortunately I didn't really see a clear difference.

So I'm working on validating to make sure it is actually switching at the correct time, as that could be one source of error. The autorate code is running on my OpenWrt router, but the other irtt and flent tests I've been running on my computer. Both are time synced with NTP but I haven't confirmed that the time on the router is synced right so that's what I'd like to do next.

I did run a test on my computer that I thought was interesting, in order to kind of double-check the Starlink switches. So this is with autorate turned off, so CAKE is just set to a fixed rate of 200/30, and I did a 20 minute flent test while simultaneously doing a 20 minute irtt like "irtt client --dscp=0xfe -i3ms -d20m" as @dtaht suggested (so irtt was done under load).

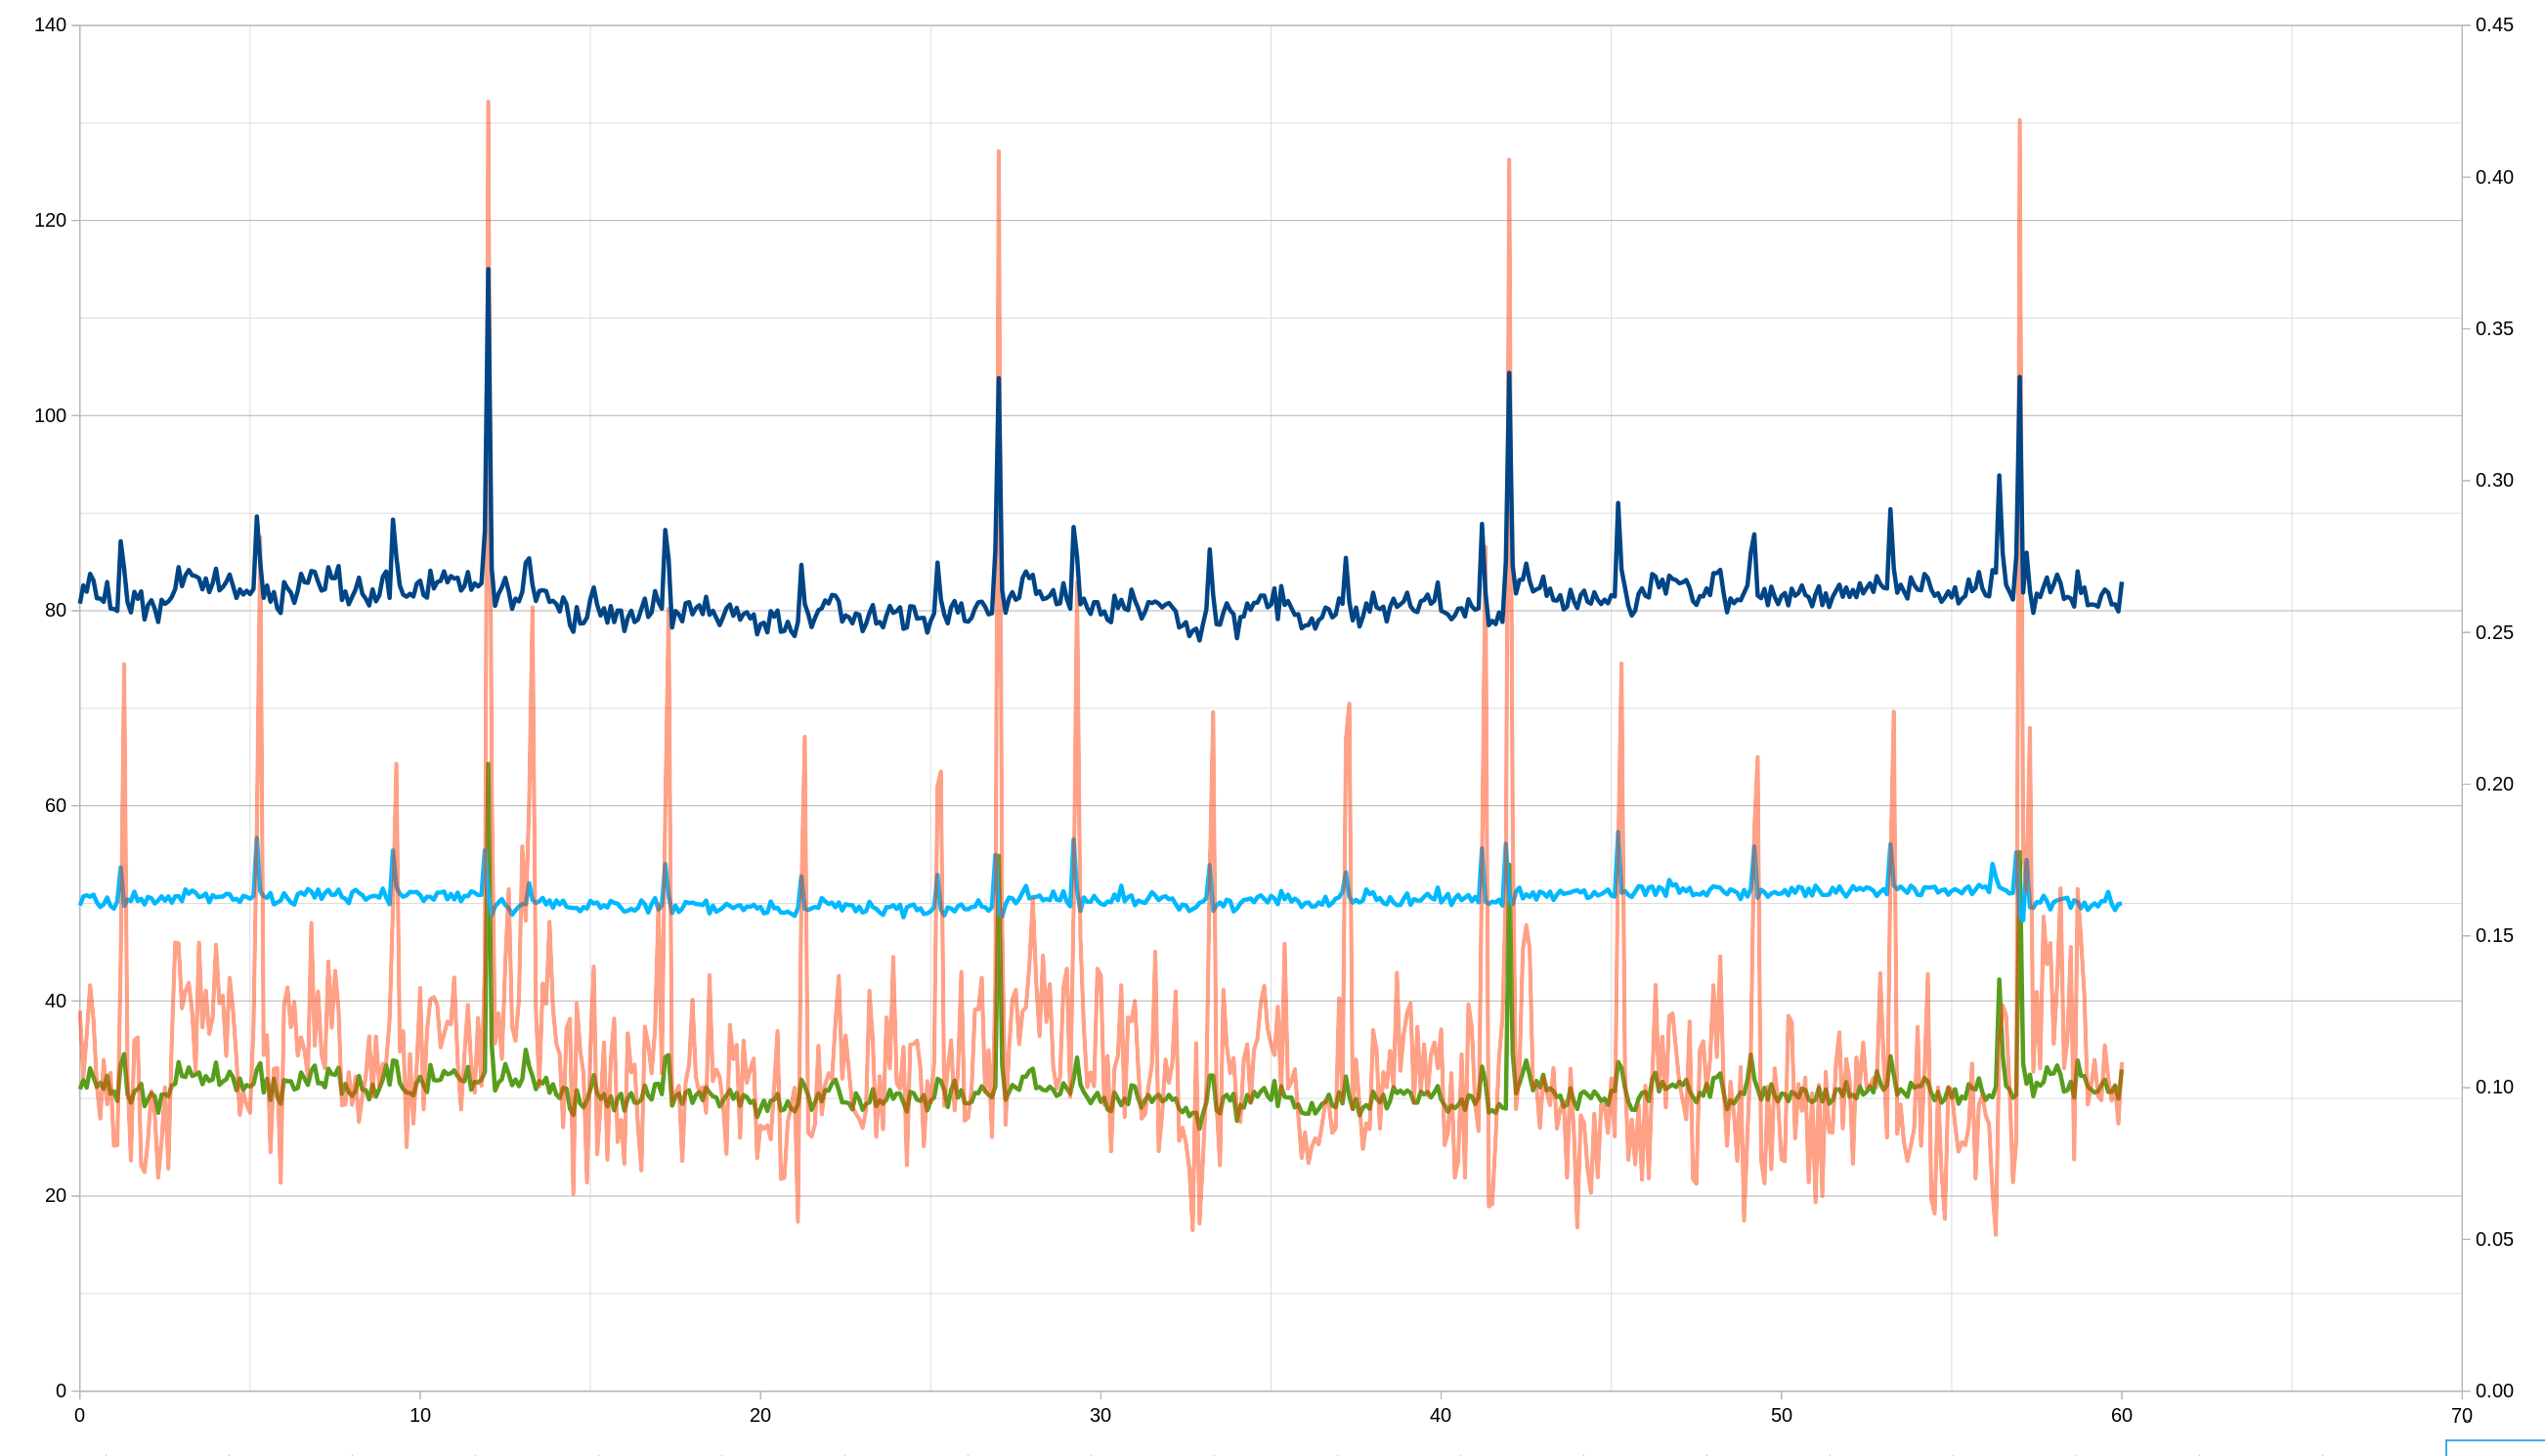
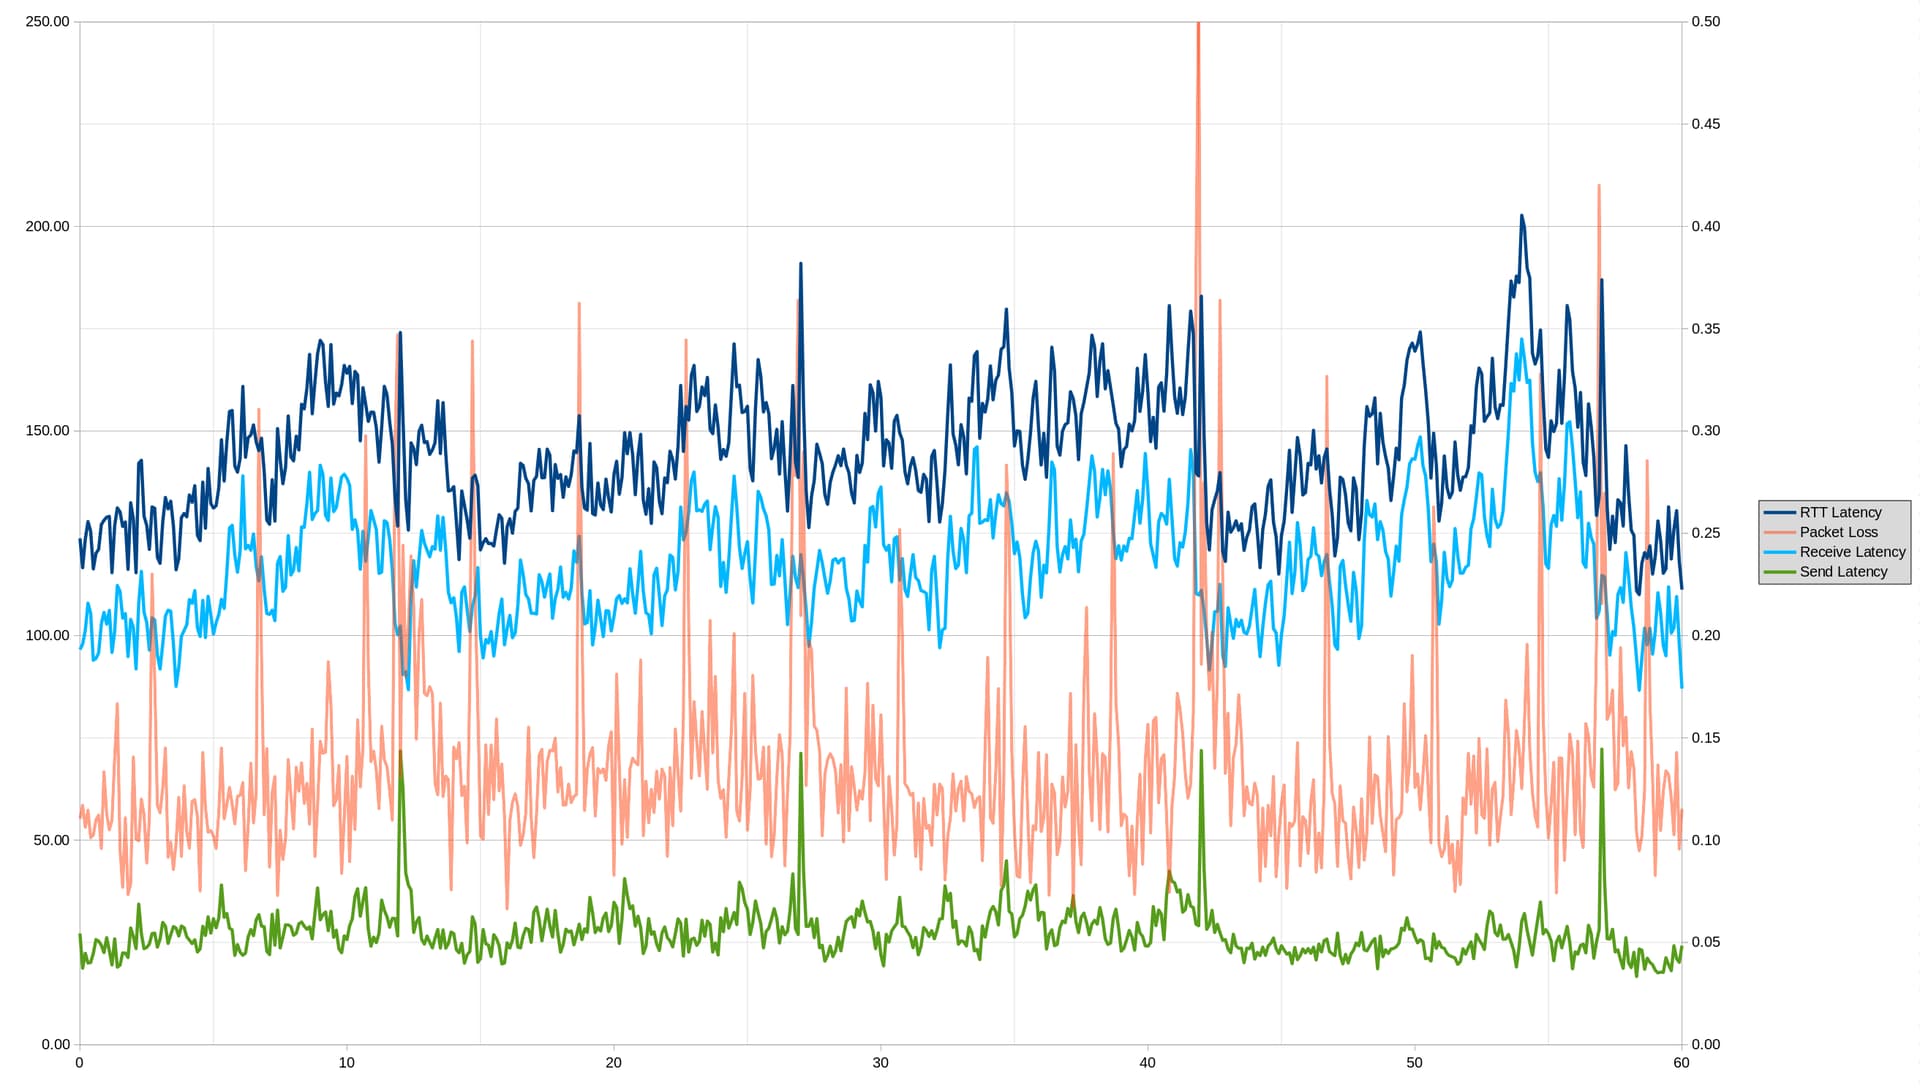
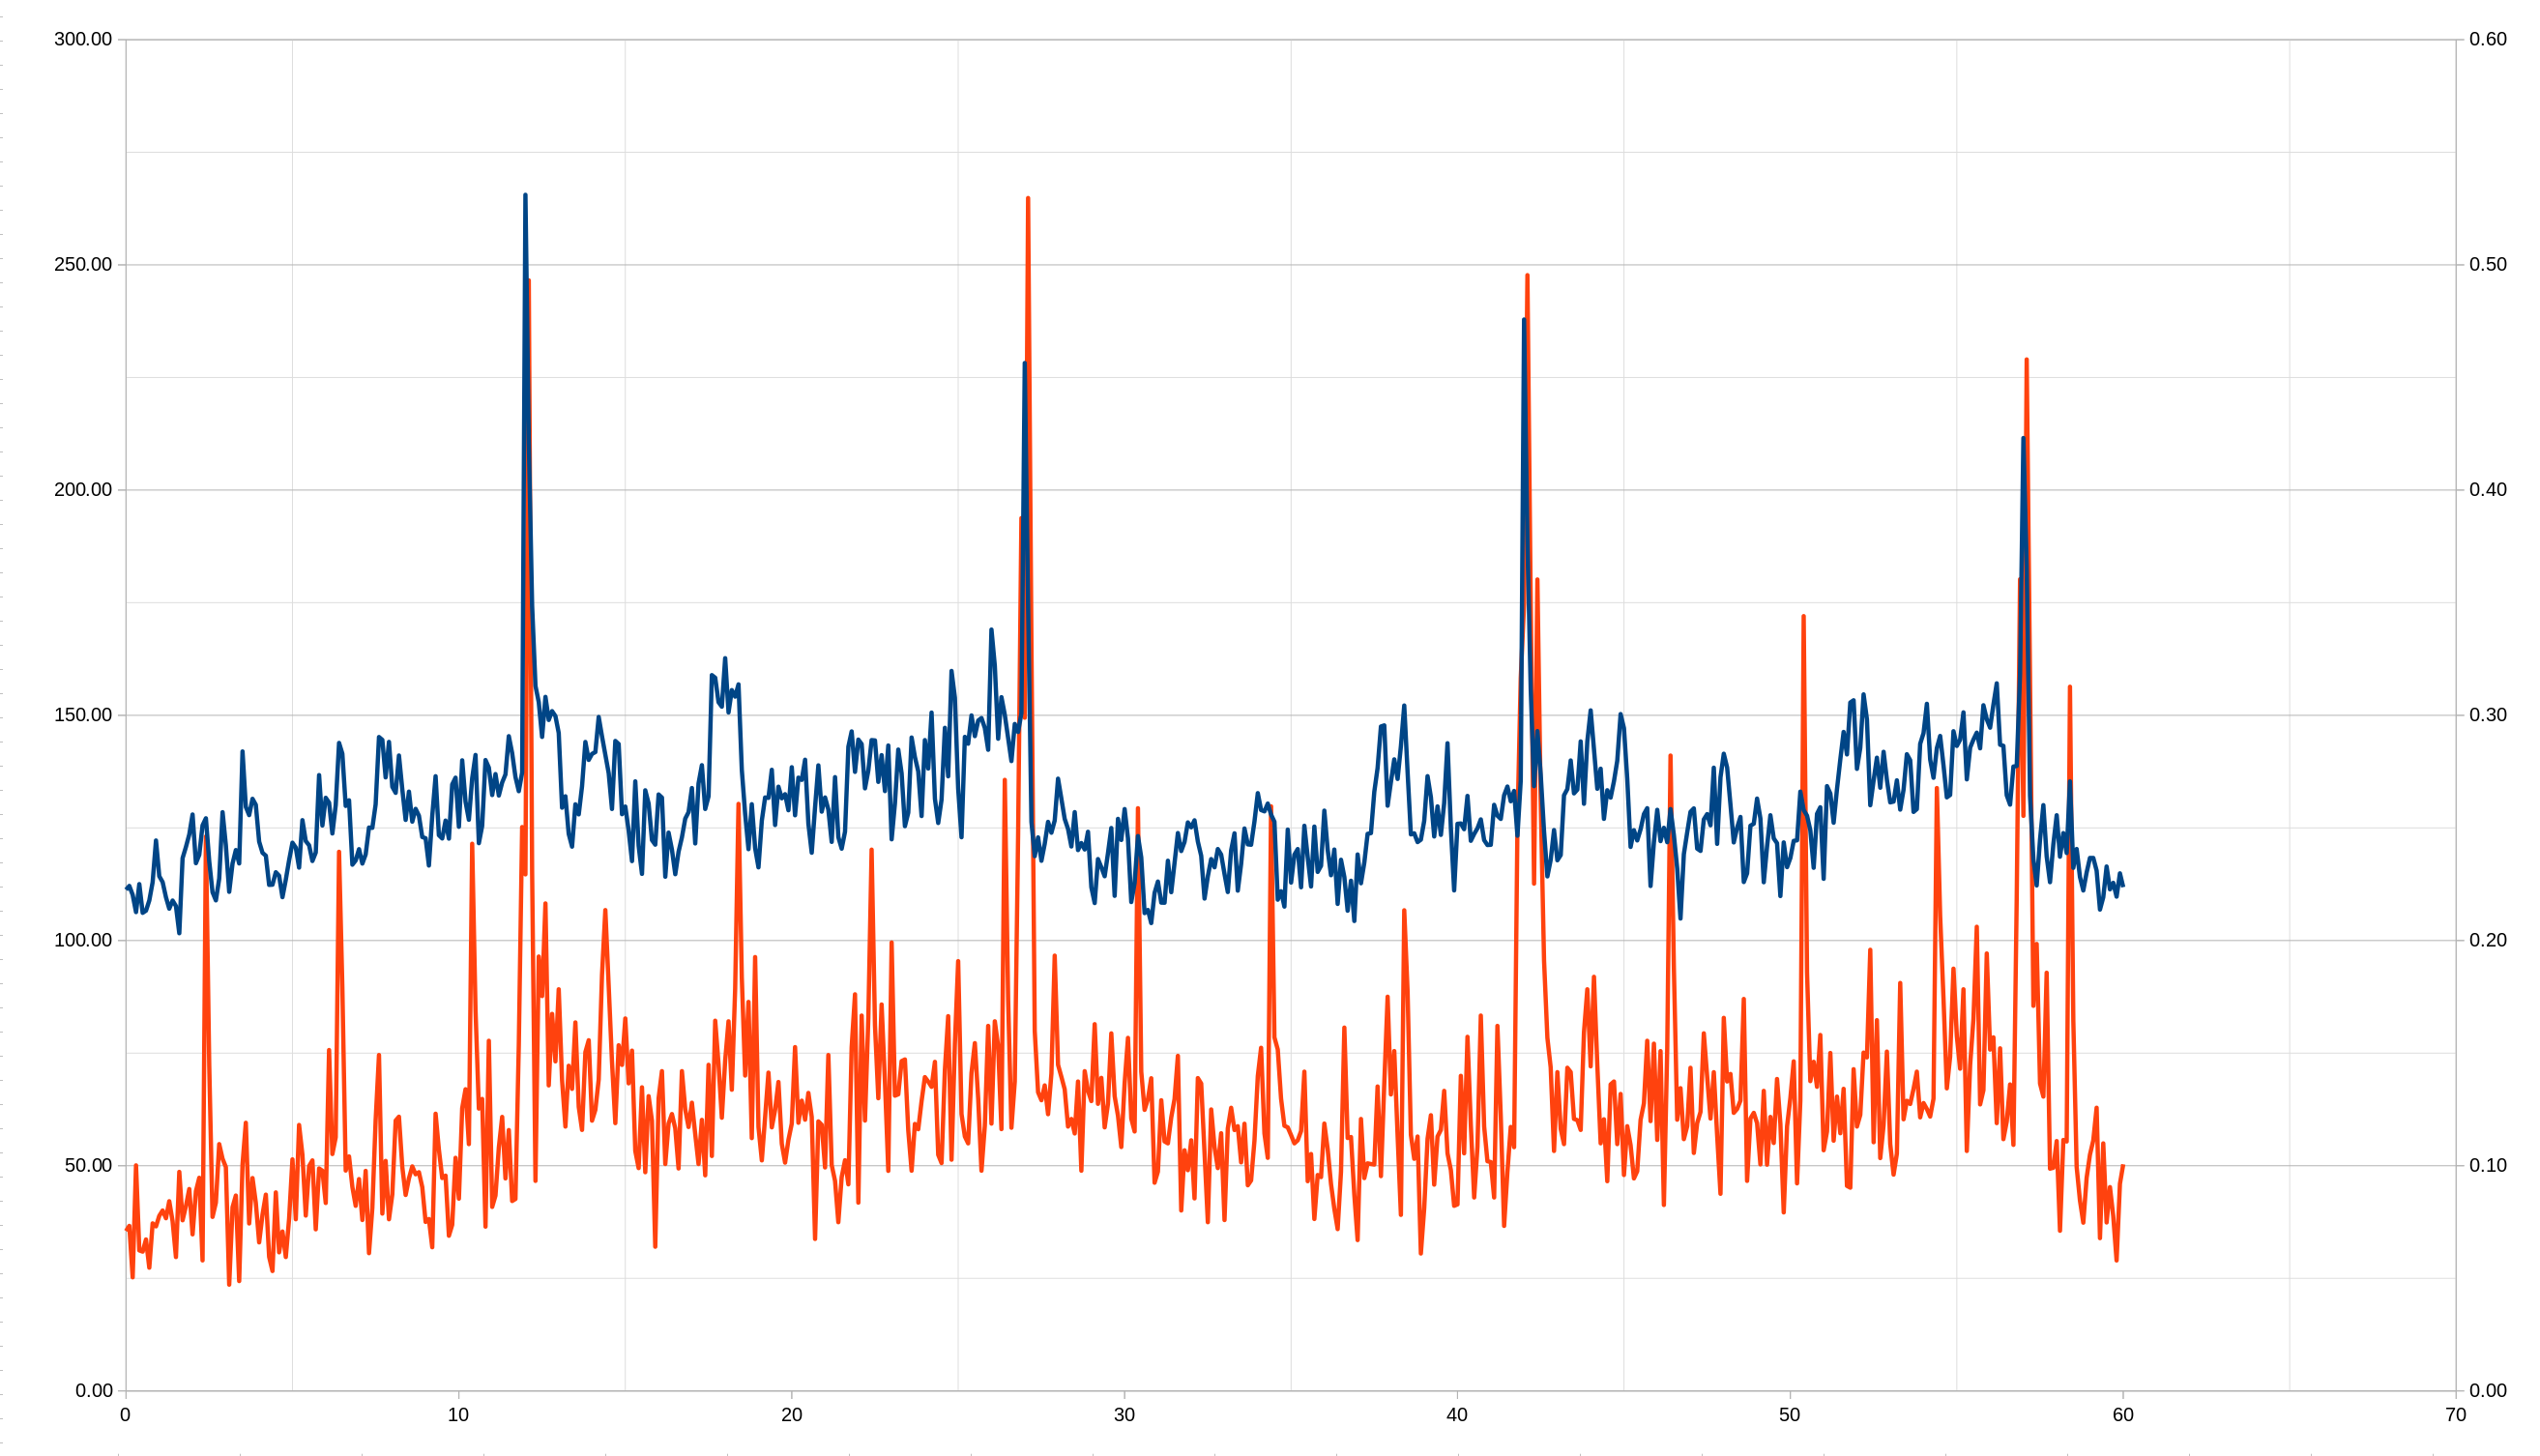
Then I took the rtt and lost packets and put them in bins based on what tenth of a second after a minute they were sent. Here is the result:

So the irtt mean RTT is 129.5 ms (send delay is 20.9 ms and receive delay 108.6 ms) and the packets lost were 13.02% (12.41% were lost up and 0.70% lost down)...side note, I'm wondering if anyone has a Starlink theory why the send delay was so much shorter than the receive delay but the packets lost sending is a lot higher than the packets lost receiving?

On the graph, the X axis is the number of seconds after the minute, the left Y axis is the RTT latency (blue), the right Y axis is the % packet loss (red). There is clearly a big spike in latency and packets lost around the time of the Starlink switches, although it is curious that there does look to be a spike in packets lost on a regular shorter interval as well.

Data around the switches:

Seconds Latency Packet Loss
11.6 141.60 0.08
11.7 136.31 0.09
11.8 133.16 0.15
11.9 137.28 0.25
12 265.56 0.23
12.1 211.20 0.49
12.2 174.33 0.23
12.3 156.53 0.09
12.4 152.92 0.19
12.5 145.20 0.18
26.7 148.08 0.14
26.8 146.29 0.25
26.9 150.48 0.39
27 228.21 0.30
27.1 174.67 0.53
27.2 126.35 0.33
27.3 118.72 0.16
27.4 122.90 0.13
41.7 133.21 0.11
41.8 123.27 0.25
41.9 135.52 0.32
42 237.87 0.35
42.1 188.84 0.50
42.2 155.85 0.35
42.3 134.27 0.23
42.4 146.50 0.36
42.5 136.88 0.26
42.6 124.22 0.19
56.6 130.16 0.14
56.7 138.63 0.11
56.8 138.74 0.22
56.9 159.06 0.36
57 211.56 0.26
57.1 183.13 0.46
57.2 132.16 0.32
57.3 118.03 0.17
57.4 112.22 0.20

So I still think it seems like it should be helpful to reduce the CAKE bandwidth around the switches, but if anyone knows CAKE a lot better than me and thinks differently then let me know!

1 Like

Starlink is definitely doing something on 4 second intervals as well, in addition to the 15 second intervals of the satellite optimization/switch. Here are all the tenths of seconds where the average packet loss is > 20% (I took out the ones during the satellite switches):

Seconds Latency Packet Loss
2.4 127.14 0.25
6.4 143.87 0.24
10.4 136.01 0.24
14.4 141.25 0.21
18.4 156.87 0.26
22.4 144.50 0.24
26.4 150.11 0.27
30.4 123.19 0.26
34.4 127.96 0.26
38.4 152.17 0.21
46.4 129.18 0.28
50.4 128.94 0.34
54.4 142.72 0.27
54.5 145.41 0.21
55.6 146.16 0.21
58.4 135.33 0.31

So starting at 2.4 seconds after the minute and every 4 seconds after that, there is almost a doubling in packet loss.

1 Like

@dlakelan, @moeller0 and @dtaht help! I'm out of my depth here, and we really need your expert thoughts and analysis in interpreting the above.

A baseline (lacking load) would be helpful.

You have less bandwidth on the send, so you lose more packets in order to have congestion control. If you were successfully controlling the send via cake (the easiest thing compared to the down), or on idle, then irtt should lose no packets except from the natural error rate of the link.

The OWD disparity is (so far as I know) based one each root clock differences. Could be wrong! @heistp is the irtt expert.

Trying to see the difference between the delays, and jitter (from for example,
a retransmit) was what I was shooting for (invert the sign on the up so the two don't overlap)

@dtaht and other experts, with such large RTT spikes around the satellite transitions wouldn't we expect holding the shaper rates down for 500ms, i.e. 300ms before the switch time and 200ms after the switch time to reduce overall latency under load for periods of saturation?

@gba seems to be indicating that cutting the shaper rates on and around the transition times like we have tried is not having a significant effect in terms of cutting overall latency. Which seems confusing.

Unless of course it's as simple as the router time not being correct but that seems unlikely.

Or alternatively is this too tight:

sss_compensation_pre_duration_ms=300
sss_compensation_post_duration_ms=200

Actually @gba doesn't this indicate our pre and post periods are too low? I mean if the spike is already occuring at 11.6 that's 400ms prior and then going in until 12.5 that's 500ms post.

So @moeller0 does this mean we should rather use something like:

sss_compensation_pre_duration_ms=800
sss_compensation_post_duration_ms=700

Good question.

@gba, could you maybe zoom in on one of your spikes so we can get a feeling for how long before and after the "time" the delay is increased (say zoom in on 1second before and one second after)? Since we need to give the shaper some time to effectively throttle the flows down the 300/200 scheme we started with might be indeed to optimistic or the approach might not work as intended...

The other issue are the 4 second spikes in between with delay spikes in the 125 to 155 ms range these will cause challenges with interactive use cases.

1 Like

I presume lowering shaper rates every 4s would be crazy?

For testing? probably not crazy just add the expected times to the current list. But in the remaining < 4 second intervals there is little chance of ramping from min to max rate...

OK, a baseline irtt test with no load:

                         Min     Mean   Median      Max   Stddev
                         ---     ----   ------      ---   ------
                RTT  51.31ms  81.42ms   79.7ms  244.9ms  13.07ms
         send delay   11.6ms  30.85ms  29.02ms  189.6ms  10.87ms
      receive delay  35.73ms  50.57ms  49.74ms  125.7ms   6.55ms
                                                                
      IPDV (jitter)   1.75µs   4.21ms   2.98ms  128.8ms   3.97ms
          send IPDV   6.31µs   3.82ms   2.98ms  136.5ms   3.19ms
       receive IPDV       0s   1.15ms   28.4µs  83.38ms    2.8ms
                                                                
     send call time   5.29µs   59.9µs            5.11ms     24µs
        timer error       0s     36µs           30.24ms    134µs
  server proc. time    620ns   3.29µs            1.61ms    4.7µs

                duration: 20m1s (wait 734.8ms)
   packets sent/received: 398659/353856 (11.24% loss)
 server packets received: 354369/398659 (11.11%/0.14% loss up/down)
late (out-of-order) pkts: 1 (0.00%)
     bytes sent/received: 23919540/21231360
       send/receive rate: 159.5 Kbps / 141.5 Kbps
           packet length: 60 bytes
             timer stats: 1341/400000 (0.34%) missed, 1.20% error

I added the light blue line for irtt receive latency and the green line for irtt send latency, is that what you were after @dtaht?

So there's still the big spikes during those transition times, but when it is broken down to receive/send it is interesting:

Seconds Latency Packet Loss Receive Latency Send Latency
11.4 83.97 0.13 50.73 33.24
11.5 82.15 0.11 51.24 30.91
11.6 82.81 0.10 51.10 31.71
11.7 82.49 0.12 50.85 31.64
11.8 82.81 0.10 50.88 31.93
11.9 88.20 0.14 55.46 32.74
12 115.02 0.42 50.72 64.30
12.1 84.33 0.20 48.81 35.53
12.2 80.51 0.11 49.69 30.82
12.3 81.72 0.12 50.09 31.63
12.4 82.41 0.11 50.44 31.97
12.5 83.37 0.14 49.84 33.54
26.4 80.86 0.13 50.33 30.54
26.5 80.94 0.14 49.68 31.25
26.6 80.41 0.10 49.61 30.80
26.7 79.62 0.11 49.25 30.38
26.8 79.74 0.08 49.61 30.13
26.9 86.21 0.13 54.97 31.24
27 103.84 0.41 48.96 54.88
27.1 82.10 0.15 48.66 33.44
27.2 79.79 0.09 49.92 29.87
27.3 81.25 0.11 50.60 30.66
27.4 81.90 0.13 50.51 31.39
27.5 81.12 0.13 50.02 31.11
41.4 78.52 0.06 49.95 28.57
41.5 78.97 0.06 50.17 28.80
41.6 78.63 0.08 50.10 28.53
41.7 79.82 0.11 50.38 29.44
41.8 78.85 0.12 49.79 29.06
41.9 85.07 0.16 56.11 28.96
42 104.38 0.41 50.42 53.96
42.1 84.64 0.19 49.93 34.70
42.2 81.77 0.09 51.23 30.54
42.3 83.15 0.11 51.61 31.54
42.4 83.20 0.15 50.52 32.68
42.5 84.83 0.15 50.94 33.89
56.4 93.87 0.11 51.68 42.20
56.5 85.86 0.13 51.48 34.39
56.6 82.64 0.12 51.33 31.31
56.7 81.93 0.10 51.01 30.92
56.8 81.15 0.07 51.07 30.07
56.9 85.60 0.08 55.23 30.37
57 103.96 0.42 48.71 55.26
57.1 81.87 0.18 48.27 33.60
57.2 85.95 0.16 54.44 31.51
57.3 82.04 0.22 49.60 32.44
57.4 79.78 0.11 49.55 30.23
57.5 81.75 0.13 50.13 31.62

Receive latency has just a tiny spike right before the switch, in the tenth of a second before, but it is only about 5 ms (10%). And then right when the switch happens the send latency just about doubles, so that explains almost all the increase in latency.

Actually I don't think the spike is happening at 11.6, I went before and after the spike in that data table so you could see what was happening before and after. If I go further back if it just more similar data. This is fully loaded download/upload and that is pretty close to the mean latency irtt is measuring. Here are the full statistics:

                          Min     Mean   Median      Max   Stddev
                          ---     ----   ------      ---   ------
                RTT      49ms  129.5ms  114.7ms  454.9ms  51.61ms
         send delay  -22.41ms  20.87ms  13.03ms  333.4ms  30.41ms
      receive delay   61.17ms  108.6ms  93.16ms  396.1ms  41.22ms
                                                                 
      IPDV (jitter)      30ns   3.85ms   2.94ms  217.8ms   4.68ms
          send IPDV      73ns   3.79ms   2.97ms  141.4ms   3.74ms
       receive IPDV       1ns   2.49ms    285µs    205ms   5.04ms
                                                                 
     send call time    4.03µs   33.3µs           10.25ms   28.2µs
        timer error        0s     34µs           20.41ms    110µs
  server proc. time     620ns   2.91µs            2.73ms   12.3µs

                duration: 20m1s (wait 1.36s)
   packets sent/received: 397108/345396 (13.02% loss)
 server packets received: 347823/397108 (12.41%/0.70% loss up/down)
late (out-of-order) pkts: 6 (0.00%)
     bytes sent/received: 23826480/20723760
       send/receive rate: 158.8 Kbps / 138.2 Kbps
           packet length: 60 bytes
             timer stats: 2892/400000 (0.72%) missed, 1.13% error

So the mean RTT latency is 129.5ms, it looks to me like if we did 300 ms before and after that would cover both the spike in latency as well as packet loss.

From your response I'm not sure if you realize that this graph was made with just a fixed CAKE rate, not using the autorate code? Maybe you realize that, I just wanted to make sure you did. Now that I've done the measurement of the base no-load case, I'm going to do another one with load AND the autorate Starlink code to visualize what is happening in the same way.

1 Like

I realised that but didn't appreciate what I thought was high RTT from 11.6 etc was reflective of the mean RTT. So your point is that the spikes are actually very localized.

Looking forward.

@moeller0 would you necessarily expect reduced shaper rate around spike to reduce latency? Does reduction mean that there is a bufferbloat issue and conversely non reduction mean the latency spike is unrelated to bufferbloat and shaping has no beneficial effect?

I'd really hoped shaper rate reduction at these satellite switch times would significantly bring down latency under load.

Well, I've lost a week to COVID, and I'm not quite over it, but I see you all have tried some interesting things! A couple of questions from me:
@gba would you care to share the code you use to test and produce the irrt graphs? I'm not sure my brain is quite ready to recreate that yet...
@Lynx Since GBA's data seems to indicate that most of the loss and RTT increase at switch over is sending/upload, would it make sense to only change the upload rate during the _sss events and leave download as is? I'll test this myself, but it may not be for a day or two.

Also, since I have LTE options, I could arrange to send my upload over LTE and my download over starlink, or vice-versa. I can also limit my download from the wireguard endpoint's upload perspective, if we can think of any useful tests those options would give us. I'm thinking that isolating the up or download may help identify the impact of the _sss events, at least.

OK, results from the latest tests.

First I ran with the Starlink autorate code with parameters altered so it just does 200/30 down/up during all times except the Starlink switches. During those switches it drops to 20/2 speed.

Like before, this is running flent and irtt simultaneously for 20 minutes, and then binning the results into tenths of seconds after the minute and finding the average for each tenth in the latency graph below.

sss_times_s=("12.0" "27.0" "42.0" "57.0")

sss_compensation_pre_duration_ms=300
sss_compensation_post_duration_ms=300

                         Min     Mean   Median      Max   Stddev
                         ---     ----   ------      ---   ------
                RTT  54.59ms  144.5ms    130ms  429.5ms  54.66ms
         send delay  -7.02ms  27.39ms   20.9ms  317.4ms  25.85ms
      receive delay  56.75ms  117.2ms  99.58ms  320.9ms  49.18ms
                                                                
      IPDV (jitter)     64ns   4.06ms   2.95ms  157.2ms    4.8ms
          send IPDV     75ns   3.92ms   2.98ms  134.5ms   3.98ms
       receive IPDV       0s   2.66ms    183µs  144.5ms   5.17ms
                                                                
     send call time   5.12µs   36.6µs            6.95ms   29.6µs
        timer error       0s   36.8µs           25.93ms    118µs
  server proc. time    609ns   2.14µs            4.07ms   8.26µs

                duration: 20m1s (wait 1.29s)
   packets sent/received: 397007/343121 (13.57% loss)
 server packets received: 347187/397007 (12.55%/1.17% loss up/down)
late (out-of-order) pkts: 4 (0.00%)
     bytes sent/received: 23820420/20587260
       send/receive rate: 158.8 Kbps / 137.3 Kbps
           packet length: 60 bytes
             timer stats: 2993/400000 (0.75%) missed, 1.23% error

Data around the times of the Starlink switches:

Seconds Latency Packet Loss Receive Latency Send Latency
11.4 160.92 0.14 128.07 32.85
11.5 158.86 0.14 127.63 31.23
11.6 152.26 0.12 123.55 28.71
11.7 146.72 0.11 115.84 30.88
11.8 133.79 0.29 102.95 30.84
11.9 126.77 0.35 100.20 26.57
12.0 174.08 0.13 102.32 71.76
12.1 152.75 0.24 90.47 62.27
12.2 133.15 0.18 91.16 41.99
12.3 125.78 0.20 86.77 39.01
12.4 147.11 0.24 109.32 37.80
12.5 145.72 0.21 118.30 27.42
26.4 140.79 0.09 113.91 26.88
26.5 130.43 0.12 102.66 27.76
26.6 143.73 0.15 110.65 33.08
26.7 161.13 0.31 119.39 41.73
26.8 142.41 0.28 114.07 28.34
26.9 138.65 0.36 111.72 26.93
27.0 190.97 0.21 119.76 71.21
27.1 156.17 0.29 113.69 42.49
27.2 135.33 0.13 106.40 28.93
27.3 126.39 0.20 97.43 28.96
27.4 134.08 0.19 103.31 30.77
27.5 137.89 0.16 111.71 26.17
41.5 169.23 0.12 132.55 36.67
41.6 179.30 0.13 145.44 33.87
41.7 173.79 0.16 140.26 33.53
41.8 139.74 0.38 110.30 29.44
41.9 139.00 0.52 109.91 29.09
42.0 182.95 0.19 111.05 71.90
42.1 149.14 0.27 106.00 43.14
42.2 127.50 0.20 99.30 28.20
42.3 120.93 0.17 91.62 29.31
42.4 130.77 0.20 97.92 32.84
56.4 139.12 0.16 116.68 22.44
56.5 156.63 0.15 127.46 29.17
56.6 151.06 0.13 123.95 27.11
56.7 143.51 0.13 122.35 21.16
56.8 129.37 0.20 104.23 25.15
56.9 134.22 0.42 106.00 28.22
57.0 186.97 0.22 114.72 72.25
57.1 154.40 0.27 114.33 40.07
57.2 131.20 0.16 105.30 25.90
57.3 121.06 0.16 95.23 25.83
57.4 129.18 0.17 100.97 28.21
57.5 122.73 0.12 100.05 22.68

Flent gave result of 142 ms mean ping (207 ms 95%, 261 ms 99%), 30.0 Mbps download, 2.3 Mbps upload.


Then I ran another test in the same way while changing the autorate config to:

sss_times_s=("5.0" "20.0" "35.0" "50.0")

So these times are incorrect for Starlink switching (7 second before when the actual switch occurs). This test will be my control.


                          Min     Mean   Median      Max   Stddev
                          ---     ----   ------      ---   ------
                RTT   54.37ms  133.1ms  115.2ms  667.9ms  55.69ms
         send delay  -40.08ms  23.19ms   21.7ms  420.9ms   37.9ms
      receive delay   43.85ms  109.9ms  96.24ms  375.2ms  50.34ms
                                                                 
      IPDV (jitter)     190ns   4.02ms   2.95ms  174.7ms   4.42ms
          send IPDV     168ns   3.87ms   2.98ms  188.3ms   3.94ms
       receive IPDV       1ns   2.55ms    268µs  173.3ms   4.77ms
                                                                 
     send call time    5.35µs   33.2µs            6.44ms   24.2µs
        timer error        0s   35.5µs           18.55ms    112µs
  server proc. time     610ns   2.84µs             674µs   7.02µs

                duration: 20m2s (wait 2s)
   packets sent/received: 397283/343738 (13.48% loss)
 server packets received: 347223/397283 (12.60%/1.00% loss up/down)
late (out-of-order) pkts: 3 (0.00%)
     bytes sent/received: 23836980/20624280
       send/receive rate: 158.9 Kbps / 137.5 Kbps
           packet length: 60 bytes
             timer stats: 2715/399998 (0.68%) missed, 1.18% error

Flent gave results of 133 ms mean ping (240 ms 95%, 285 ms 99%), 21.9 Mbps download, 3.0 Mbps upload.


So it seems clear to me that the Starlink autorate code is doing something. Perhaps not a dramatic improvement, but the peaks at 12, 27, 42, and 57 seconds are clearly reduced on the first graph compared to the second.

I find something interesting. On the first test, even though the overall latency doesn't spike much during the Starlink switch time, it does still spike for the send latency, but that is partially cancelled out by a reduction in the receive latency as the speed drops. Not sure if that means we should change something.

Does anyone want more data or should I test some other configurations before trying to enable the rest of the autorate code?

Thanks.

For sure! That would be great if you could do some tests with your Starlink. And I agree that isolating upload/download may be useful.

Flent test command line:

flent -t $T --step-size=.05 --socket-stats -f stats -l 1260 -H flentserver rrul

irtt command line:

irtt client --dscp=0xfe -i3ms -d20m irttserver -o atlanta.json > atlanta.log

To process the irtt data I just hacked up @virtuallynathan's script that he had posted. It does graph the data points, and I started with that, but because Starlink has this periodic data pattern I found it more interesting to put the data points by bins of tenths of seconds past the minute.

So it's just printing the data to the console and I'm just pasting that into a spreadsheet to graph. I guess I could have just as easily graphed that right with pyplot, not sure why I didn't:

import pandas as pd
import numpy as np
import matplotlib.pyplot as plt
import matplotlib.dates as mdates
import math
import json
import zipfile


f = open('atlanta.json')
data = json.load(f)

round_trips = data['round_trips']
rtts = []
receive_latency = []
send_latency = []
ts = []
index = []
lost_packet = []
count = 0
for round_trip in round_trips:
    ts.append(round_trip['timestamps']['client']['send']['wall'])
    if round_trip['lost'] == 'false':
        rtts.append(round_trip['delay']['rtt']/1000000)
        receive_latency.append(round_trip['delay']['receive']/1000000)
        send_latency.append(round_trip['delay']['send']/1000000)
        lost_packet.append(0)
    else:
        #rtts.append(-1)
        rtts.append(np.nan)
        receive_latency.append(np.nan)
        send_latency.append(np.nan)
        lost_packet.append(1)
    index.append(count)
    count = count + 1

df = pd.DataFrame()
df['rtts'] = rtts
df['receive_latency'] = receive_latency
df['send_latency'] = send_latency
df['ts'] = ts
df['lost_packet'] = lost_packet
df['rolling_min'] = df['rtts'].rolling(100, 10).min().shift(-100)
df['rolling_max'] = df['rtts'].rolling(100, 10).max().shift(-100)
df['rolling_mean'] = df['rtts'].rolling(100, 10).mean().shift(-100)
df['date'] = df['ts'].astype('datetime64[ns]')
#df['usecs_past_minute'] = df['ts'] % 60000000
#df['secs_past_minute'] = df['usecs_past_minute'] / 1000000
df['usecs_past_minute'] = df['date'].dt.microsecond
df['secs_past_minute'] = df['date'].dt.second
df['tenths_past_minute'] = df['secs_past_minute'] + round(df['usecs_past_minute'] / 1000000, 1)

print(df)

#timeData = df.groupby('secs_past_minute')['rtts'].sum()
timeData = df.groupby('tenths_past_minute')['rtts', 'lost_packet', 'receive_latency', 'send_latency'].mean()
with pd.option_context('display.max_rows', None,):
    print(timeData)

plt.figure()
plt.scatter(df['date'], df['rtts'], color='red')
#plt.scatter(df['date'], df['rolling_min'], color='red')
#plt.scatter(df['date'], df['rolling_max'], color='blue')
plt.scatter(df['date'], df['rolling_mean'], color='green')
plt.scatter(df['date'], df['tenths_past_minute'], color='blue')
plt.title('gba Atlanta Starlink RTT')
plt.xlabel('Time')
plt.ylabel('RTT (ms)')
#plt.xticks(rotation=45)
plt.grid()
ax = plt.gca()
ax.xaxis.set_major_locator(mdates.SecondLocator(interval=1))
#plt.savefig('gba_atlanta_starlink_irtt.svg')
plt.show()

Awesome, thanks! I'll work on getting that going on my gear soon.

1 Like

The weird thing is that the more recent irtt tests I did (a few hours later in the day) still have these packet losses at 4 second intervals, but they have shifted 0.4 seconds later!?!? So still predictable 4 second intervals but not quite as easy to manage if they are shifting.

It makes me really curious what Starlink is doing internally.

On no-load - what does the loss pattern look like? Is it completely correlated to the latency spikes? One piece of info we might be able to pull out is the depth of the "handover buffer" (to coin a phrase), and whether or not it is byte or packet based,
by running an irtt test with a larger packet size.

I am, btw, allergic somewhat to binning and would prefer a .svg or .pdf or .png with the scale exactly one pixel to each data point, or on a 1ms scale. (if you can throw up this reference data somewhere I can go at it), I also specified originally a 20 minute test figuring that would clearly show two things - a progression due to distance (either up or down - sat approaching or departing), and the effects of a major handover, which... well... from what I see it looks like you can go back to 3 minutes or less .