@MangoMan you have disabled output logging when running as service right? Else the log file will grow very quickly and eat up router ram.
1 Like
this is my config at this very moment:
anything more I missed eventually?
That's fine.
So it would be good if you could try entering bogus ping addresses to see if that triggers the issue quickly.
Also you could try reducing the sleep threshold from 60s to 2s to let is sleep rapidly and see if that triggers the issue.
The reason for the tests above is that ping processes are killed and restarted on bad reflector health, and similarly all ping processes are killed and restarted following sleep events. So if there's anything wrong with the way processes are being maintained during those times then triggering those events would help reveal the underlying issue.
There are normally several background processes by the way including one ping process per reflector, one bash monitoring process for each of those, and at least one more bash process that monitors the combined flows from the monitoring processes. Then I think there's at least one more to monitor overall reflector health. And one to monitor load. Yes so four ping processes and seven bash processes in total for four reflectors. More bash processes than this and something's not right.
So your seven bash processes following reboot is totally normal. But if the process number grows beyond this for any reason something is broken.
Please let us know what you find.
reflectors=("1.2.3.4" "1.2.3.5" "1.2.3.6" 1.2.3.7" "1.2.3.8" "1.2.3.9")
sustained_idle_sleep_thr_s=2
Still seven from the last restart... now restarting the service to get the bogus settings sharp ![]()
I do ![]()
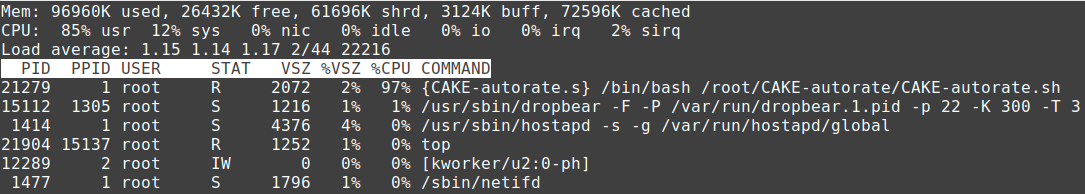
...by the looks of it there is now only one ![]() process left which is hogging heavy on the CPU (~80-97%)
process left which is hogging heavy on the CPU (~80-97%) ![]()
1 Like
Since 25 minutes still one process only still hogging cpu hard
So cake itself shouldn't use very much. The bash script on my RT3200 with stock settings uses about 5% cpu. But if you use schedutil that percentage goes up as the clock speed is reduced.
80-97% is far too high.
What's the exact process?
No idea really - I use openwrt's default. The machine is a WDR3600 (N600) if that helps ![]()
Mem: 97736K used, 25656K free, 61696K shrd, 3124K buff, 72596K cached
CPU:  83% usr  14% sys   0% nic   0% idle   0% io   0% irq   1% sirq
Load average: 1.27 1.16 1.18 3/45 22198
  PID  PPID USER     STAT   VSZ %VSZ %CPU COMMAND
21279     1 root     R     2072   2%  87% {CAKE-autorate.s} /bin/bash /root/CAKE-autorate/CAKE-autorate.sh
Or as a screenshot:
Flip that's bad. Maybe enable output lines and debug re-run and see what it's outputting?
But normally - at least when restarted and with the 7 processes it wasn't hard on the cpu at all - I think like 4% each or less...
I do - please standby ![]()
Erm... question - all three debug options?
1 Like
Just debug and output processing lines. No need to output cake changes.
/root/CAKE-autorate/config.sh: line 146: unexpected EOF while looking for matching `"'
/root/CAKE-autorate/config.sh: line 148: syntax error: unexpected end of file
./CAKE-autorate.sh: line 481: ((: > 0: syntax error: operand expected (error token is "> 0")
./CAKE-autorate.sh: line 487: ((: >  : syntax error: operand expected (error token is ">  ")
./CAKE-autorate.sh: line 490: ((: >0: syntax error: operand expected (error token is ">0")
DEBUG Warning:  does not exist. Waiting  seconds for interface to come up.
DEBUG Warning:  does not exist. Waiting  seconds for interface to come up.
./CAKE-autorate.sh: line 433: read: -t: option requires an argument
read: usage: read [-ers] [-a array] [-d delim] [-i text] [-n nchars] [-N nchars] [-p prompt] [-t timeout] [-u fd] [name ...]
DEBUG Warning:  does not exist. Waiting  seconds for interface to come up.
DEBUG Warning:  does not exist. Waiting  seconds for interface to come up.
The last lines are then repeated forever
Looks like faulty config can you post pastebin?
It's in this bin here ![]()
![]()
...and I found the missing " already ![]()
1 Like
reflectors=("1.2.3.4" "1.2.3.5" "1.2.3.6" 1.2.3.7" "1.2.3.8" "1.2.3.9") # ("1.1.1.1" "1.0.0.1" "8.8.8.8" "8.8.4.4" "9.9.9.9" "9.9.9.10")
1 Like
Now it doesn't go hard on the CPU anymore - what is needed is only a correct config file ![]()
I spotted two processes now
Ultimately all of this should become setup to use the OpenWrt UCI system. But I'm not familiar with how that works.
Are the output lines correct looking? I guess it will just keep rotating reflectors. Oh and go to sleep after a while. You can wake it up by just running a speed test or something.
Hopefully though we don't see increasing rogue processes.
1 Like
Not much happening:
DEBUG rx_bytes_path: /sys/class/net/ifb4eth0.2/statistics/tx_bytes
DEBUG tx_bytes_path: /sys/class/net/eth0.2/statistics/tx_bytes
DEBUG Connection idle. Enforcing minimum shaper rates.
Will force some downstream ![]()
1 Like
So beside I gotta an A

(I would expect ![]() not to do it's magic correctly with the bogus ping goals?)
not to do it's magic correctly with the bogus ping goals?)
not much was happening in the logs:
DEBUG Connection idle. Enforcing minimum shaper rates.
DEBUG Connection idle. Enforcing minimum shaper rates.
DEBUG Connection idle. Enforcing minimum shaper rates.
mkfifo: /tmp/CAKE-autorate/pinger_0_fifo: File exists
DEBUG Connection idle. Enforcing minimum shaper rates.
DEBUG Connection idle. Enforcing minimum shaper rates.
DEBUG Connection idle. Enforcing minimum shaper rates.
DEBUG Connection idle. Enforcing minimum shaper rates.
DEBUG Connection idle. Enforcing minimum shaper rates.
DEBUG Connection idle. Enforcing minimum shaper rates.
DEBUG concurrent_read_positive_integer() misfire with the following particulars:
DEBUG caller=143 ./CAKE-autorate.sh; value=; and path=/tmp/CAKE-autorate/ul_achieved_rate_kbps
I'm running the script "manual" so I see the logs (should be no difference like when it is called from the service?) and a maximum of 4 processes I could observe in top (now it's only two left)
and the log (after the speed test) continues like this:
DEBUG concurrent_read_positive_integer() misfire with the following particulars:
DEBUG caller=143 ./CAKE-autorate.sh; value=; and path=/tmp/CAKE-autorate/ul_achieved_rate_kbps
DEBUG concurrent_read_positive_integer() misfire with the following particulars:
DEBUG caller=143 ./CAKE-autorate.sh; value=; and path=/tmp/CAKE-autorate/ul_achieved_rate_kbps
DEBUG concurrent_read_positive_integer() misfire with the following particulars:
DEBUG caller=142 ./CAKE-autorate.sh; value=; and path=/tmp/CAKE-autorate/dl_achieved_rate_kbps
DEBUG concurrent_read_positive_integer() misfire with the following particulars:
DEBUG caller=143 ./CAKE-autorate.sh; value=; and path=/tmp/CAKE-autorate/ul_achieved_rate_kbps
DEBUG concurrent_read_positive_integer() misfire with the following particulars:
DEBUG caller=142 ./CAKE-autorate.sh; value=; and path=/tmp/CAKE-autorate/dl_achieved_rate_kbps
Script sets minimum rates since it's running blind. And cake does usual thing at those rates.
All seems OK so far to me.
1 Like
So should I leave the bogus ping goals and the sleep with 2 seconds in the config (debug I turn off again?) and just leave it running?
Or better go back to my old config and observe it the next days and look for spontaneous process multiplication?