No worries. I am still confused by what is going on so hoping @moeller0 can shed some light.
OK, I fixed that parameter and ran another test, this time doing it for 120s, if that would be more helpful to you.

Average download speed was about 33 Mbps, average upload 9.4 Mbps this time.
1 Like
Big picture:
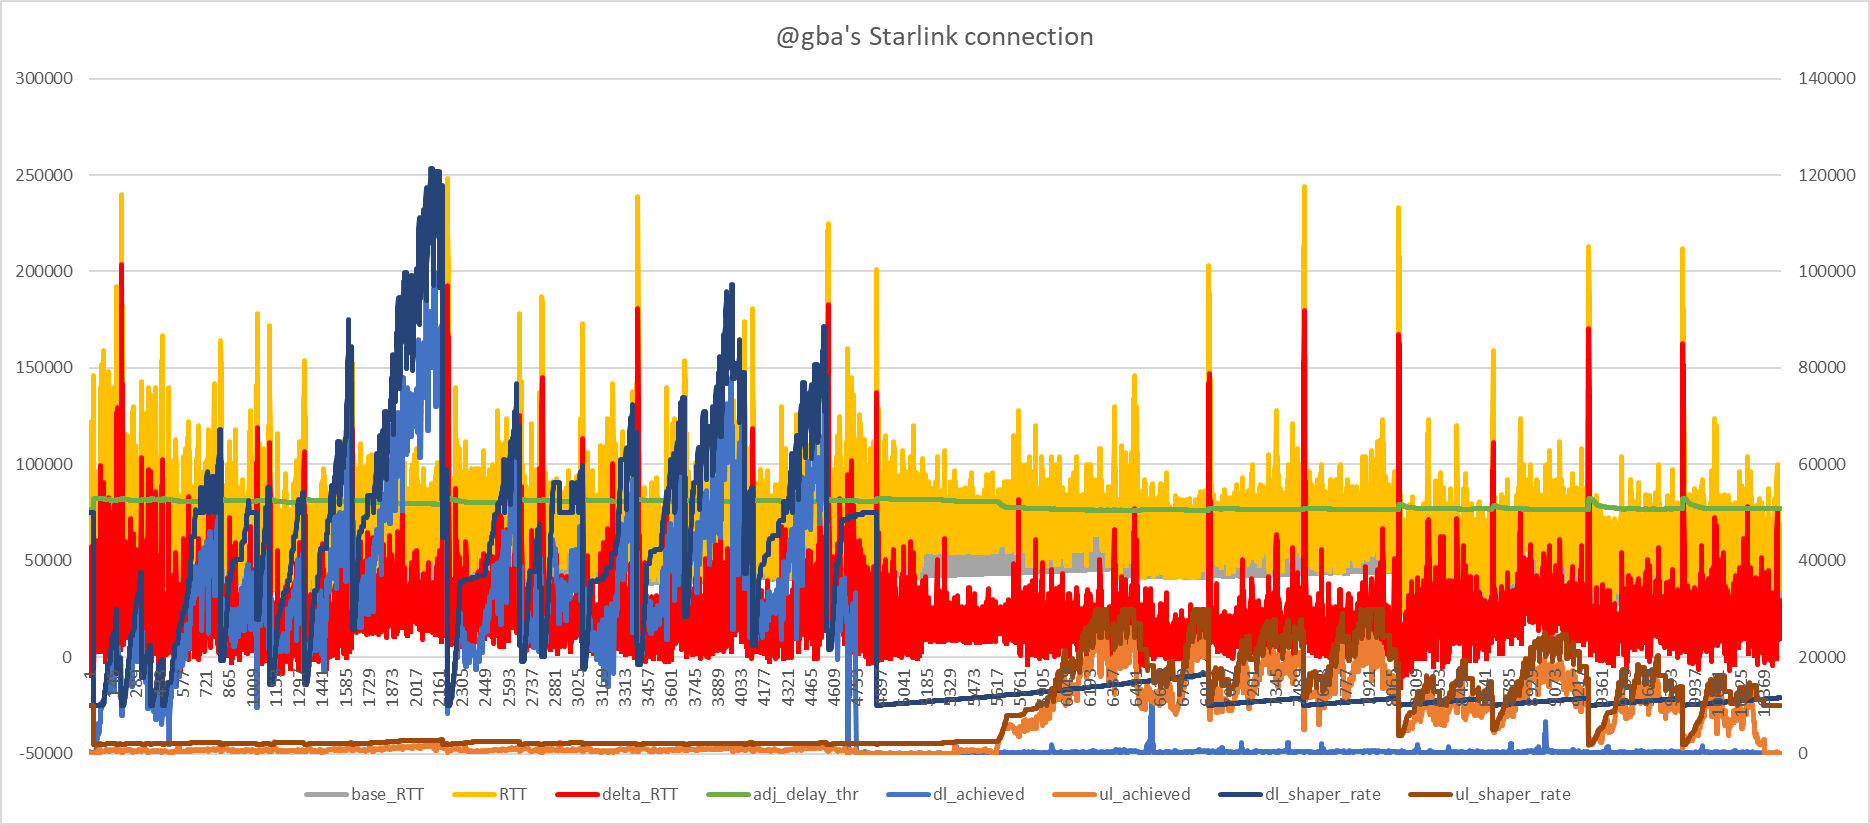
Download:

Close up of some of the oscillations:

I think this looks much better. I don't understand why holding the shaper rate fixed as in the earlier graphs results in the achieved rate cruising at 60% or so of the shaper rate. Why does disabling the medium rate logic have such a huge effect here. Hmm.
So there are pronounced spikes that I think look indicative of bufferbloat:
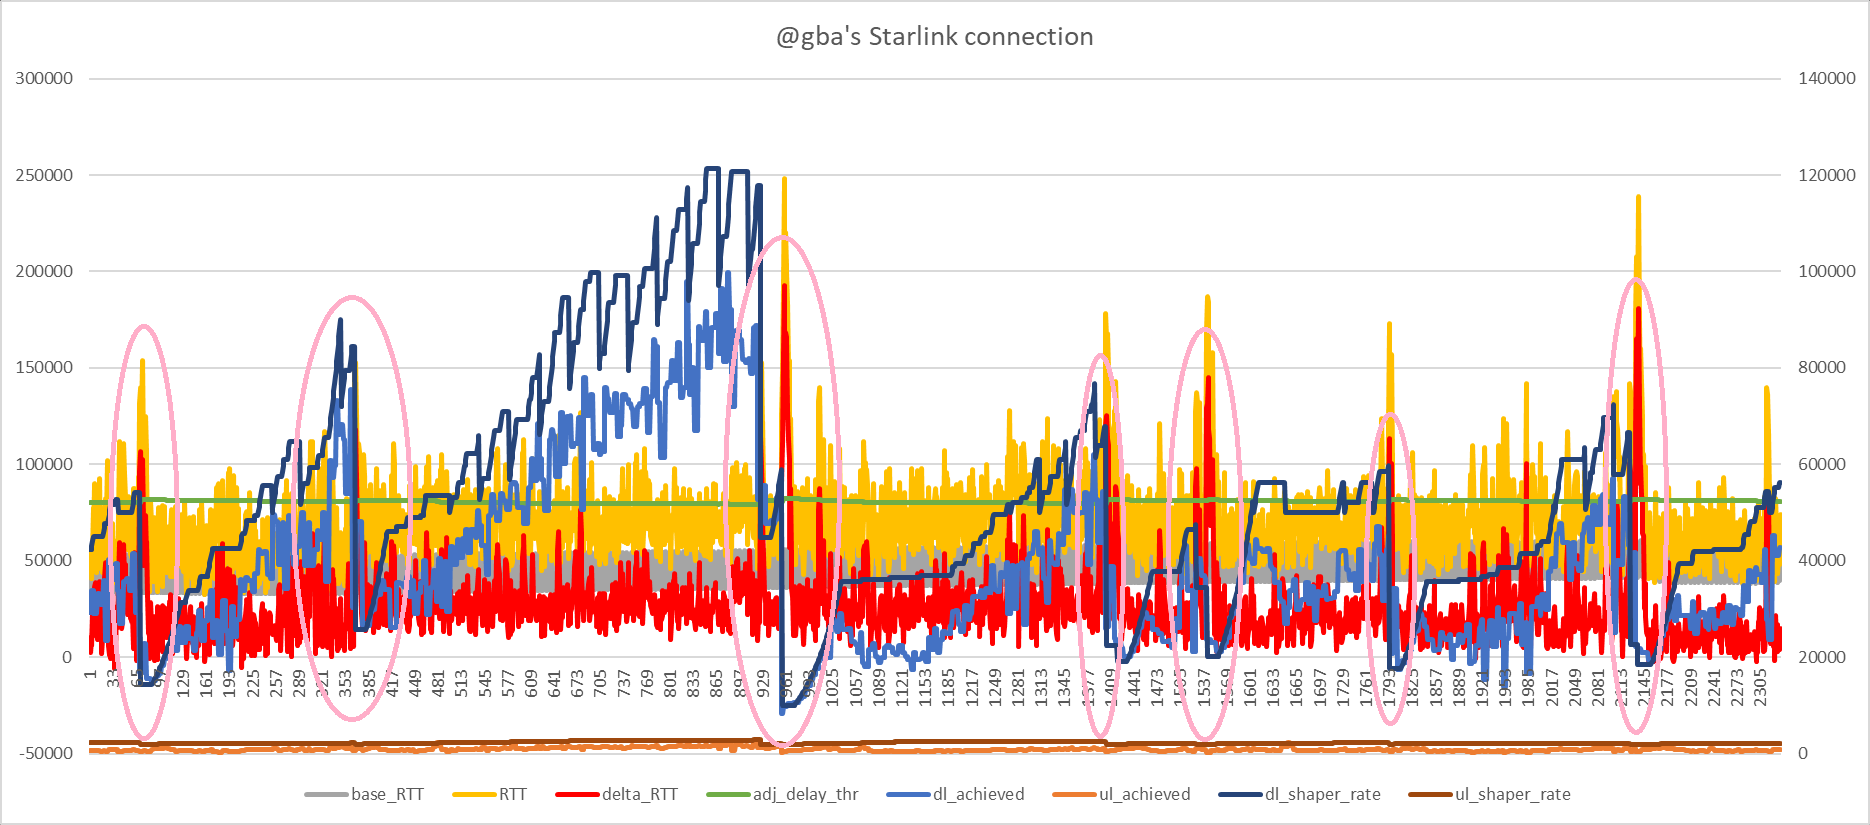
There are fairly large RTT spikes but your gping plot shows a p95 of 100ms, which seems pretty good.
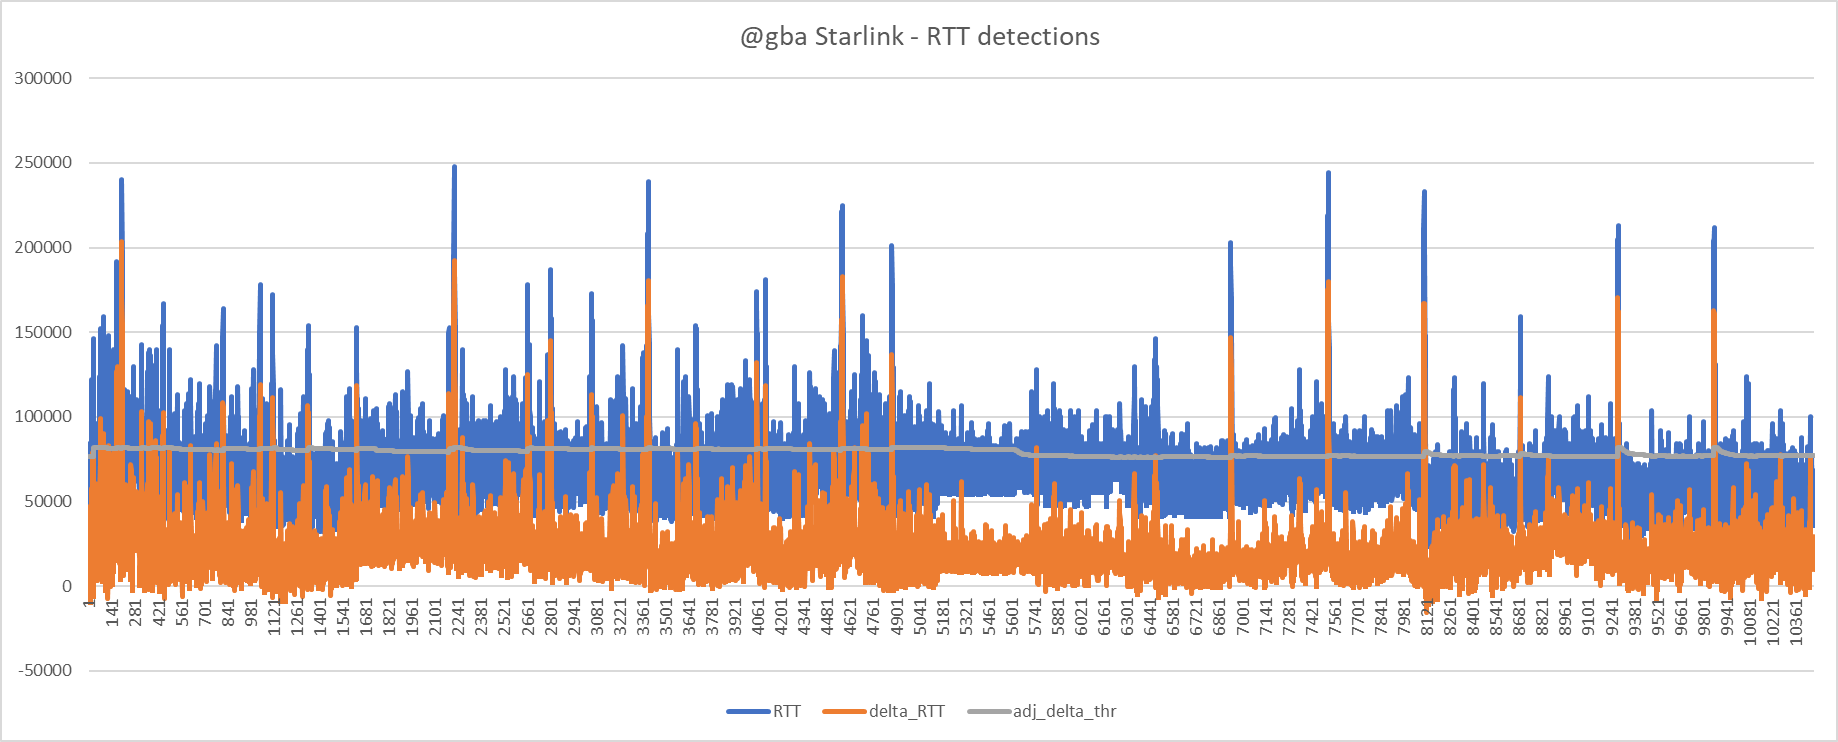
Detections data here:
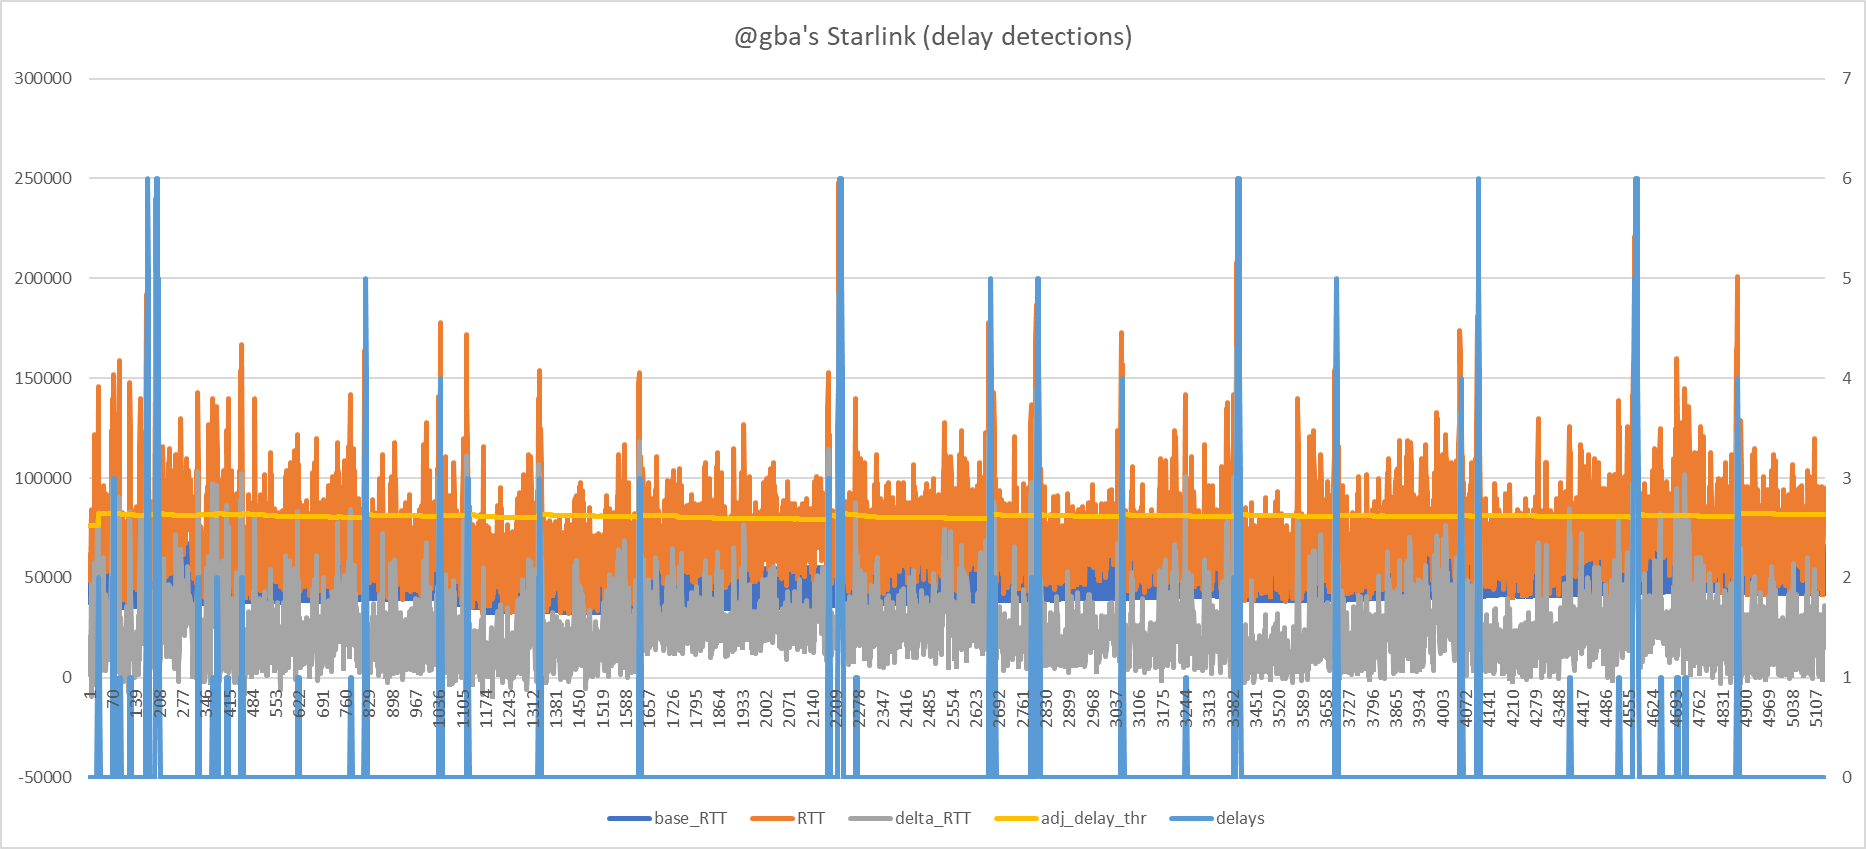
Here is some example data around bufferbloat:
1656345589.386733 53138  1056   71  49  [1656345589.284404] 8.8.8.8         617    40560  77300  36776  80764  0 low            low            73889  2142
1656345589.396266 53138  1056   71  49  [1656345589.293579] 8.8.4.4         616    40187  70300  30143  80764  0 low            low            73889  2142
1656345589.407134 53138  1056   71  49  [1656345589.369476] 9.9.9.9         615    60745  90300  29584  80764  0 low            low            73889  2142
1656345589.417006 53138  1056   71  49  [1656345589.396299] 1.1.1.1         620    40034  97100  57123  80764  0 low            low            73889  2142
1656345589.455886 33360  606    45  28  [1656345589.444115] 1.0.0.1         619    39056  113000 74018  80764  0 low            low            73889  2142
1656345589.465053 33360  606    45  28  [1656345589.449882] 9.9.9.10        614    59499  154000 94595  80764  1 low            low            73889  2142
1656345589.482200 33360  606    45  28  [1656345589.471311] 8.8.8.8         618    40631  112000 71440  80764  1 low            low            73889  2142
1656345589.525411 33360  606    45  28  [1656345589.511220] 8.8.4.4         617    40282  136000 95813  80764  2 low_delayed    low_delayed    28356  2000
1656345589.589181 36145  657    127 32  [1656345589.577485] 1.1.1.1         621    40119  126000 85966  81423  3 high_delayed   low_delayed    28356  2000
1656345589.599795 36145  657    127 32  [1656345589.583066] 9.9.9.9         616    60836  152000 91255  81423  4 high_delayed   low_delayed    28356  2000
1656345589.609697 36145  657    127 32  [1656345589.593418] 9.9.9.10        615    59582  143000 83501  81423  5 high_delayed   low_delayed    28356  2000
1656345589.633611 36145  657    127 32  [1656345589.615189] 1.0.0.1         620    39148  132000 92944  81423  5 high_delayed   low_delayed    28356  2000
1656345589.645926 28670  860    101 43  [1656345589.615914] 8.8.8.8         619    40695  105000 64369  81423  5 high_delayed   low_delayed    28356  2000
1656345589.659440 28670  860    101 43  [1656345589.620113] 8.8.4.4         618    40334  93000  52718  81423  4 high_delayed   low_delayed    28356  2000
1656345589.704653 28670  860    101 43  [1656345589.689522] 9.9.9.9         617    60881  106000 45164  81423  3 high_delayed   low_delayed    28356  2000
1656345589.727353 28670  860    101 43  [1656345589.706984] 1.1.1.1         622    40182  104000 63881  81423  2 high_delayed   low_delayed    28356  2000
1656345589.744948 28670  860    101 43  [1656345589.712163] 1.0.0.1         621    39185  76900  37752  81423  1 high           low            28356  2000
1656345589.757482 29814  724    105 36  [1656345589.716043] 9.9.9.10        616    59638  116000 56418  81423  0 high           low            28356  2000
1656345589.770063 29814  724    105 36  [1656345589.735702] 8.8.8.8         620    40727  72700  32005  81423  0 high           low            28356  2000
1656345589.784078 29814  724    105 36  [1656345589.737242] 8.8.4.4         619    40351  57900  17566  81423  0 high           low            28356  2000
1656345589.806884 29814  724    105 36  [1656345589.795874] 1.1.1.1         623    40182  41000  818    81423  0 high           low            28356  2000
1656345589.820167 29814  724    105 36  [1656345589.807760] 9.9.9.9         618    60892  72500  11619  81423  0 high           low            28356  2000
1656345589.831181 29814  724    105 36  [1656345589.812846] 9.9.9.10        617    59639  61600  1962   81423  0 high           low            28923  2000
1656345589.867248 29563  1019   102 50  [1656345589.844060] 1.0.0.1         622    39202  57100  17915  81414  0 high           low            29501  2000
1656345589.907758 29563  1019   100 50  [1656345589.875919] 8.8.8.8         621    40747  60800  20073  81406  0 high           low            30091  2000
1656345589.942358 29563  1019   98  50  [1656345589.881802] 8.8.4.4         620    40361  50500  10149  81398  0 high           low            30692  2000
1656345589.990838 31169  1195   101 59  [1656345589.979034] 9.9.9.9         619    60923  92000  31108  81390  0 high           low            31305  2000
1656345590.021839 31169  1195   99  59  [1656345589.990962] 1.1.1.1         624    40225  84000  43818  81383  0 high           low            31931  2000
1656345590.052304 31169  1195   97  59  [1656345589.999241] 9.9.9.10        618    59675  96200  36561  81375  0 high           low            32569  2000
1656345590.081427 32047  1036   98  51  [1656345590.009952] 1.0.0.1         623    39233  70900  31698  81368  0 high           low            33220  2020
What's your bufferbloat refractory period set to? I wonder if this is perhaps slightly too high. We are right now running with a ping interval of 0.15s and 6 reflectors, which is quite demanding. It would be nice to see if we could achieve the same results with a ping interval of 0.2s and 4 reflectors, but I gather you tried this earlier and it didn't work so well? Maybe we can try this in the next run following any other adjustments.
@moeller0 any suggestions in terms of the 'config.sh' parameters for further tweaking to improve things further for @gba?
@richb-hanover-priv I made your suggested changes to the instructions.
So @gba from my perspective this seems to be working, but I am open minded. Bear in mind the whole idea here is to try to give you a low latency experience notwithstanding the variability in Starlink to allow things like snappy browsing, Teams and Zoom whilst there is a Windows update or other form of download happening. I imagine with the present settings this will work. Whereas some users are obsessed with download and upload bandwidth numbers, I believe that beyond 10Mbit/s or so keeping latency low is actually much more key in terms of ensuring a smooth and happy connection. After all with latency spikes things like Zoom and VOIP become unusable, whereas having to wait a little longer for a Windows update is not a big deal.
This autorate script tries to track an optimal balance between keeping latency low, on the one hand, and offering bandwidth, on the other hand.
What are your thoughts @gba?
1 Like
I agree with your hypothesis, it looks like something else than our cake limits the throughput here in a way that stayed in between the medium and high load threshold; demonstrating once more that our "load" unfortunately is just an imprecise estimate.
Yes, that is my assumption as well. If one had control of a packet capture from the sender and at the receiver and the stats from our cake instance it should be possible to see whether there are other places besides cake that drop/CE-mark packets. But again some level of throttling could also be achieved by delaying the ACKs. (I would hope that it is the former not the latter though).
You could try lowering that some, but in the example I do not see that many rate reductions that show multiple refractory plateaus, so the scale to achieved rate heuristic works decently for the download.
None at the moment, if @gba could test this for a while even with latency sensitive applications like vide conferencing and get a feel whether that is better than without a traffic shaper that would be great. Yes, this currently seems to require a steep throughput sacrifice, but let's see whether at least bufferbloat is remedied sufficiently well (given the 200-300ms RTT spikes in the gping results I doubt that.) I think let's first tackle latency and the see how to improve the throughput.
1 Like
Certainly seems like a big improvement though, e.g. comparing:

with:

Based on this:
I wondered if the delta_thr could be reduced from 75ms to something a bit lower? But from looking into the data e.g.:
1656345600.077812 42478  878    83  39  [1656345599.907327] 8.8.8.8         687    42084  52300  10226  80620  0 high           low            52020  2228
1656345600.103150 42478  878    81  39  [1656345599.960977] 8.8.4.4         686    42071  86000  43972  80615  0 high           low            53060  2228
1656345600.126458 42478  878    80  39  [1656345600.024743] 1.1.1.1         690    41980  85700  43763  80611  0 high           low            54121  2228
1656345600.150200 41155  845    76  37  [1656345600.033325] 9.9.9.9         685    62510  110000 47537  80606  0 high           low            55203  2228
1656345600.172092 41155  845    74  37  [1656345600.042516] 1.0.0.1         689    41092  67200  26134  80602  0 low            low            55203  2228
1656345600.181619 41155  845    74  37  [1656345600.042205] 9.9.9.10        684    61678  98900  37259  80602  0 low            low            55203  2228
1656345600.192902 41155  845    74  37  [1656345600.048474] 8.8.8.8         688    41558  41500  -584   80602  0 low            low            55203  2228
1656345600.202559 41155  845    74  37  [1656345600.076379] 8.8.4.4         687    42078  49400  7329   80602  0 low            low            55203  2228
1656345600.230795 41155  845    74  37  [1656345600.219377] 1.1.1.1         691    42066  128000 86020  80602  1 low            low            55203  2228
1656345600.269252 26309  524    47  23  [1656345600.255972] 9.9.9.9         686    62628  181000 118490 80602  2 low_delayed    low_delayed    22362  2000
1656345600.308005 26309  524    117 26  [1656345600.260407] 9.9.9.10        685    61780  164000 102322 81536  3 high_delayed   low_delayed    22362  2000
1656345600.318283 26309  524    117 26  [1656345600.273945] 1.0.0.1         690    41197  147000 105908 81536  4 high_delayed   low_delayed    22362  2000
1656345600.329161 26309  524    117 26  [1656345600.304628] 8.8.8.8         689    41661  145000 103442 81536  5 high_delayed   low_delayed    22362  2000
1656345600.339699 26309  524    117 26  [1656345600.306893] 8.8.4.4         688    42161  126000 83922  81536  6 high_delayed   low_delayed    22362  2000
1656345600.373125 28633  559    128 27  [1656345600.360634] 1.1.1.1         692    42141  118000 75934  81536  5 high_delayed   low_delayed    22362  2000
1656345600.383502 28633  559    128 27  [1656345600.361345] 9.9.9.9         687    62695  130000 67372  81536  4 high_delayed   low_delayed    22362  2000
1656345600.395708 28633  559    128 27  [1656345600.371223] 9.9.9.10        686    61838  120000 58220  81536  3 high_delayed   low_delayed    22362  2000
1656345600.408324 28633  559    128 27  [1656345600.392541] 1.0.0.1         691    41270  115000 73803  81536  2 high_delayed   low_delayed    22362  2000
I'm not so sure. What do you think? Here is another data segment:
1656345598.553234 67786  1596   89  73  [1656345598.525407] 9.9.9.10        674    61326  102000 40714  80652  0 high           low            77434  2184
1656345598.579954 67786  1596   87  73  [1656345598.525715] 1.0.0.1         679    40684  74300  33649  80648  0 high           low            78982  2184
1656345598.611682 48698  1111   61  50  [1656345598.576853] 8.8.8.8         678    41780  93900  52172  80645  0 low            low            78982  2184
1656345598.622023 48698  1111   61  50  [1656345598.600960] 8.8.4.4         677    41750  102000 60310  80645  0 low            low            78982  2184
1656345598.666926 48698  1111   61  50  [1656345598.656156] 1.1.1.1         681    41665  85100  43478  80645  0 low            low            78982  2184
1656345598.681244 48698  1111   61  50  [1656345598.664603] 9.9.9.9         676    62190  109000 46856  80645  0 low            low            78982  2184
1656345598.699952 55685  1197   70  54  [1656345598.677342] 1.0.0.1         680    40717  74100  33416  80645  0 low            low            78982  2184
1656345598.716431 55685  1197   70  54  [1656345598.681678] 9.9.9.10        675    61368  104000 42674  80645  0 low            low            78982  2184
1656345598.726655 55685  1197   70  54  [1656345598.697192] 8.8.8.8         679    41800  62200  20420  80645  0 low            low            78982  2184
1656345598.738347 55685  1197   70  54  [1656345598.704906] 8.8.4.4         678    41761  53700  11950  80645  0 low            low            78982  2184
1656345598.821557 56688  1072   71  49  [1656345598.808672] 1.1.1.1         682    41709  85700  44035  80645  0 low            low            78982  2184
1656345598.836508 56688  1072   71  49  [1656345598.824945] 9.9.9.9         677    62245  118000 55810  80645  0 low            low            78982  2184
1656345598.868459 56688  1072   71  49  [1656345598.856324] 9.9.9.10        676    61435  129000 67632  80645  0 low            low            78982  2184
1656345598.922965 43902  716    55  32  [1656345598.912106] 1.0.0.1         681    40833  157000 116283 80645  1 low            low            78982  2184
1656345598.974057 43902  716    55  32  [1656345598.960405] 8.8.8.8         680    41932  174000 132200 80645  2 low_delayed    low_delayed    37316  2000
1656345599.027752 34335  601    92  30  [1656345598.965575] 8.8.4.4         679    41882  163000 121239 81321  3 high_delayed   low_delayed    37316  2000
1656345599.039242 34335  601    92  30  [1656345598.998158] 1.1.1.1         683    41790  123000 81291  81321  3 high_delayed   low_delayed    37316  2000
1656345599.050037 34335  601    92  30  [1656345599.008383] 9.9.9.9         678    62331  149000 86755  81321  4 high_delayed   low_delayed    37316  2000
1656345599.065822 34335  601    92  30  [1656345599.014424] 9.9.9.10        677    61508  135000 73565  81321  4 high_delayed   low_delayed    37316  2000
1656345599.076216 34335  601    92  30  [1656345599.032016] 1.0.0.1         682    40913  121000 80167  81321  3 high_delayed   low_delayed    37316  2000
1656345599.087743 34335  601    92  30  [1656345599.054965] 8.8.4.4         680    41935  95400  53518  81321  2 high_delayed   low_delayed    37316  2000
1656345599.100781 34335  601    92  30  [1656345599.055222] 8.8.8.8         681    42001  111000 69068  81321  1 high           low            37316  2000
1656345599.112697 39162  885    104 44  [1656345599.097244] 1.1.1.1         684    41818  70200  28410  81321  1 high           low            37316  2000
1656345599.123847 39162  885    104 44  [1656345599.107375] 9.9.9.9         679    62366  98000  35669  81321  0 high           low            37316  2000
1656345599.133733 39162  885    104 44  [1656345599.112467] 1.0.0.1         683    40921  49500  8587   81321  0 high           low            37316  2000
It seems with Starlink the bufferbloat results in a big RTT jump without much warning. This is already with a higher ping interval of 0.15s. Would reducing this or adding further reflectors help (perhaps with setting lower delta_thr) to catch bufferbloat quicker before such a big jump in RTT has occured?
I agree, but that could just be pure chance on how busy his "segment"/satellite-cell was in the two respective measurements ;), but there are still enough 200ms spikes to be annoying
@gba now it would be interesting to learn whether the link feels snappier for interactive use or not?
BTW, here is what idle latency to two hosts (just realized that gping allows to ping multiple hosts concurrently) looks on my fixed rate link:

Compared to the idle starlink trace this is much nicer to deal with ![]() But I am sure we will be able to tweak this to work in spite of the satellite challenge.
But I am sure we will be able to tweak this to work in spite of the satellite challenge.
I see what you mean - nice plots indeed!
Hmm... perhaps 75ms is still the optimum for @gba. See below

@gba it is not very obvious how we can improve things much. Perhaps further gain - even significant gain - is achievable by tweaking parameters and careful testing, but from what I can see (and as you can see I have been looking into this for you) I cannot see many obvious things to further tweak.
You can easily set this up as a service that runs in the background by just setting:
output_processing_stats=0 # enable (1) or disable (0) output monitoring lines showing processing stats
output_cake_changes=0     # enable (1) or disable (0) output monitoring lines showing cake bandwidth changes
debug=0			  # enable (1) or disable (0) out of debug lines
and steps here.
Would you mind sharing your config on here in full? I'd like to put it onto the GitHub readme as a template for Starlink use.
And as @moeller0 writes above, please give us your thoughts on general feel of the connection. Do you see CAKE + this autorate as an improvement in terms of interactive use? Your feedback as a Starlink user is very valuable indeed.
It would be great if the LUA team could get the LUA approach to work for Starlink users too because then we could compare the two approaches in terms of performance. @_FailSafe do you use the LUA approach on your docsis 24/7 now? I personally have now come to depend on my own autorate code for my LTE connection and use it 24/7 as a service on my RT3200. It seems to work very well and I can't imagine not using it now.
I would guess for testing it should suffice to use a VPN to shuttle the ICMP timestamps though whatever unspeakable starlink is doing to those packets. Not ideal, but easier than to wait for starlink to stop doing what they are doing?
1 Like
Different question, @Lynx, since now you have a version that works well and with which you accumulated quite a lot of experience; could I convince you to run a set of experiments aiming at finding out what aggregate reflector rate seems required? Leave the diverse set of reflectors, but increase the interval.
1 Like
Sweet yes! @gba more food for thought but my mobile provider for my connection selectively throttles packets in dependence on port number. Using a VPN circumvents that. So I get higher bandwidth for certain connections. It may be worth you signing up to a VPN service (I use NordVPN) so that you can test the LUA implementation (which uses a completely different strategy) and also so that you see if it means circumventing any funny stuff that Starlink does do your traffic. With most of these services you can sign up and cancel within cooling off period and not end up paying anything if it doesn't pay off. I really think would be worth trying.
Yes sure. I will stick with 4 reflectors as default and vary the rate and try to see what impact that has. With 4 reduction from 0.1s to 0.2s seemed OK.
What's your guess about how this will go?
Might be the weekend until I can test as back to work tomorrow in theory. Unfortunately, well fortunately, I seem to have recovered fairly quickly.
1 Like
0.2/4 = 0.05 every 50ms... not too bad (and with the advantage that 200ms is the minimal interval non-root users can use, making this look much more benign from the outside). I would guess that 400ms@4reflectors (so every 100ms) will probably still perform acceptably; not sure what happens once the we go to 800 or even 1000ms intervals (wild guess, it will feel more sluggish).
That i s good news actually. Take your time. I think it wise to test this on a weekend, say video conference with friends/family where there is more tolerance if things should misbehave...
1 Like
Thanks again for all the work you both are doing on this project. I hope some other Starlink users come in here and try it out.
Here is my full config.sh:
#!/bin/bash

# config.sh sets up defaults for CAKE-autorate

# config.sh is a part of CAKE-autorate
# CAKE-autorate automatically adjusts bandwidth for CAKE in dependence on detected load and RTT

# Author: @Lynx (OpenWrt forum)
# Inspiration taken from: @moeller0 (OpenWrt forum)

# *** OUTPUT OPTIONS ***

output_processing_stats=0 # enable (1) or disable (0) output monitoring lines showing processing stats
output_cake_changes=0     # enable (1) or disable (0) output monitoring lines showing cake bandwidth changes
debug=0			  # enable (1) or disable (0) out of debug lines

# *** STANDARD CONFIGURATION OPTIONS ***

dl_if=ifb4eth0 # download interface
ul_if=eth0     # upload interface

reflector_ping_interval_s=0.15 # (seconds, e.g. 0.2s or 2s)

# list of reflectors to use and number of pingers to initiate
# pingers will be initiated with reflectors in the order specified in the list
# additional reflectors will be used to replace any reflectors that go stale
# so e.g. if 6 reflectors are specified and the number of pingers is set to 4, the first 4 reflectors will be used initially
# and the remaining 2 reflectors in the list will be used in the event any of the first 4 go bad
# a bad reflector will go to the back of the queue on reflector rotation
reflectors=("1.1.1.1" "1.0.0.1" "8.8.8.8" "8.8.4.4" "9.9.9.9" "9.9.9.10")
no_pingers=6

# delay threshold in ms is the extent of RTT increase to classify as a delay
# this is automatically adjusted based on maximum on the wire packet size
# (adjustment significant at sub 12Mbit/s rates, else negligible)
delay_thr_ms=75 # (milliseconds)

min_dl_shaper_rate_kbps=10000  # minimum bandwidth for download (Kbit/s)
base_dl_shaper_rate_kbps=50000 # steady state bandwidth for download (Kbit/s)
max_dl_shaper_rate_kbps=200000  # maximum bandwidth for download (Kbit/s)

min_ul_shaper_rate_kbps=2000  # minimum bandwidth for upload (Kbit/s)
base_ul_shaper_rate_kbps=10000 # steady state bandwidth for upload (KBit/s)
max_ul_shaper_rate_kbps=30000  # maximum bandwidth for upload (Kbit/s)

# sleep functionality saves unecessary pings and CPU cycles by
# pausing all active pingers when connection is not in active use
enable_sleep_function=1 # enable (1) or disable (0) sleep functonality
connection_active_thr_kbps=500 # threshold in Kbit/s below which dl/ul is considered idle
sustained_idle_sleep_thr_s=60  # time threshold to put pingers to sleep on sustained dl/ul achieved rate < idle_thr (seconds)

startup_wait_s=0 # number of seconds to wait on startup (e.g. to wait for things to settle on router reboot)

# *** ADVANCED CONFIGURATION OPTIONS ***

# interval in ms for monitoring achieved rx/tx rates
# this is automatically adjusted based on maximum on the wire packet size
# (adjustment significant at sub 12Mbit/s rates, else negligible)
monitor_achieved_rates_interval_ms=100 # (milliseconds)

# bufferbloat is detected when (bufferbloat_detection_thr) samples
# out of the last (bufferbloat detection window) samples are delayed
bufferbloat_detection_window=6  # number of samples to retain in detection window
bufferbloat_detection_thr=2     # number of delayed samples for bufferbloat detection

# RTT baseline against which to measure delays
# the idea is that the baseline is allowed to increase slowly to allow for path changes
# and slowly enough such that bufferbloat will be corrected well before the baseline increases,
# but it will decrease very rapidly to ensure delays are measured against the shortest path
alpha_baseline_increase=0.001 # how rapidly baseline RTT is allowed to increase
alpha_baseline_decrease=0.9   # how rapidly baseline RTT is allowed to decrease

# rate adjustment parameters
# bufferbloat adjustment works with the lower of the adjusted achieved rate and adjusted shaper rate
# to exploit that transfer rates during bufferbloat provide an indication of line capacity
# otherwise shaper rate is adjusted up on load high, and down on load idle or low
# and held the same on load medium
achieved_rate_adjust_down_bufferbloat=0.85 # how rapidly to reduce achieved rate upon detection of bufferbloat
shaper_rate_adjust_down_bufferbloat=0.85   # how rapidly to reduce shaper rate upon detection of bufferbloat
shaper_rate_adjust_up_load_high=1.02       # how rapidly to increase shaper rate upon high load detected
shaper_rate_adjust_down_load_low=0.8       # how rapidly to return down to base shaper rate upon idle or low load detected
shaper_rate_adjust_up_load_low=1.01        # how rapidly to return up to base shaper rate upon idle or low load detected

# the load is categoried as low if < medium_load_thr, medium if > medium_load_thr and high if > high_load_thr relative to the current shaper rate
medium_load_thr=0.75 # % of currently set bandwidth for detecting medium load
high_load_thr=0.75   # % of currently set bandwidth for detecting high load

# refractory periods between successive bufferbloat/decay rate changes
# the bufferbloat refractory period should be greater than the
# average time it would take to replace the bufferbloat
# detection window with new samples upon a bufferbloat event
bufferbloat_refractory_period_ms=300 # (milliseconds)
decay_refractory_period_ms=1000 # (milliseconds)

# interval for checking reflector health
reflector_health_check_interval_s=1 # (seconds)
# deadline for reflector response not to be classified as an offence against reflector
reflector_response_deadline_s=1 # (seconds)

# reflector misbehaving is detected when $reflector_misbehaving_detection_thr samples
# out of the last (reflector misbehaving detection window) samples are offences
# thus with a 1s interval, window 60 and detection_thr 3, this is tantamount to
# 3 offences within the last 60s
reflector_misbehaving_detection_window=60
reflector_misbehaving_detection_thr=3

global_ping_response_timeout_s=10 # timeout to set shaper rates to min on no ping response whatsoever (seconds)

if_up_check_interval_s=10 # time to wait before re-checking if rx/tx bytes files exist (e.g. from boot state)

# verify these are correct using 'cat /sys/class/...'
case "${dl_if}" in
    \veth*)
        rx_bytes_path="/sys/class/net/${dl_if}/statistics/tx_bytes"
        ;;
    \ifb*)
        rx_bytes_path="/sys/class/net/${dl_if}/statistics/tx_bytes"
        ;;
    *)
        rx_bytes_path="/sys/class/net/${dl_if}/statistics/rx_bytes"
        ;;
esac

case "${ul_if}" in
    \veth*)
        tx_bytes_path="/sys/class/net/${ul_if}/statistics/rx_bytes"
        ;;
    \ifb*)
        tx_bytes_path="/sys/class/net/${ul_if}/statistics/rx_bytes"
        ;;
    *)
        tx_bytes_path="/sys/class/net/${ul_if}/statistics/tx_bytes"
        ;;
esac

if (( $debug )) ; then
    echo "DEBUG: rx_bytes_path: $rx_bytes_path"
    echo "DEBUG: tx_bytes_path: $tx_bytes_path"
fi
My thoughts so far are that I'm not sure I fully trust my subjective observations, but it does seem a little snappier when browsing. I haven't had to do much bandwidth intensive, other than run speed tests of course ![]()
It is a little unfortunate to see how much bandwidth is lost, though, even though I know latency is much more important. I haven't done a conclusive study or anything, but with just a fixed CAKE SQM set to 200/30 I usually got around 100 Mbps down in the morning speedtests, and with autorate it is cut to usually around 50. Upload also seems to be about cut in half, sometimes worse. I will keep testing and see if that continues.
So I'm going to keep running this because that is totally worth it to me if the latency is better, but it does seem like there is probably a way to get a smaller bandwidth cut, at least there would be if we knew better how Starlink actually operated. Dave had posted about those bandwidth buckets he had found that it at least used to use...I've been pondering if that info could be used somehow, at least if we knew it still operated that way.
So thanks again for working on this, I'll keep playing with it and hopefully others will too.
1 Like
I think a low latency experience IS more important than maxing out the bandwidth numbers in synthetic tests, but of course it all depends on what the connection is used for. But as per discussions above, beyond about 10Mbit/s most stuff like Amazon Prime and Netflix just works, whereas latency sensitive applications like Teams and Zoom or VOIP become broken on latency spikes.
One thing to keep in mind is that in this autorate approach the turbo function, if you will, is designed to offer incremental departure from the safe harbour so long as conditions allow for it. Imagine a ship in the safe harbour and it ventures out to sea. Now imagine conditions seem OK and it keeps going out further and further until the waves, or the French, hit. Or a processor that is allowed to get more and more power until the heat becomes too much. It takes time for it to cautiously ramp up to the full speed. This way it is ready to deal with step loads in the unloaded state from the base condition without huge latency spikes, but is also able to carefully offer more and more bandwidth as the conditions allow for it.
The Waveform bufferbloat test (what scores do you get on those - could you share?) only lasts about 60 seconds I think? But it could be that that is not enough time for the full bandwidth to get realised upon a departure from the base bandwidth. That will depend on 'shaper_rate_adjust_up_load_high' and also your connection. LTE suffers from 'slow start' where it improves on sustained use. I think fast.com allows you to change the time for the test under settings up to 300s.

Or you can download a big .ISO file from a fast server and see what actual transfer speed it settles at.
Again, the conservative, safety first, strategy in this autorate should allow low latency under idle conditions by working from the safe harbour base bandwidth then, and yet also allow cautious departures in bandwidth up to the maximum possible before latency spikes bring it back down and it oscillates around and tracks the maximum capacity. Thus in this way you should be able to see responsive fast browsing on low use and yet also end up with decent transfer speeds for big downloads or uploads whilst still being able to use low latency applications at the same time. Also sudden step loads from idle or low use shouldn't result in big latency spikes.
If you are willing to sacrifice more low latency for some extra bandwidth you could try setting:
bufferbloat_detection_window=6  # number of samples to retain in detection window
bufferbloat_detection_thr=4    # number of delayed samples for bufferbloat detection
That is, increasing the detection threshold from 2 to 4, but I suspect this will let through a lot more undesirable latency spikes only for the sake of higher numbers in synthetic tests.
You could also try raising the base bandwidth to closer to the maximum bandwidth. This will reduce or eliminate the time it takes to ramp up the shaper rates, allowing more bandwidth in the early phase of a sustained connection, but will have the potential for more latency spikes on step loads from idle or low loads. I think in terms of getting the best out of an interactive experience, the base rate should be low - probably your present 50Mbit/s is fine, but this is also something you could try playing with.
Overall I am really pleased that this autorate project seems to at least offer an improvement for Starlink users, since that feels like a pretty important use case. I have edited the readme to include the config you kindly shared as an example config for Starlink users based on our experiences here.
I had a quick look at the flent traces, and IMHO Nick is currently sacrificing a lot of potential throughput, latency however stays considerably saner (but due to the large RTT spikes even on an idle link the overall RTT pattern still looks pretty unpleasant). I guess the question is first, is this as good as it gets based on perceived interactivity or not. Because once we have a baseline as reference we can try to get a bit more throughput without sacrificing too much responsiveness.
Were they from the flent traces before we'd optimized some of the parameters though? Or after? Maybe that'd also make some difference?
Yes, I'm pleased so far. The Waveform bufferbloat test has generally been returning an A or sometimes even A+ while running this autorate script. It sometimes returns A without autorate, but sometimes drops down to C, whereas with the script it seems more consistenly returning higher scores.
I have tried doing the fast.com test for 300 seconds and the bandwidth seems to be fairly similar to doing a 60 second test. Looking at the autorate log, it seems to frequently drop the bandwidth limit down quite low, so in a big download it will go up up up to maybe 150 Mbps and then drop it down to 10 Mbps, when the latency spikes, before going up again.
But it is hard to compare bandwidth tests, as even without autorate I can do a test and get 120 Mbps average and then do another one a minute later and get 25 Mbps. It sounds like Starlink can switch satellites about every 15 seconds, so one satellite could be more congested than another, or it could be connecting to a different ground station, who knows?
I'll keep running these parameters for a few days and see how they "feel".
I'll run a flent test with these too this morning for comparison's sake.
1 Like
Another way to force a longer test (if you've ssh'd in) is betterspeedtest.sh from the OpenWrtScripts repo.
It has parameters for test server, test duration, number of simultaneous connections, etc. I find its display of 90th percentile (90% of all samples are less than that value) useful for evaluating whether a change has made a difference.
2 Likes
speedtest.net in addition to adding a bufferbloat test to their phone apps a few weeks back, just added one to their web app.. Don't know about the -cli version.
2 Likes
Actually yes from the above looks like the output from betterspeedtest.sh is very helpful - especially the 90% in respect of latency. @gba perhaps focus on using this.
√ OpenWrtScripts % sh betterspeedtest.sh -t 20 -p 1.1.1.1
2022-06-26 19:35:45 Testing against netperf.bufferbloat.net (ipv4) with 5 simultaneous sessions while pinging 1.1.1.1 (20 seconds in each direction)
.....................
 Download: 55.73 Mbps
  Latency: (in msec, 21 pings, 0.00% packet loss)
      Min: 9.111
    10pct: 9.611
   Median: 10.766
      Avg: 29.164
    90pct: 27.721
      Max: 327.052
.....................
   Upload: 71.70 Mbps
  Latency: (in msec, 21 pings, 0.00% packet loss)
      Min: 8.935
    10pct: 9.022
   Median: 10.677
      Avg: 11.540
    90pct: 11.443
      Max: 30.117
√ OpenWrtScripts % sh betterspeedtest.sh -t 20 -p 1.1.1.1
2022-06-26 19:36:30 Testing against netperf.bufferbloat.net (ipv4) with 5 simultaneous sessions while pinging 1.1.1.1 (20 seconds in each direction)
.....................
 Download: 73.58 Mbps
  Latency: (in msec, 21 pings, 0.00% packet loss)
      Min: 8.751
    10pct: 9.000
   Median: 10.598
      Avg: 10.536
    90pct: 11.296
      Max: 14.897
.....................
   Upload: 58.06 Mbps
  Latency: (in msec, 21 pings, 0.00% packet loss)
      Min: 9.268
    10pct: 9.346
   Median: 10.608
      Avg: 23.781
    90pct: 13.284
      Max: 270.800
1 Like
At that point (betterspeedtest.sh) you might as well use flent ![]()