@Lynx:
here is the plot from the merged gz file:

At the beginning of the new log we again have a few samples of massive UL_OWD_DELTA_US and DL_OWD_DELTA_US that cause these weird spikes and the rotten autoscaling. Any ide what these are related to?
DATA; 2022-10-03-20:32:32; 1664825552.382289; 1664825552.381449; 17; 20; 0; 0; 1664825552.368850; 1.0.0.1; 610; 26451; 49000; 22571; 26451; 49000; 22571; 13391; 4; 4; dl_idle_bb; ul_idle_bb; 10000; 25000
DATA; 2022-10-03-20:32:32; 1664825552.436643; 1664825552.435807; 17; 20; 0; 0; 1664825552.423860; 8.8.8.8; 610; 26947; 51500; 24577; 26947; 51500; 24577; 13391; 4; 4; dl_idle_bb; ul_idle_bb; 10000; 25000
DEBUG; 2022-10-03-20:32:32; 1664825552.439301; Connection idle. Enforcing minimum shaper rates and waiting for minimum load.
DEBUG; 2022-10-03-20:35:07; 1664825707.838080; concurrent_read_positive_integer() misfire with the following particulars:
DEBUG; 2022-10-03-20:35:07; 1664825707.838904; caller=280 /root/cake-autorate/cake-autorate.sh, value= and path=/var/run/cake-autorate/dl_achieved_rate_kbps
DEBUG; 2022-10-03-20:35:08; 1664825708.240214; concurrent_read_positive_integer() misfire with the following particulars:
DEBUG; 2022-10-03-20:35:08; 1664825708.241060; caller=280 /root/cake-autorate/cake-autorate.sh, value= and path=/var/run/cake-autorate/dl_achieved_rate_kbps
DEBUG; 2022-10-03-20:35:08; 1664825708.642678; concurrent_read_positive_integer() misfire with the following particulars:
DEBUG; 2022-10-03-20:35:08; 1664825708.643498; caller=280 /root/cake-autorate/cake-autorate.sh, value= and path=/var/run/cake-autorate/dl_achieved_rate_kbps
INFO; 2022-10-03-20:35:08; 1664825708.865337;
INFO; 2022-10-03-20:35:08; 1664825708.866008; Killing all background processes and cleaning up temporary files.
DEBUG; 2022-10-03-20:35:09; 1664825709.010089; Starting CAKE-autorate 1.1.0
DEBUG; 2022-10-03-20:35:09; 1664825709.010717; Down interface: ifb-dl (10000 / 25000 / 80000)
HEADER; LOG_DATETIME; LOG_TIMESTAMP; PROC_TIME_US; DL_ACHIEVED_RATE_KBPS; UL_ACHIEVED_RATE_KBPS; DL_LOAD_PERCENT; UL_LOAD_PERCENT; RTT_TIMESTAMP; REFLECTOR; SEQUENCE; DL_OWD_BASELINE; DL_OWD_US; DL_OWD_DELTA_US; UL_OWD_BASELINE; UL_OWD_US; UL_OWD_DELTA_US; ADJ_DELAY_THR; SUM_DL_DELAYS; SUM_UL_DELAYS; DL_LOAD_CONDITION; UL_LOAD_CONDITION; CAKE_DL_RATE_KBPS; CAKE_UL_RATE_KBPS
DEBUG; 2022-10-03-20:35:09; 1664825709.011255; Up interface: ifb-ul (25000 / 30000 / 35000)
DEBUG; 2022-10-03-20:35:09; 1664825709.011724; rx_bytes_path: /sys/class/net/ifb-dl/statistics/tx_bytes
DEBUG; 2022-10-03-20:35:09; 1664825709.012171; tx_bytes_path: /sys/class/net/ifb-ul/statistics/rx_bytes
DATA; 2022-10-03-20:35:09; 1664825709.157610; 1664825709.157281; 0; 0; 0; 0; 1664825709.148040; 1.1.1.1; 0; 86000; 40000; -460000; 86000; 40000; -460000; 12966; 0; 0; dl_idle; ul_idle; 25000; 30000
DATA; 2022-10-03-20:35:09; 1664825709.191164; 1664825709.190701; 0; 0; 0; 0; 1664825709.181980; 1.0.0.1; 0; 78665; 31850; -468150; 78665; 31850; -468150; 12966; 0; 0; dl_idle; ul_idle; 25000; 30000
DATA; 2022-10-03-20:35:09; 1664825709.269093; 1664825709.267788; 7; 15; 0; 0; 1664825709.256070; 8.8.8.8; 0; 89420; 43800; -456200; 89420; 43800; -456200; 12966; 0; 0; dl_idle; ul_idle; 25000; 30000
DATA; 2022-10-03-20:35:09; 1664825709.321283; 1664825709.320656; 7; 15; 0; 0; 1664825709.310040; 8.8.4.4; 0; 91175; 45750; -454250; 91175; 45750; -454250; 12966; 0; 0; dl_idle; ul_idle; 25000; 30000
DATA; 2022-10-03-20:35:09; 1664825709.371354; 1664825709.370505; 7; 15; 0; 0; 1664825709.358020; 1.1.1.1; 1; 48785; 44650; -41350; 48785; 44650; -41350; 12966; 0; 0; dl_idle; ul_idle; 25000; 30000
DATA; 2022-10-03-20:35:09; 1664825709.404935; 1664825709.404101; 7; 15; 0; 0; 1664825709.392060; 1.0.0.1; 1; 40806; 36600; -42065; 40806; 36600; -42065; 12966; 0; 0; dl_idle; ul_idle; 25000; 30000
DATA; 2022-10-03-20:35:09; 1664825709.458921; 1664825709.458079; 7; 15; 0; 0; 1664825709.446040; 8.8.8.8; 1; 43592; 38500; -50920; 43592; 38500; -50920; 12966; 0; 0; dl_idle; ul_idle; 25000; 30000
DATA; 2022-10-03-20:35:09; 1664825709.506134; 1664825709.505296; 19; 15; 0; 0; 1664825709.492990; 8.8.4.4; 1; 42372; 36950; -54225; 42372; 36950; -54225; 12966; 0; 0; dl_idle; ul_idle; 25000; 30000
DATA; 2022-10-03-20:35:09; 1664825709.550009; 1664825709.549556; 19; 15; 0; 0; 1664825709.537960; 1.1.1.1; 2; 35748; 34300; -14485; 35748; 34300; -14485; 12966; 0; 0; dl_idle; ul_idle; 25000; 30000
DATA; 2022-10-03-20:35:09; 1664825709.610692; 1664825709.609848; 19; 15; 0; 0; 1664825709.597990; 1.0.0.1; 2; 39405; 39250; -1556; 39405; 39250; -1556; 12966; 0; 0; dl_idle; ul_idle; 25000; 30000
DATA; 2022-10-03-20:35:09; 1664825709.670443; 1664825709.669516; 11; 15; 0; 0; 1664825709.657140; 8.8.8.8; 2; 43592; 43800; 208; 43592; 43800; 208; 12966; 0; 0; dl_idle; ul_idle; 25000; 30000
Yes these are because I set the initial baseline to 1 second!
But on log rotation why is the baseline re-initialized?
I guess I can take care of this by "ignoring" samples with a sequence number < 10 or so for the display or so... (so for single shot delay measurements sequence would need to be filled manually).
It's not reinitialised on log rotation but there I exited and reran the script (which triggers a log rotation). I set baselines to 1s to avoid having to first obtain baseline. And 1s because whilst the reduction is extremely rapid the incrementation is extremely slow so it's better to overshoot and it corrects within about about three samples.
We could skip the first few samples in the monitor responses loop but that'd require another if test for all samples even though this only affects the first few. Or I could go back to pinging to obtain baselines on startup. Or have user set initial baselines?
Nah, I will try to simply use the sequence field to either exclude those points from the plots or to just exclude those from the autoscaling of the y-axis. I just wondered why these (extremely large baseline values) would show up again, but your sequence of events effortlessly explains this and also shows why the plotting code should learn to deal with that.
1 Like
Turns out excluding the first sample is already enough to get usable autoscaling (at least for the three test logs I have sitting around).
1 Like
Here is how we, at present, set the baseline default to 1s (when not resuming from a sleep in which case previous baseline is read in):
We could simply read in sufficient lines to cover the first three values for each reflector from the fifo in an initial while/read loop purely to set up the baseline?
Although there is the issue of bad reflector / potential stall to worry about and those aren't handled at that point yet. So stalling there could be bad.
I just want to check you think optimal behaviour is to just set 1s at startup as we're doing at the moment.
I think the current logic works reasonably well. The high initial value gets corrected after the first sample and the challenge is simply when to declare a suitable baseline acquired. Unless there is consisten reliable bufferbloat the current baseline maintenance method will find something close to the true baseline quickly enough.
The only case where this would not work well is if the true baseline is larger than 1 second. But in those cases the EWMA will slowly grow to the true baseline and up to that point we sacrifice a bit of potential throughput
@patrakov what RTTs do you see on your LTE links?
I would guess this is "good enough" behaviour ;). But let's ask in the main thread about what reasonable RTTs people see in real life, and then figure out whether 1 second is sufficiently large...
But I am keen that this is the best it can be under the paradigm: strive for excellence, rather than settle for mediocrity (the latter happens a little too much in the UK right now). If you think the best it can be is user specifying defaults then we should probably switch to that. Then again, I am also aware that moving mountains for the benefit of peanuts is a waste. But the latter concept shouldn't be abused in a vain attempt to justify indolence. If a job's worth doing, it's worth doing well, said my Grandmother.
BTW the plots are super cool. Is the plot above the plot with scales corrected or did that generate a different looking plot? If the latter, could you post it here?
The whole controller is based on heuristics and those tend to be rarely "optimal", "good enough" is not intended to mean "bad", it is just my way of managing the expectation ![]()
No I think we need to start with some value and 1 second is "one value" we expect this to converge on something close to the tue base line in a few iterations anyway, but since we shrink the baseline quickly but grow it slowly it seems like a clever twist to start with a value that is likely too high...
I am with your grand mother on that, it is just IMHO we have a decent solution that does something like 95% of the optimum (percentages courtesy of thin air) so I think this is already done well.
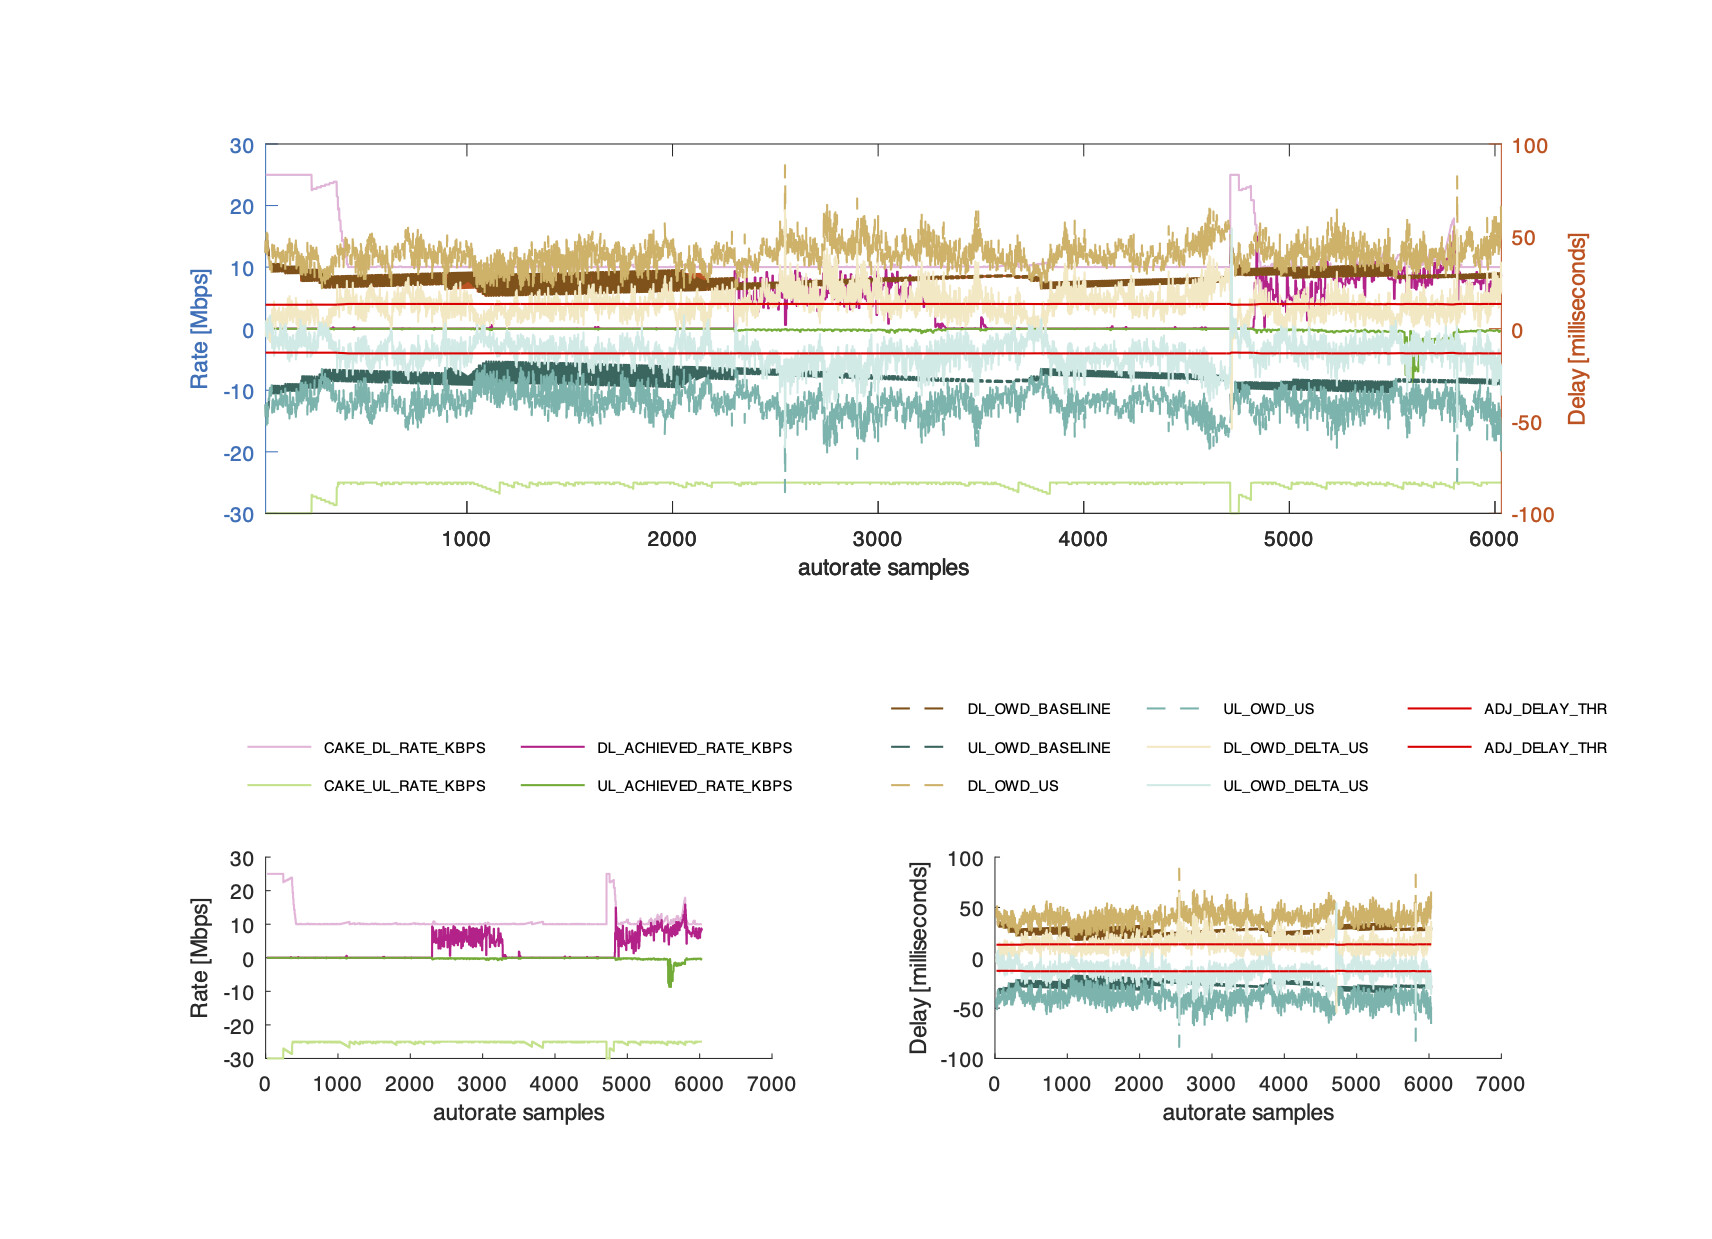
This is with just not plotting the few delay samples with sequence number 0...
Love the plot!
I created a pull request.
It is typically less than 80 ms on the unloaded link, but can become of the order of 1-2 seconds during bufferbloat events at bad times.
1 Like
Thanks, so unless we find a case with correct baseline values in the 1 second range this is a suitable starting value.