@dtaht, here you go—same test variables, MCS, rate, channel, etc. The only difference is that I did previous tests in macOS 12.5, and now they are performed in macOS 12.5.1. So I hope it won't be a big difference.
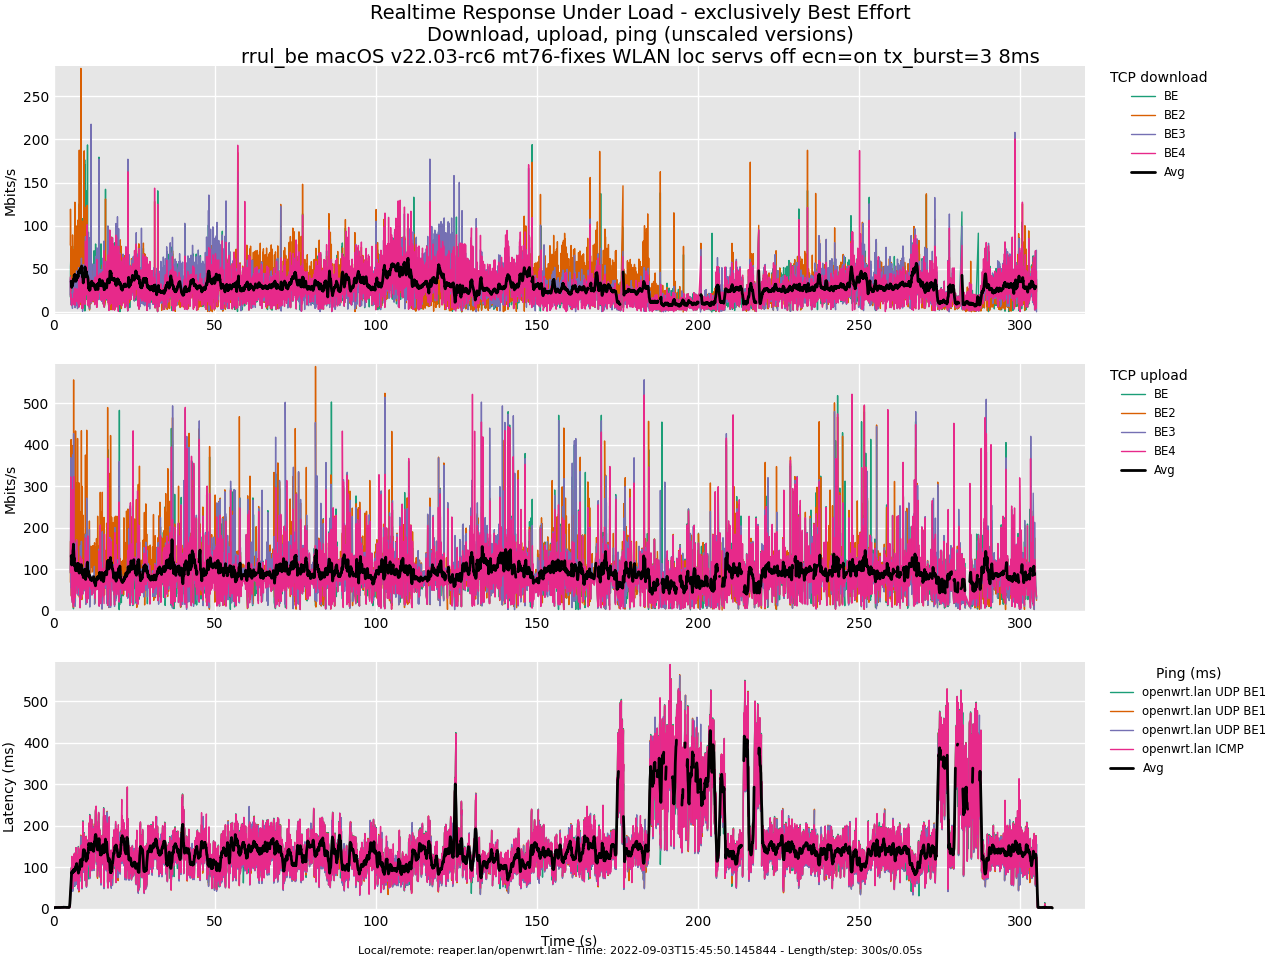
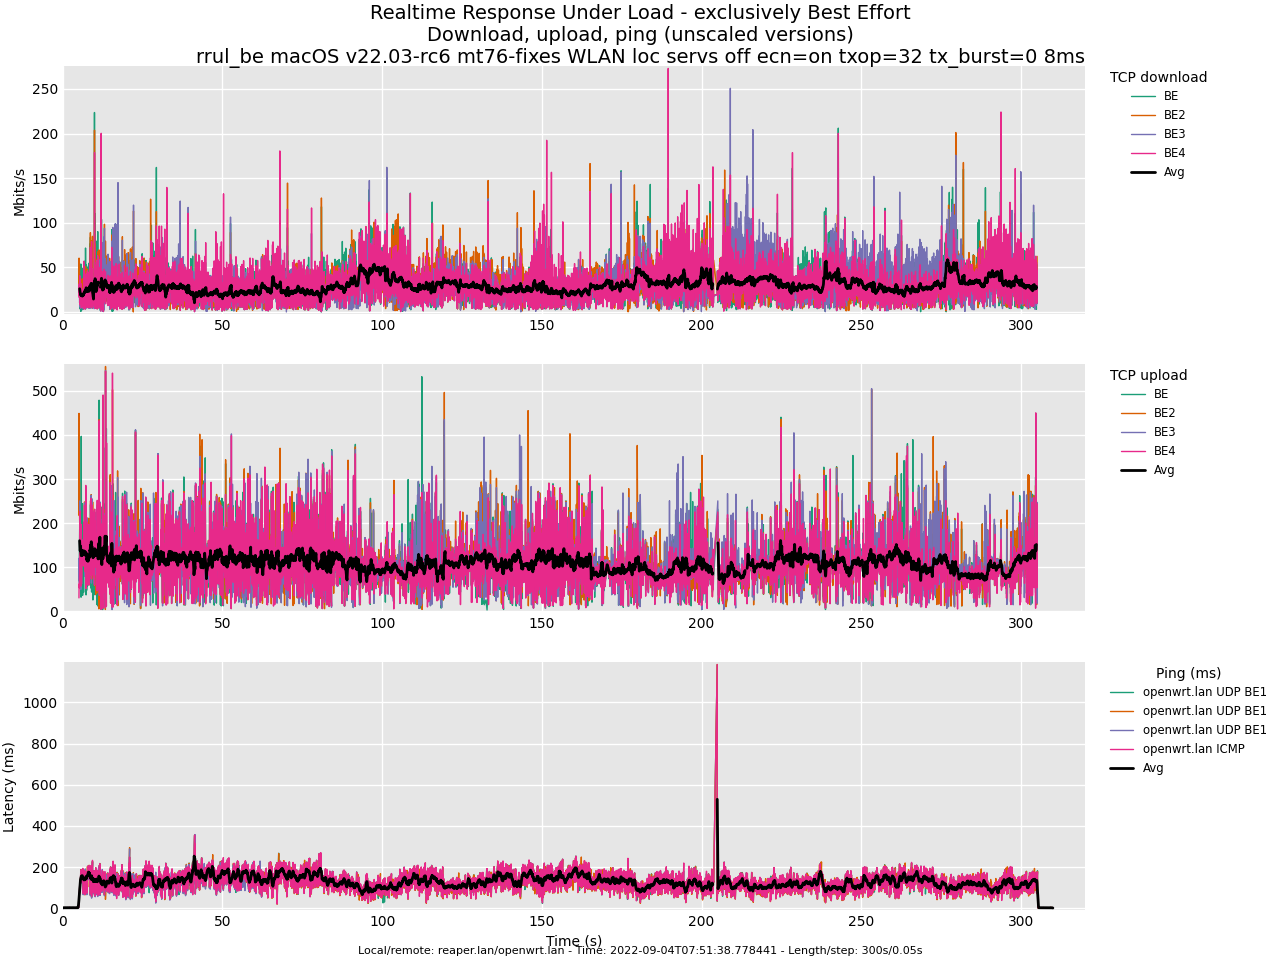
Without further ado, a flent rrul_be test with 300 s duration follows:
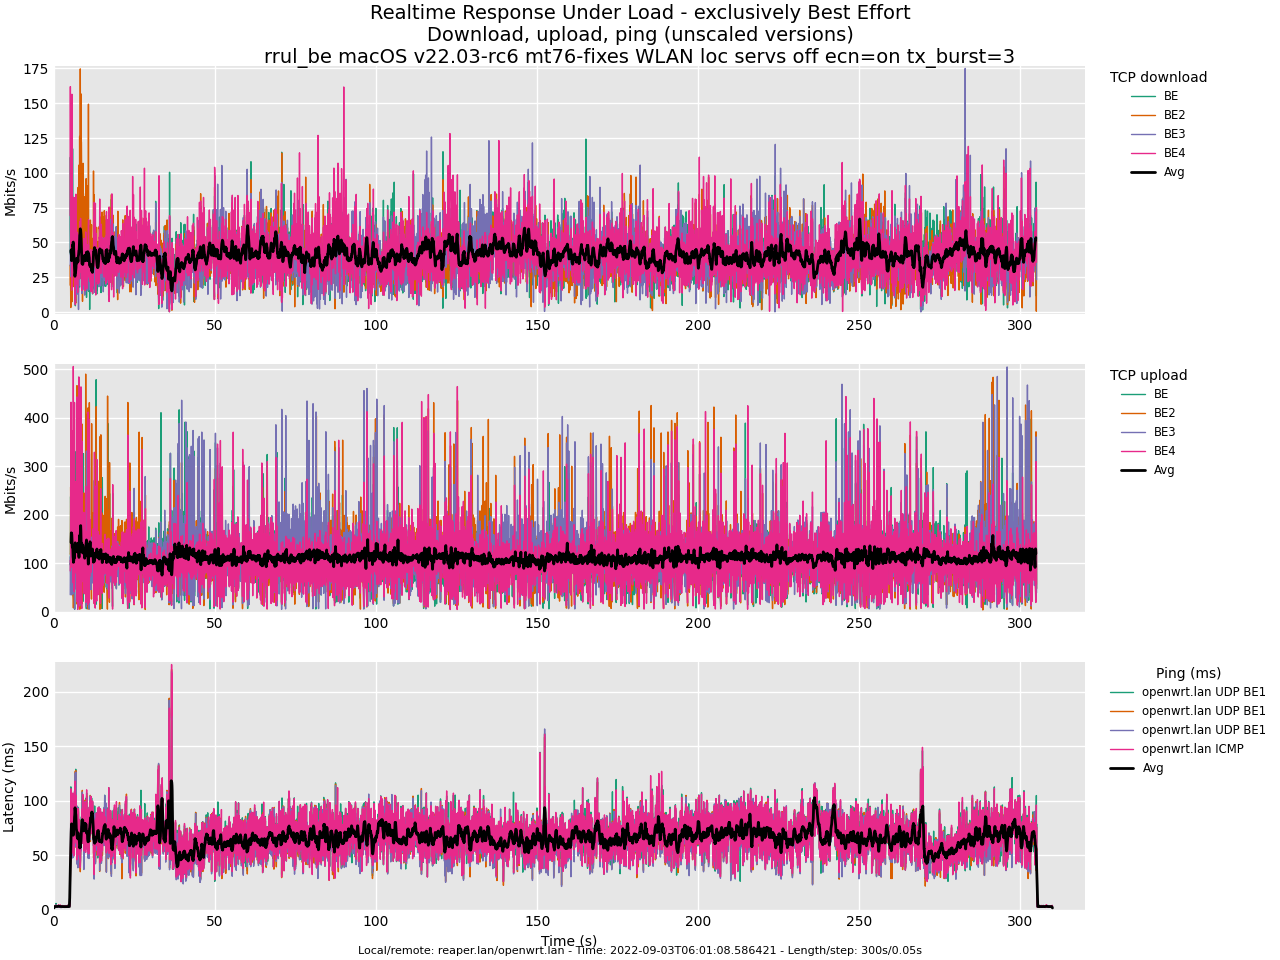
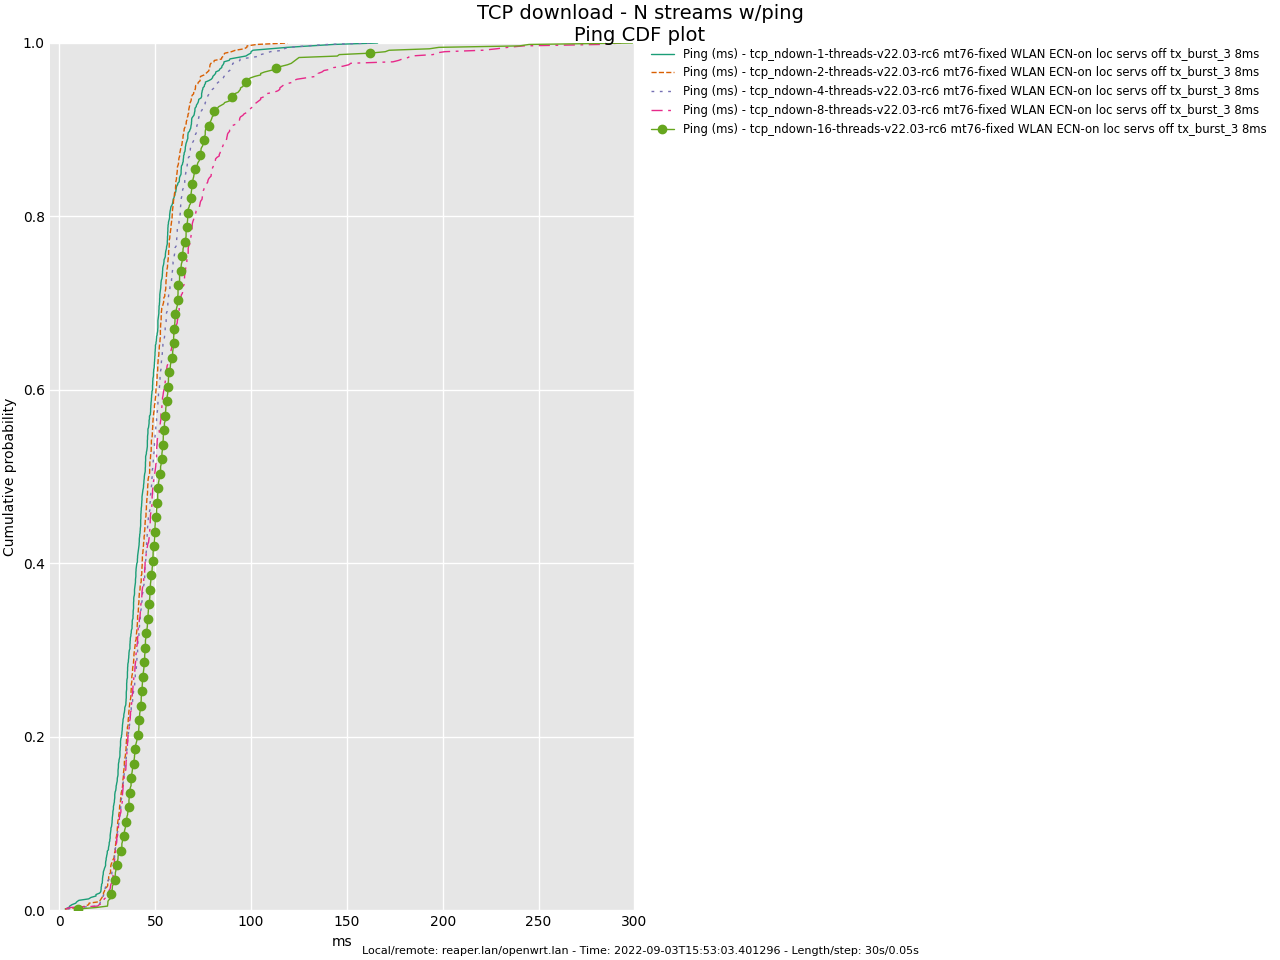
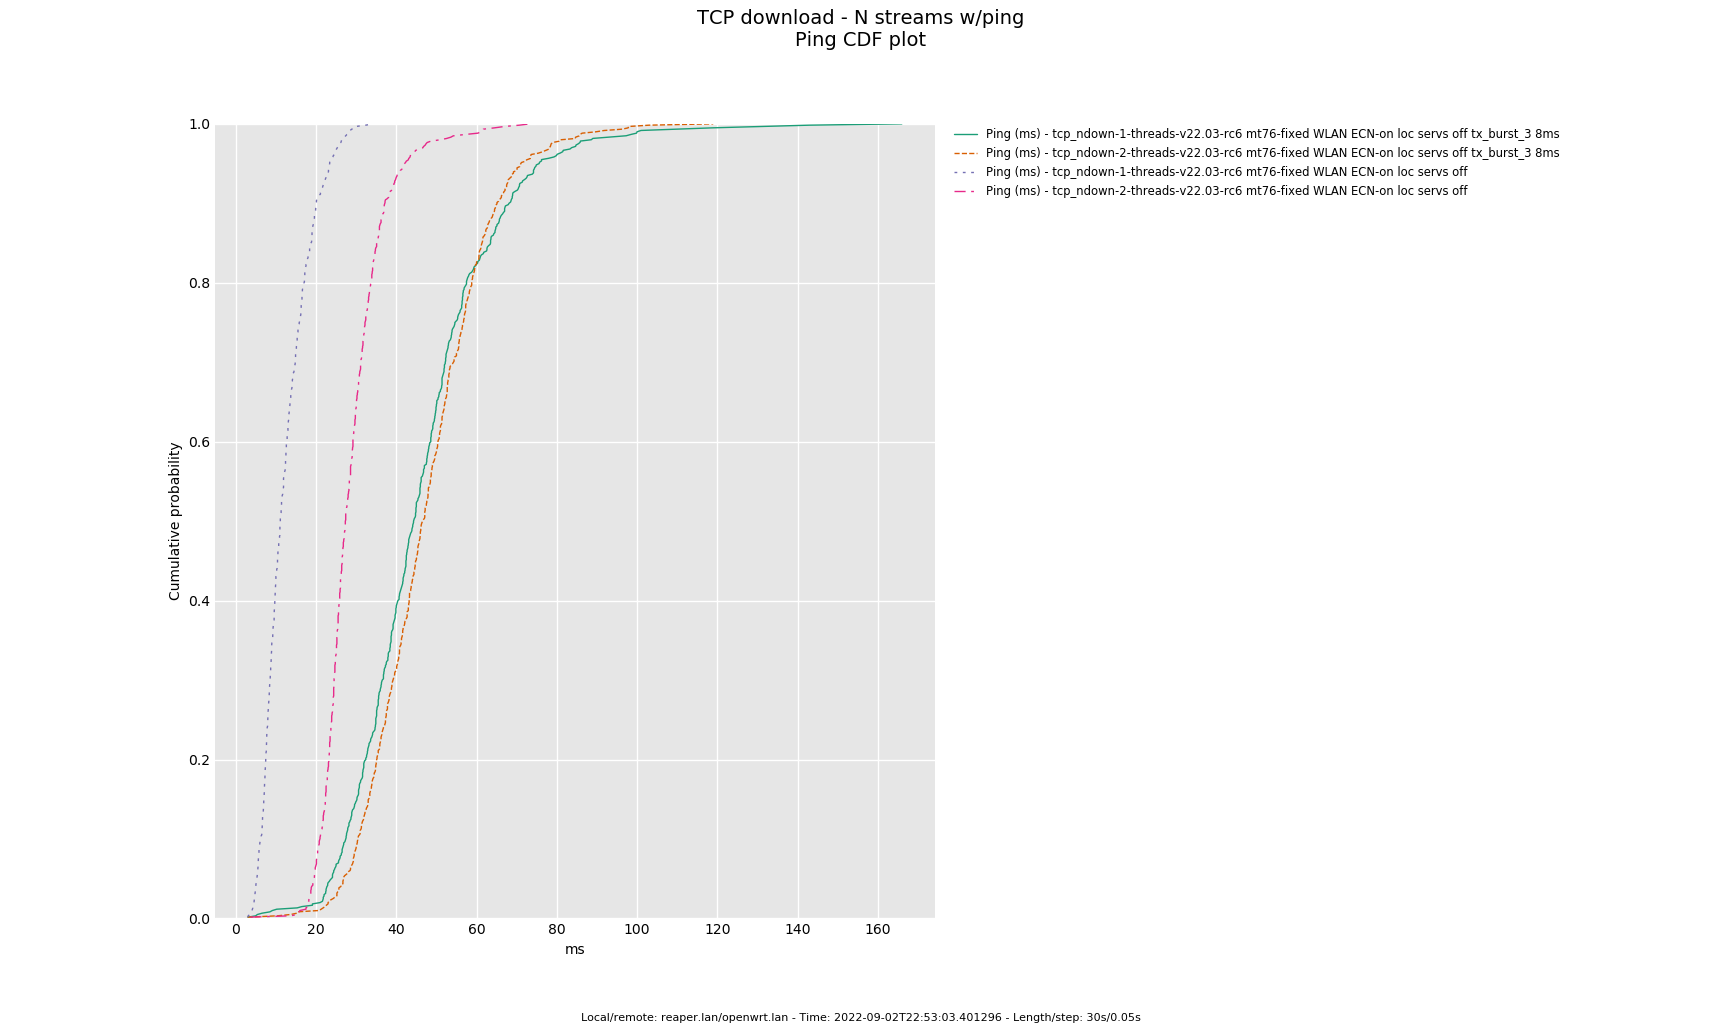
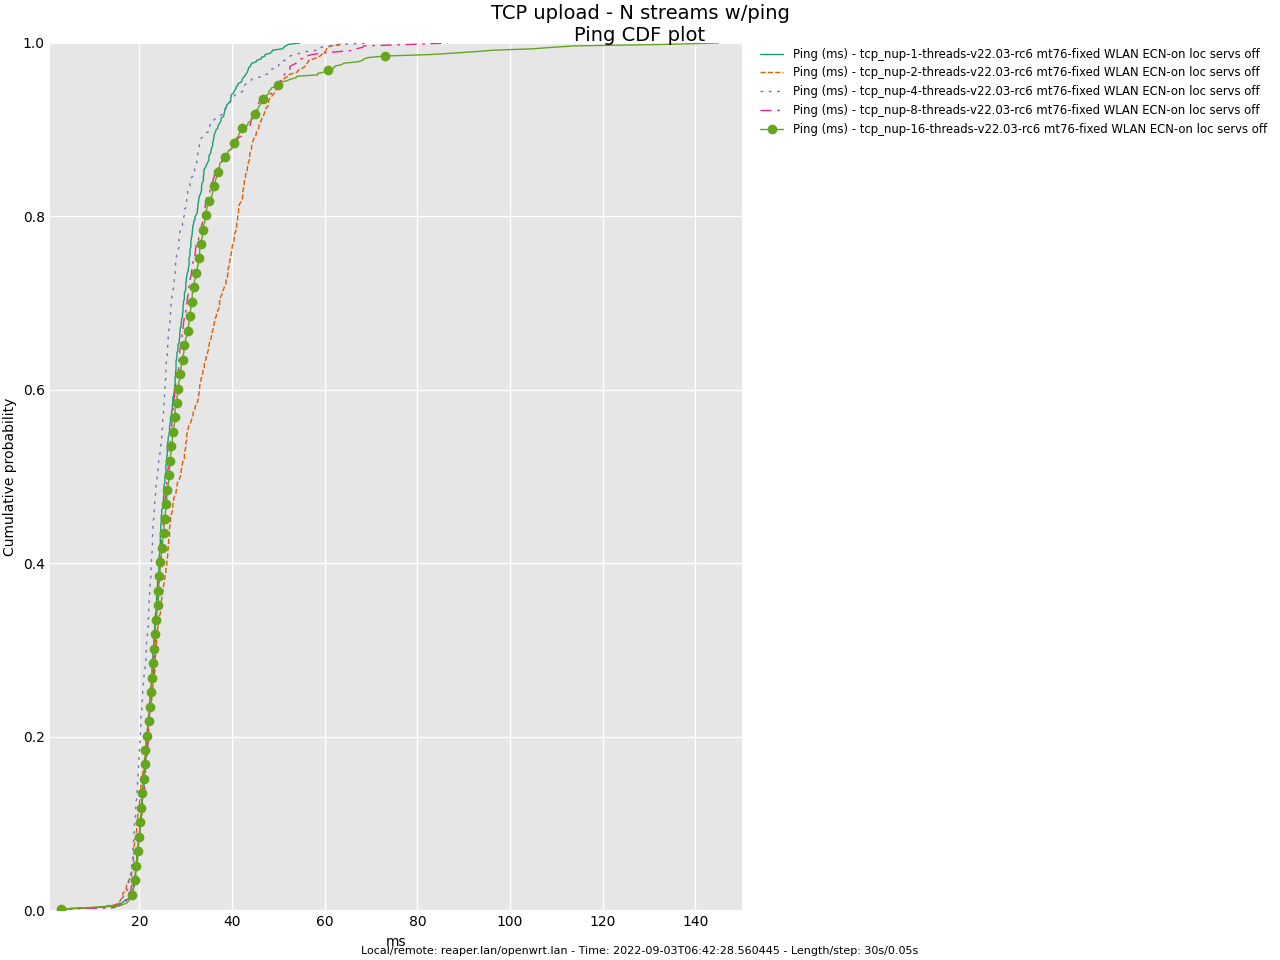
Following, you can see TCP download and upload ping tests results:
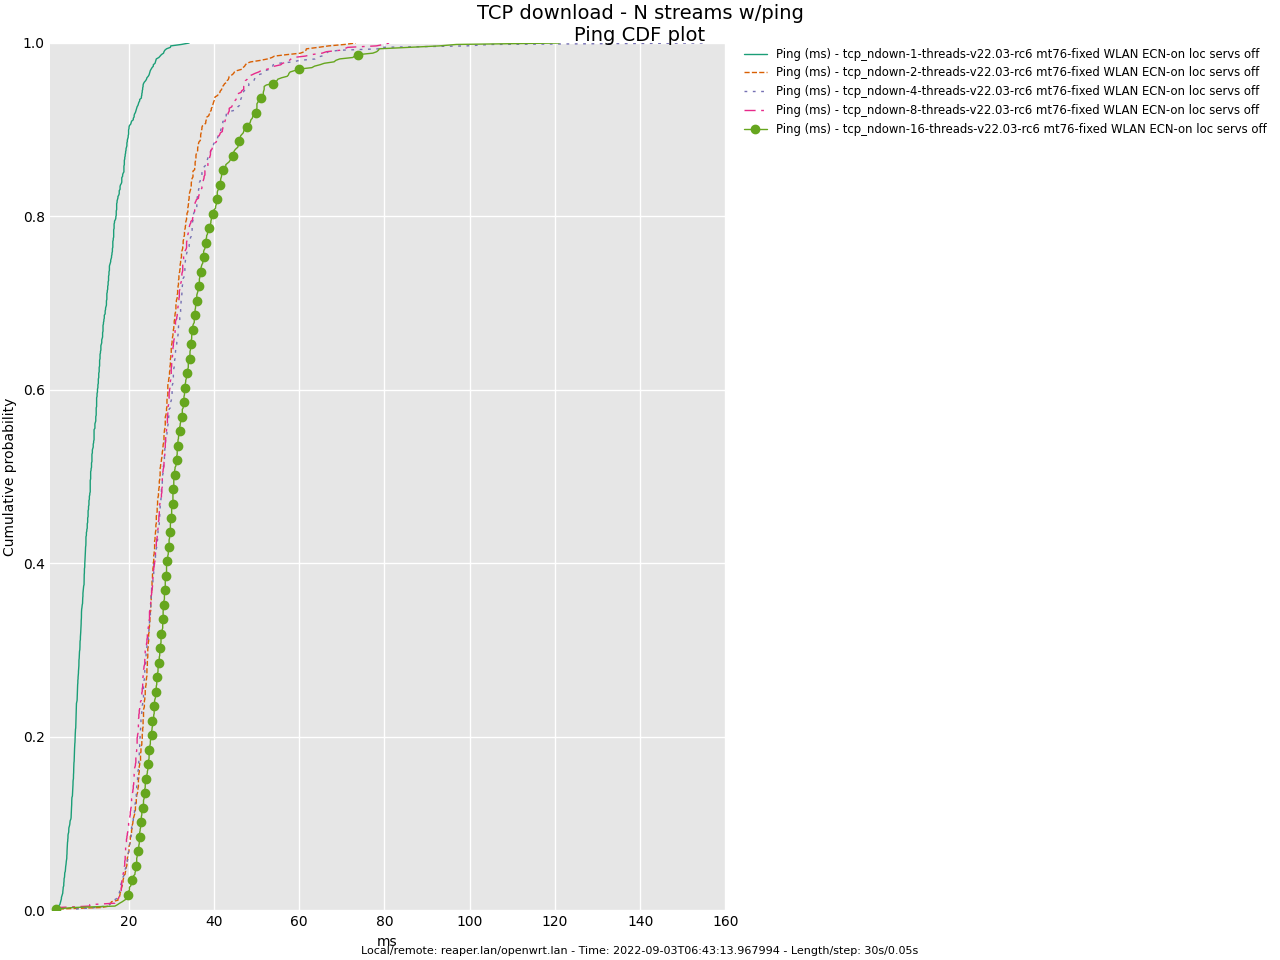
- Note: I redid this test 3 times, and on all occasions, I found that a 1-threaded download provides better ping values. Not sure if this is a glitch.
And, just for completeness I did an iperf -c openwrt.lan -e -z --bounceback test:
------------------------------------------------------------
Client connecting to openwrt.lan, TCP port 5001 with pid 67119 (1 flows)
Write buffer size:  100 Byte
Bursting:  100 Byte writes 10 times every 1.00 second(s)
Bounce-back test (size= 100 Byte) (server hold req=0 usecs)
TOS set to 0x0 and nodelay (Nagle off)
TCP window size:  128 KByte (default)
------------------------------------------------------------
[  1] local 192.168.1.151%en0 port 54280 connected with 192.168.1.1 port 5001 (bb len/hold=100/0) (sock=5) (icwnd/mss/irtt=11/1448/3000) (ct=2.65 ms) on 2022-09-03 06:08:14 (AEST)
[ ID] Interval            Transfer    Bandwidth         BB cnt=avg/min/max/stdev         Rtry  Cwnd/RTT    RPS
[  1] 0.0000-1.0000 sec  1.95 KBytes  16.0 Kbits/sec    10=2.856/2.425/3.961/0.514 ms    0   12K/3000 us    350 rps
[  1] 1.0000-2.0000 sec  1.95 KBytes  16.0 Kbits/sec    10=2.794/2.447/3.750/0.380 ms    0   13K/3000 us    358 rps
[  1] 2.0000-3.0000 sec  1.95 KBytes  16.0 Kbits/sec    10=3.052/2.482/6.341/1.184 ms    0   14K/3000 us    328 rps
[  1] 3.0000-4.0000 sec  1.95 KBytes  16.0 Kbits/sec    10=2.854/2.510/4.140/0.531 ms    0   15K/2000 us    350 rps
[  1] 4.0000-5.0000 sec  1.95 KBytes  16.0 Kbits/sec    10=2.887/2.314/4.334/0.644 ms    0   16K/3000 us    346 rps
[  1] 5.0000-6.0000 sec  1.95 KBytes  16.0 Kbits/sec    10=3.175/2.522/7.153/1.435 ms    0   17K/3000 us    315 rps
[  1] 6.0000-7.0000 sec  1.95 KBytes  16.0 Kbits/sec    10=2.731/2.522/3.877/0.413 ms    0   18K/2000 us    366 rps
[  1] 7.0000-8.0000 sec  1.95 KBytes  16.0 Kbits/sec    10=2.718/2.537/3.785/0.378 ms    0   19K/3000 us    368 rps
[  1] 8.0000-9.0000 sec  1.95 KBytes  16.0 Kbits/sec    10=3.759/2.534/5.029/0.971 ms    0   20K/3000 us    266 rps
[  1] 9.0000-10.0000 sec  1.95 KBytes  16.0 Kbits/sec    10=3.208/2.517/7.084/1.401 ms    0   21K/3000 us    312 rps
[  1] 0.0000-10.0222 sec  19.7 KBytes  16.1 Kbits/sec    101=3.039/2.314/7.153/0.958 ms    0   21K/12000 us    329 rps
[  1] 0.0000-10.0222 sec BB8-PDF: bin(w=100us):cnt(101)=24:1,25:5,26:31,27:25,28:10,29:4,30:2,31:1,34:1,35:1,37:3,38:3,39:2,40:1,42:2,43:1,44:1,46:1,50:1,51:1,64:1,66:1,71:1,72:1 (5.00/95.00/99.7%=25/50/72,Outliers=0,obl/obu=0/0)
Following, you can find the link to the usual flent data files. Would you be so kind as to render the ping_cdf graph yourself? I'm not very confident my matlib is working correctly.
I want someone else with an mt76 device to perform these tests. I keep seeing a difference between 15 MiB/s and 20 MiB/s comparing upload and download bandwidth.