AQL and the ath10k is *lovely*

@uniqe13 @anon98444528 @amteza @ka2107 @nbd @vochong how stable and non-crashy are we now?

Oh, I think I misread what you did. It's the non cake'd ethernet bql instances that have the high bql limit. (?)

Personally I think this is worse for the pk_delay or peak delay which should show the maximum, but due to the EWMA the true maximum during a load test will to survive until after the load test. I would actually prefer a maximum counter that destructively resets at every tc -s stat dump, but veridically collects the true maximum, same for the (maximum delay of) sparse (flows). The average delay could stay as is IMHO.

1 Like

Not for the first time, I'm missing bugzilla and redmine. A simple pre-catagory of "crash bugs" to sort through (closed and open) would be helpful.

MT76: https://github.com/openwrt/openwrt/issues?q=is%3Aissue+mt76+

1 Like

Ah damn, I posted all, the results for eth2 are

774
63315
120652
75363

I also have a few vlans (but not on eth2), that's why there were more than twelve results.

few enough people use the cake stats in the first place and I agree the actual peak and a destructive read for peak would be better! @tohojo ?

1 Like

are you just running that single instance of cake unlimited on eth2? If so, the only bql in still in use is the first one. I think.

(to be clear despite my original instructions, when I originally looked at that slice of data (with more than 4 results) I assumed it was a sampled stat, then I assumed cake was on eth0, not eth2, now I am assuming that I have brain damage from trying to absorb too many openwrt bugs and find common causes....

2 Likes

My connection stability is much better after applying the patch from link. I not I have a errors ... received unexpected tx_fetch_ind event: in push mode error and ... failed to lookup txq for peer_id x tid x... this way there is no blocked clients and no degradation of wifi (or I don't see it yet... :grin:).

Some black magic bottom...

 -----------------------------------------------------
 OpenWrt SNAPSHOT, r19873-a703f9ed0b
 -----------------------------------------------------
root@OpenWrt:~# qosify-status
===== interface WAN_4: active =====
egress status:
qdisc cake 8009: root refcnt 2 bandwidth 25Mbit diffserv4 dual-srchost nat wash no-ack-filter split-gso rtt 100ms noatm overhead 22
 Sent 38785242 bytes 247611 pkt (dropped 4, overlimits 17699 requeues 87)
 backlog 0b 0p requeues 87
 memory used: 54976b of 4Mb
 capacity estimate: 25Mbit
 min/max network layer size:           28 /    1500
 min/max overhead-adjusted size:       50 /    1522
 average network hdr offset:           14

                   Bulk  Best Effort        Video        Voice
  thresh       1562Kbit       25Mbit    12500Kbit     6250Kbit
  target         11.6ms          5ms          5ms          5ms
  interval        107ms        100ms        100ms        100ms
  pk_delay        510us       2.03ms        381us        141us
  av_delay         60us        262us         73us         45us
  sp_delay         37us         41us         22us         29us
  backlog            0b           0b           0b           0b
  pkts             4288        87090       152029         4208
  bytes         1283265     15727473     21352923       426677
  way_inds            1           92         1139            0
  way_miss          257         2911         9072           58
  way_cols            0            0            0            0
  drops               0            2            2            0
  marks               0            0            0            0
  ack_drop            0            0            0            0
  sp_flows            0            0            1            0
  bk_flows            0            0            1            0
  un_flows            0            0            0            0
  max_len         21658        14014        21658         6370
  quantum           300          762          381          300


ingress status:
qdisc cake 800a: root refcnt 2 bandwidth 50Mbit diffserv4 dual-dsthost nat nowash ingress no-ack-filter split-gso rtt 100ms noatm overhead 22
 Sent 974951628 bytes 833995 pkt (dropped 238, overlimits 1006344 requeues 0)
 backlog 0b 0p requeues 0
 memory used: 519680b of 4Mb
 capacity estimate: 50Mbit
 min/max network layer size:           40 /    1500
 min/max overhead-adjusted size:       62 /    1522
 average network hdr offset:           14

                   Bulk  Best Effort        Video        Voice
  thresh       3125Kbit       50Mbit       25Mbit    12500Kbit
  target         5.81ms          5ms          5ms          5ms
  interval        101ms        100ms        100ms        100ms
  pk_delay       1.64ms       2.18ms        213us        182us
  av_delay       1.09ms        459us         54us         60us
  sp_delay         37us         49us         20us         29us
  backlog            0b           0b           0b           0b
  pkts            24080       745057        62926         2170
  bytes        28222530    933788563     12874075       369743
  way_inds           29          406          256            0
  way_miss          150         2809         4153           66
  way_cols            0            0            0            0
  drops               4          233            1            0
  marks               0            0            0            0
  ack_drop            0            0            0            0
  sp_flows            0            1            1            0
  bk_flows            0            0            1            0
  un_flows            0            0            0            0
  max_len          1292         1514         1514         1274
  quantum           300         1514          762          381

root@OpenWrt:~# cat /proc/interrupts
           CPU0       CPU1       CPU2       CPU3
 26:   35451638    2481881    6790946    2031982     GIC-0  20 Level     arch_timer
 28:          0          0          0          0     GIC-0  23 Level     arm-pmu
 30:      10882        630        710          0     GIC-0 270 Level     bam_dma
 31:      87376       2330       6536       6349     GIC-0 127 Level     78b5000.spi
 32:          0          0          0          0     GIC-0 239 Level     bam_dma
 33:          7          0          0          0     GIC-0 139 Level     msm_serial0
 50:       7427     114688     253923    3268218     GIC-0 200 Level     ath10k_ahb
 67:         12          0          0          0     GIC-0 201 Level     ath10k_ahb
 68:      16169      80630      88914     207935     GIC-0  97 Edge      edma_eth_tx0
 69:        124        298        405         13     GIC-0  98 Edge      edma_eth_tx1
 70:          0          0          0          0     GIC-0  99 Edge      edma_eth_tx2
 71:          0          0          0          0     GIC-0 100 Edge      edma_eth_tx3
 72:      19942      95563     169294     147461     GIC-0 101 Edge      edma_eth_tx4
 73:          2         73          6          0     GIC-0 102 Edge      edma_eth_tx5
 74:          0          0          0          0     GIC-0 103 Edge      edma_eth_tx6
 75:          0          0          0          0     GIC-0 104 Edge      edma_eth_tx7
 76:      58330     210649      95556      85852     GIC-0 105 Edge      edma_eth_tx8
 77:      10565      61151      84607      16261     GIC-0 106 Edge      edma_eth_tx9
 78:          0          0          0          0     GIC-0 107 Edge      edma_eth_tx10
 79:          0          0          0          0     GIC-0 108 Edge      edma_eth_tx11
 80:      12465     144638      68081     108108     GIC-0 109 Edge      edma_eth_tx12
 81:        147        346         58         29     GIC-0 110 Edge      edma_eth_tx13
 82:          0          0          0          0     GIC-0 111 Edge      edma_eth_tx14
 83:          0          0          0          0     GIC-0 112 Edge      edma_eth_tx15
 84:       7140      26087     119424      68167     GIC-0 272 Edge      edma_eth_rx0
 86:      17564      58185      42271      49291     GIC-0 274 Edge      edma_eth_rx2
 88:       7506      66550      57481      62441     GIC-0 276 Edge      edma_eth_rx4
 90:      16545      40751      58443      63577     GIC-0 278 Edge      edma_eth_rx6
100:          0          0          0          0     GIC-0 163 Level     qcom_dwc3 HS
101:          0          0          0          0     GIC-0 518 Level     qcom_dwc3 SS
102:          0          0          0          0     GIC-0 520 Level     qcom_dwc3 DM_HS
103:          0          0          0          0     GIC-0 521 Level     qcom_dwc3 DP_HS
104:          0          0          0          0     GIC-0 167 Level     qcom_dwc3 HS
105:          0          0          0          0     GIC-0 522 Level     qcom_dwc3 SS
106:          0          0          0          0     GIC-0 524 Level     qcom_dwc3 DM_HS
107:          0          0          0          0     GIC-0 525 Level     qcom_dwc3 DP_HS
108:          0          0          0          0   msmgpio  63 Edge      keys
109:          0          0          0          0   msmgpio   0 Edge      keys
110:     330559    1189832     582509     134859     GIC-0 164 Level     xhci-hcd:usb1
111:          0          0          0          0     GIC-0 168 Level     xhci-hcd:usb3
IPI0:          0          0          0          0  CPU wakeup interrupts
IPI1:          0          0          0          0  Timer broadcast interrupts
IPI2:       4329       6082       5443       5807  Rescheduling interrupts
IPI3:    1271857     645576     759170     528753  Function call interrupts
IPI4:          0          0          0          0  CPU stop interrupts
IPI5:     751878     343889     417044     147325  IRQ work interrupts
IPI6:          0          0          0          0  completion interrupts
Err:          0

root@OpenWrt:~# cat /sys/kernel/debug/ieee80211/phy0/netdev:wlan0/aqm
ac backlog-bytes backlog-packets new-flows drops marks overlimit collisions tx-bytes tx-packets
2 0 0 12218 0 0 0 4583 12478010 48194

root@OpenWrt:~# iperf -s
------------------------------------------------------------
Server listening on TCP port 5001
TCP window size:  128 KByte (default)
------------------------------------------------------------
[  1] local 192.168.1.1 port 5001 connected with 192.168.1.192 port 52612
[ ID] Interval       Transfer     Bandwidth
[  1] 0.00-10.11 sec  85.9 MBytes  71.3 Mbits/sec

^Croot@OpenWrt:~#

speedtest.net is not good a today ;), 15-20Mbps on RJ45 and about 15-18 wireless of 2.4GHz...
but was a days in this week when was it ethernet=wireless of 2.4GHz in near (to 45-46Mbps) and 18-24Mbps in far distance... Pings are better than without AQL patch but sometimes they still jump a little (but unfortunately my connection to Internet is LTE still...)

There are still bugs...

[99546.844452] usb usb2-port1: Cannot enable. Maybe the USB cable is bad?
[155569.299402] ess_edma c080000.edma: IPv6 not supported
[166998.297360] ess_edma c080000.edma: IPv6 not supported
[167669.746779] hrtimer: interrupt took 28354 ns

but what I see are not dangerous for me

Sorry for the confusion, here is the full output of tc -s qdisc show but not during the test.

tc -s qdisc show
qdisc noqueue 0: dev lo root refcnt 2 
 Sent 0 bytes 0 pkt (dropped 0, overlimits 0 requeues 0) 
 backlog 0b 0p requeues 0
qdisc mq 0: dev eth0 root 
 Sent 54848637 bytes 402962 pkt (dropped 0, overlimits 0 requeues 42) 
 backlog 0b 0p requeues 42
qdisc fq_codel 0: dev eth0 parent :4 limit 10240p flows 1024 quantum 1514 target 5ms interval 100ms memory_limit 32Mb ecn drop_batch 64 
 Sent 11563210 bytes 92523 pkt (dropped 0, overlimits 0 requeues 7) 
 backlog 0b 0p requeues 7
  maxpacket 74 drop_overlimit 0 new_flow_count 3 ecn_mark 0
  new_flows_len 0 old_flows_len 0
qdisc fq_codel 0: dev eth0 parent :3 limit 10240p flows 1024 quantum 1514 target 5ms interval 100ms memory_limit 32Mb ecn drop_batch 64 
 Sent 11800636 bytes 97842 pkt (dropped 0, overlimits 0 requeues 6) 
 backlog 0b 0p requeues 6
  maxpacket 94 drop_overlimit 0 new_flow_count 5 ecn_mark 0
  new_flows_len 0 old_flows_len 0
qdisc fq_codel 0: dev eth0 parent :2 limit 10240p flows 1024 quantum 1514 target 5ms interval 100ms memory_limit 32Mb ecn drop_batch 64 
 Sent 17824927 bytes 100687 pkt (dropped 0, overlimits 0 requeues 10) 
 backlog 0b 0p requeues 10
  maxpacket 94 drop_overlimit 0 new_flow_count 4 ecn_mark 0
  new_flows_len 0 old_flows_len 0
qdisc fq_codel 0: dev eth0 parent :1 limit 10240p flows 1024 quantum 1514 target 5ms interval 100ms memory_limit 32Mb ecn drop_batch 64 
 Sent 13659864 bytes 111910 pkt (dropped 0, overlimits 0 requeues 19) 
 backlog 0b 0p requeues 19
  maxpacket 195 drop_overlimit 0 new_flow_count 9 ecn_mark 0
  new_flows_len 0 old_flows_len 0
qdisc cake 8003: dev eth1 root refcnt 9 bandwidth unlimited diffserv4 triple-isolate nat wash no-ack-filter split-gso rtt 100ms noatm overhead 38 mpu 84 
 Sent 1568006804 bytes 1156756 pkt (dropped 0, overlimits 0 requeues 28) 
 backlog 0b 0p requeues 28
 memory used: 13640b of 15140Kb
 capacity estimate: 0bit
 min/max network layer size:           28 /    1500
 min/max overhead-adjusted size:       84 /    1538
 average network hdr offset:           14

                   Bulk  Best Effort        Video        Voice
  thresh           0bit         0bit         0bit         0bit
  target            5ms          5ms          5ms          5ms
  interval        100ms        100ms        100ms        100ms
  pk_delay          0us          9us         26us         15us
  av_delay          0us          4us         14us         12us
  sp_delay          0us          3us          7us          7us
  backlog            0b           0b           0b           0b
  pkts                0      1153176          552         3028
  bytes               0   1567773588        85468       147748
  way_inds            0        10534            0            0
  way_miss            0        11003            5           25
  way_cols            0            0            0            0
  drops               0            0            0            0
  marks               0            0            0            0
  ack_drop            0            0            0            0
  sp_flows            0            0            1            0
  bk_flows            0            0            0            0
  un_flows            0            0            0            0
  max_len             0         7570          750         1462
  quantum          1514         1514         1514         1514

qdisc cake 8004: dev eth2 root refcnt 9 bandwidth unlimited diffserv4 triple-isolate nat wash no-ack-filter split-gso rtt 100ms noatm overhead 38 mpu 84 
 Sent 1686662 bytes 12848 pkt (dropped 0, overlimits 0 requeues 5) 
 backlog 0b 0p requeues 5
 memory used: 4608b of 15140Kb
 capacity estimate: 0bit
 min/max network layer size:           28 /    1500
 min/max overhead-adjusted size:       84 /    1538
 average network hdr offset:           14

                   Bulk  Best Effort        Video        Voice
  thresh           0bit         0bit         0bit         0bit
  target            5ms          5ms          5ms          5ms
  interval        100ms        100ms        100ms        100ms
  pk_delay          0us         23us         27us         27us
  av_delay          0us         11us          0us         12us
  sp_delay          0us          5us          0us          6us
  backlog            0b           0b           0b           0b
  pkts                0         9986            8         2854
  bytes               0      1560970         2626       123066
  way_inds            0            1            0            0
  way_miss            0          958            1            6
  way_cols            0            0            0            0
  drops               0            0            0            0
  marks               0            0            0            0
  ack_drop            0            0            0            0
  sp_flows            0            2            0            1
  bk_flows            0            0            0            0
  un_flows            0            0            0            0
  max_len             0         1514          336          345
  quantum          1514         1514         1514         1514

qdisc noqueue 0: dev eth1.1 root refcnt 2 
 Sent 0 bytes 0 pkt (dropped 0, overlimits 0 requeues 0) 
 backlog 0b 0p requeues 0
qdisc noqueue 0: dev eth1.20 root refcnt 2 
 Sent 0 bytes 0 pkt (dropped 0, overlimits 0 requeues 0) 
 backlog 0b 0p requeues 0
qdisc noqueue 0: dev br-lan root refcnt 2 
 Sent 0 bytes 0 pkt (dropped 0, overlimits 0 requeues 0) 
 backlog 0b 0p requeues 0
qdisc noqueue 0: dev wg root refcnt 2 
 Sent 0 bytes 0 pkt (dropped 0, overlimits 0 requeues 0) 
 backlog 0b 0p requeues 0
qdisc noqueue 0: dev eth0.7 root refcnt 2 
 Sent 0 bytes 0 pkt (dropped 0, overlimits 0 requeues 0) 
 backlog 0b 0p requeues 0
qdisc cake 8013: dev pppoe-wan root refcnt 2 bandwidth 10Mbit diffserv3 triple-isolate nonat nowash no-ack-filter split-gso rtt 100ms noatm overhead 34 
 Sent 27636518 bytes 220627 pkt (dropped 5, overlimits 160897 requeues 0) 
 backlog 0b 0p requeues 0
 memory used: 126720b of 4Mb
 capacity estimate: 10Mbit
 min/max network layer size:           30 /    1492
 min/max overhead-adjusted size:       64 /    1526
 average network hdr offset:            0

                   Bulk  Best Effort        Voice
  thresh        625Kbit       10Mbit     2500Kbit
  target         29.1ms          5ms       7.27ms
  interval        124ms        100ms        102ms
  pk_delay          0us       4.61ms        471us
  av_delay          0us        148us        102us
  sp_delay          0us         16us          6us
  backlog            0b           0b           0b
  pkts                0       220206          426
  bytes               0     27574516        67818
  way_inds            0          617            0
  way_miss            0         5972           46
  way_cols            0            0            0
  drops               0            5            0
  marks               0            0            0
  ack_drop            0            0            0
  sp_flows            0            1            1
  bk_flows            0            1            0
  un_flows            0            0            0
  max_len             0         4476          576
  quantum           300          305          300

qdisc ingress ffff: dev pppoe-wan parent ffff:fff1 ---------------- 
 Sent 898676224 bytes 636865 pkt (dropped 0, overlimits 0 requeues 0) 
 backlog 0b 0p requeues 0
qdisc cake 8014: dev ifb4pppoe-wan root refcnt 2 bandwidth 54Mbit besteffort triple-isolate nonat wash no-ack-filter split-gso rtt 100ms noatm overhead 34 
 Sent 897786029 bytes 636265 pkt (dropped 600, overlimits 1151875 requeues 0) 
 backlog 0b 0p requeues 0
 memory used: 705024b of 4Mb
 capacity estimate: 54Mbit
 min/max network layer size:           28 /    1492
 min/max overhead-adjusted size:       62 /    1526
 average network hdr offset:            0

                  Tin 0
  thresh         54Mbit
  target            5ms
  interval        100ms
  pk_delay       1.55ms
  av_delay        865us
  sp_delay          9us
  backlog            0b
  pkts           636865
  bytes       898676224
  way_inds         8989
  way_miss         7375
  way_cols            0
  drops             600
  marks               0
  ack_drop            0
  sp_flows            1
  bk_flows            1
  un_flows            0
  max_len          1492
  quantum          1514

eth0 is left unchanged, eth1+2 both have a single cake instance. The Performance test always ran on eth2.

Hi,

@dtaht, I just compiled version v22.03.0-rc5 (Unifi NanoHD / mt76) removing two patches as per @nbd request:

334-mac80211-add-a-per-PHY-AQL-limit-to-improve-fairness.patch
335-mac80211-add-debugfs-file-to-display-per-phy-AQL-pen.patch

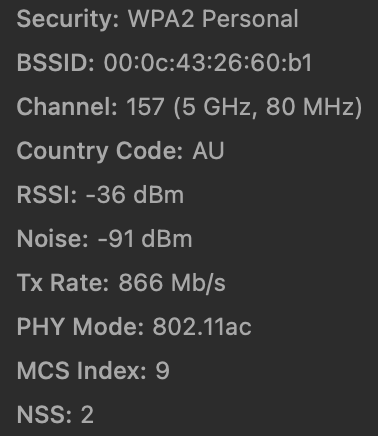
Same scenario, my devices are idle except this macOS (Silicon 2x2 MIMO), awdl0 down (to avoid periodic scanning):

@reaper$ ➜  ~ ifconfig awdl0
awdl0: flags=8902<BROADCAST,PROMISC,SIMPLEX,MULTICAST> mtu 1500
	options=400<CHANNEL_IO>
	ether 76:60:97:60:8b:ee
	nd6 options=201<PERFORMNUD,DAD>
	media: autoselect
	status: inactive

Good WiFi connectivity:
image

Good ping:

PING openwrt.lan (192.168.1.1): 56 data bytes
64 bytes from 192.168.1.1: icmp_seq=0 ttl=64 time=3.276 ms
64 bytes from 192.168.1.1: icmp_seq=1 ttl=64 time=6.343 ms
64 bytes from 192.168.1.1: icmp_seq=2 ttl=64 time=6.214 ms
64 bytes from 192.168.1.1: icmp_seq=3 ttl=64 time=3.049 ms
64 bytes from 192.168.1.1: icmp_seq=4 ttl=64 time=6.681 ms
64 bytes from 192.168.1.1: icmp_seq=5 ttl=64 time=6.037 ms
64 bytes from 192.168.1.1: icmp_seq=6 ttl=64 time=7.082 ms
64 bytes from 192.168.1.1: icmp_seq=7 ttl=64 time=6.676 ms
64 bytes from 192.168.1.1: icmp_seq=8 ttl=64 time=6.314 ms
64 bytes from 192.168.1.1: icmp_seq=9 ttl=64 time=4.219 ms
64 bytes from 192.168.1.1: icmp_seq=10 ttl=64 time=6.119 ms
64 bytes from 192.168.1.1: icmp_seq=11 ttl=64 time=6.158 ms
64 bytes from 192.168.1.1: icmp_seq=12 ttl=64 time=6.185 ms
64 bytes from 192.168.1.1: icmp_seq=13 ttl=64 time=6.222 ms
64 bytes from 192.168.1.1: icmp_seq=14 ttl=64 time=6.440 ms
64 bytes from 192.168.1.1: icmp_seq=15 ttl=64 time=3.133 ms
64 bytes from 192.168.1.1: icmp_seq=16 ttl=64 time=6.351 ms
64 bytes from 192.168.1.1: icmp_seq=17 ttl=64 time=6.311 ms
64 bytes from 192.168.1.1: icmp_seq=18 ttl=64 time=6.450 ms
64 bytes from 192.168.1.1: icmp_seq=19 ttl=64 time=6.191 ms
64 bytes from 192.168.1.1: icmp_seq=20 ttl=64 time=6.340 ms
64 bytes from 192.168.1.1: icmp_seq=21 ttl=64 time=6.361 ms
64 bytes from 192.168.1.1: icmp_seq=22 ttl=64 time=3.325 ms
64 bytes from 192.168.1.1: icmp_seq=23 ttl=64 time=6.513 ms
64 bytes from 192.168.1.1: icmp_seq=24 ttl=64 time=6.335 ms
64 bytes from 192.168.1.1: icmp_seq=25 ttl=64 time=6.211 ms
64 bytes from 192.168.1.1: icmp_seq=26 ttl=64 time=7.090 ms
64 bytes from 192.168.1.1: icmp_seq=27 ttl=64 time=6.216 ms
64 bytes from 192.168.1.1: icmp_seq=28 ttl=64 time=3.363 ms
64 bytes from 192.168.1.1: icmp_seq=29 ttl=64 time=3.574 ms
64 bytes from 192.168.1.1: icmp_seq=30 ttl=64 time=6.296 ms
64 bytes from 192.168.1.1: icmp_seq=31 ttl=64 time=6.343 ms
64 bytes from 192.168.1.1: icmp_seq=32 ttl=64 time=6.414 ms
64 bytes from 192.168.1.1: icmp_seq=33 ttl=64 time=6.055 ms
64 bytes from 192.168.1.1: icmp_seq=34 ttl=64 time=6.343 ms
64 bytes from 192.168.1.1: icmp_seq=35 ttl=64 time=6.156 ms
64 bytes from 192.168.1.1: icmp_seq=36 ttl=64 time=6.307 ms
64 bytes from 192.168.1.1: icmp_seq=37 ttl=64 time=6.174 ms
64 bytes from 192.168.1.1: icmp_seq=38 ttl=64 time=6.321 ms
64 bytes from 192.168.1.1: icmp_seq=39 ttl=64 time=6.189 ms
64 bytes from 192.168.1.1: icmp_seq=40 ttl=64 time=5.814 ms
64 bytes from 192.168.1.1: icmp_seq=41 ttl=64 time=6.259 ms
64 bytes from 192.168.1.1: icmp_seq=42 ttl=64 time=6.300 ms
64 bytes from 192.168.1.1: icmp_seq=43 ttl=64 time=6.357 ms
64 bytes from 192.168.1.1: icmp_seq=44 ttl=64 time=6.473 ms
64 bytes from 192.168.1.1: icmp_seq=45 ttl=64 time=6.273 ms
64 bytes from 192.168.1.1: icmp_seq=46 ttl=64 time=6.300 ms
64 bytes from 192.168.1.1: icmp_seq=47 ttl=64 time=6.413 ms
64 bytes from 192.168.1.1: icmp_seq=48 ttl=64 time=6.139 ms
64 bytes from 192.168.1.1: icmp_seq=49 ttl=64 time=6.452 ms
64 bytes from 192.168.1.1: icmp_seq=50 ttl=64 time=6.311 ms
64 bytes from 192.168.1.1: icmp_seq=51 ttl=64 time=3.324 ms
64 bytes from 192.168.1.1: icmp_seq=52 ttl=64 time=6.395 ms
64 bytes from 192.168.1.1: icmp_seq=53 ttl=64 time=6.475 ms
64 bytes from 192.168.1.1: icmp_seq=54 ttl=64 time=6.507 ms
64 bytes from 192.168.1.1: icmp_seq=55 ttl=64 time=6.594 ms
64 bytes from 192.168.1.1: icmp_seq=56 ttl=64 time=3.588 ms
64 bytes from 192.168.1.1: icmp_seq=57 ttl=64 time=4.248 ms
64 bytes from 192.168.1.1: icmp_seq=58 ttl=64 time=6.372 ms
64 bytes from 192.168.1.1: icmp_seq=59 ttl=64 time=6.972 ms
64 bytes from 192.168.1.1: icmp_seq=60 ttl=64 time=6.401 ms
64 bytes from 192.168.1.1: icmp_seq=61 ttl=64 time=6.366 ms
64 bytes from 192.168.1.1: icmp_seq=62 ttl=64 time=5.819 ms
^C
--- openwrt.lan ping statistics ---
63 packets transmitted, 63 packets received, 0.0% packet loss
round-trip min/avg/max/stddev = 3.049/5.897/7.090/1.071 ms

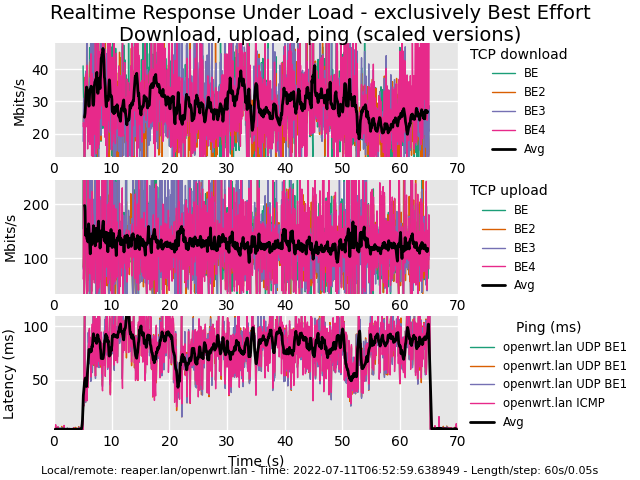
Waveform results (1000/50 cable DOCSIS 3.1 connection with SQM configured at 312/47:
image
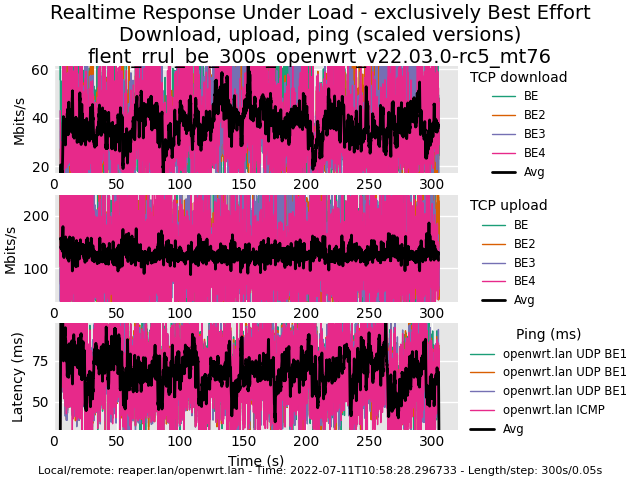
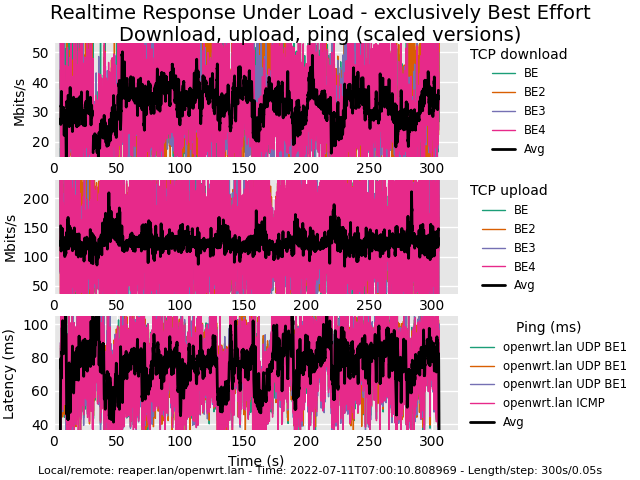
** Note: huge difference between upload and download, and bigger latency than with 22.02.1, but is it a tad more stable?

flent rrul_be -H openwrt.lan --step-size=.05 (click me to download)

And a 300 s run:
image
flent rrul_be -H openwrt.lan --step-size=.05 -l 300 (click me to download)

And just for a little more completeness, a run of Apple's tool:

@reaper$ ➜  ~ networkQuality -v
==== SUMMARY ====
Upload capacity: 31.799 Mbps
Download capacity: 229.290 Mbps
Upload flows: 20
Download flows: 12
Responsiveness: Medium (893 RPM)
Base RTT: 14
Start: 11/7/2022, 7:08:30 am
End: 11/7/2022, 7:08:45 am
OS Version: Version 12.4 (Build 21F79)

** Note: in general with version 22.02.1 I get over 3,000 RPM easy. Latency, to my understanding, stills worse after removing the patches suggested by @nbd and running v22.03.0-rc5.

And this is it. @nbd, let me know if you need me to compile something else. @dtaht, any other suggestions?

Kind regards, and apologies for taking so long Real Life TM is very demanding lately. :wink:

1 Like

LGTM +1

Looking forward to hearing back from @quarky (and others) that were experiencing latency issues either after about a 4+ day wait or intermittent latency spikes when certain devices disconnect from their AP. These make take time to report back.

thx all for jumping all over this today! I'm encouraged, and as I noted I'll settle for "stable" and "doesn't crash"! for now. Ship it, get it out the door, silence all the other bugs. Selfishly I'd like to take august off.

BUT:

It does really seem like we have something going not-so-well with download speeds, and that RPM result was poor. Not blaming this patch set and looking at other possible causes in patches elsewhere, the kernel upgrade, etc, seems sane.

@amteza A) would it be possible for you to repeat that rrul_be -l 300 result while also taking a packet capture? Ideally with ECN enabled:

sudo sysctl -w net.inet.tcp.disable_tcp_heuristics=1

An aircap is not needed, so that would be:

tcpdump -i your_interface -s 128 -w the_file.cap

B) a packet capture during a -l 60 --te=upload_streams=1 tcp_nup test

C) -l 60 --te=download_streams=1 tcp_ndown test

I don't trust osx very far and the long period latency swings you are seeing on panels 1 and 3, um... no. You can get at apple's internal fq_codel stats also, before and after the test.

netstat -I yourwifidevice -qq > somewhere.txt

2 Likes

The latest patch for mac80211 is looking good so far for my ath10k (21.02) and mt7622 (master) routers running it. No visible degradation of performance or latency from what I can remember with the pre-VTBA scheduler.

2 Likes

@dtaht, sure can.

See my /etc/sysctl.conf:

@reaper$ ➜  ~ cat /etc/sysctl.conf
net.inet.tcp.ecn_initiate_out=1
net.inet.tcp.ecn_negotiate_in=1
net.inet.tcp.disable_tcp_heuristics=1

And, confirmation of it working:

@reaper$ ➜  ~ sysctl net.inet.tcp.ecn_initiate_out
net.inet.tcp.ecn_initiate_out: 1
@reaper$ ➜  ~ sysctl net.inet.tcp.ecn_negotiate_in
net.inet.tcp.ecn_negotiate_in: 1
@reaper$ ➜  ~ sysctl net.inet.tcp.disable_tcp_heuristics
net.inet.tcp.disable_tcp_heuristics: 1

Here you go, results from A:
image

Results from B:

Summary of tcp_nup test run from 2022-07-11 01:12:41.369812
  Title: 'flent_tcp_nup_60s_openwrt_v22.03.0-rc5_mt76'

                           avg       median          # data pts
 Ping (ms) ICMP :        16.70        17.10 ms             1400
 TCP upload avg :       573.40          N/A Mbits/s        1400
 TCP upload sum :       573.40          N/A Mbits/s        1400
 TCP upload::1  :       573.40       565.19 Mbits/s        1400

Results from C:

Summary of tcp_ndown test run from 2022-07-11 01:17:06.113491
  Title: 'flent_tcp_ndown_60s_openwrt_v22.03.0-rc5_mt76'

                             avg       median          # data pts
 Ping (ms) ICMP   :        19.70        21.10 ms             1400
 TCP download avg :       503.43          N/A Mbits/s        1400
 TCP download sum :       503.43          N/A Mbits/s        1400
 TCP download::1  :       503.43       514.51 Mbits/s        1400

And, of course, all the files to download in a nice package containing all your requests (1.41 GiB in total):

Note: I still run this morning rc5 with @nbd patches removed (334, 335).

@amteza After long debugging, I finally got fping and flent working on the Macbook. I searched through Flent github issues and came across https://github.com/tohojo/flent/issues/240#issuecomment-931256026 . There's no fping6 command in macOS so I instead tried:

% fping -D -c 1 localhost
[1657503443.62438] localhost : [0], timed out (NaN avg, 100% loss)

localhost : xmt/rcv/%loss = 1/0/100%

Turns out macOS firewall has a Stealth Mode (System Preferences -> Security & Privacy -> Firewall -> Firewall Options... -> Enable Stealth Mode). That option was enabled. After disabling "Enable Stealth Mode" I confirmed fping to localhost is working:

% fping -D -c 1 localhost
[1657503635.17864] localhost : [0], 64 bytes, 0.116 ms (0.116 avg, 0% loss)

localhost : xmt/rcv/%loss = 1/1/0%, min/avg/max = 0.116/0.116/0.116

After that change, flent works.

@amteza - could you find it in your heart to repeat these tests and packet captures using 22.02.1 so we have a baseline?

1 Like

@dtaht mumbai.starlink.taht.net is not working.
Flent Log https://gist.github.com/KA2107/2f668164476e6b83ab45c17533e46379

OS: macOS 12.4 Monterey

Grump. Try just ipv4, by adding -4 to your flent command line.

Still not working.

My apologies!! That was the old cluster that I had decommissioned. I have updated both the ipv4 and ipv6 addresses for mumbai to the new cluster, but it will take a while for the dns update to propagate.

You can direct your test at mumbai.v.taht.net for now.