These are too technical for me ...
I, with more serious IT, have been out of the picture for 15 years. And personally it's programming I never suffered from-it's only now out of curiosity that I try something more. I is simple farmer (although having a degree in computer science).
In few days will compile image on 19.07 version- this worked very fine. Alternative on snapshot of 22.03. Maybe will better than now.
whilst we struggle with longitudinal data from other OSes, there's a new tool, written in rust (but it depends on a lot of c libs) for stress testing and plotting results: https://github.com/Zoxc/crusader/
Thank you for the instructions. The Macbook Air belongs to my relative and it is still working fine. However it is setup with only my relative's user account and I can only do limited stuff on it, that too via VNC since it is sitting in a different country.
It was few months before when I tried setting up Flent on it. I believe the issue was with building or installing netperf-enable-demo or fping. Unfortunately I did not store any logs so not sure what was the issue at that time.
So the way I start the flent gui on macos is by a little script:
#! /bin/sh

QT_API=pyside2 ./run-flent --gui
I do not install flent via pip, but use the run-flent script from the cloned github repository. The gui works... but currently I run into problems when trying to acquire data:
bash-3.2$ date ; ping -c 10 singapore.starlink.taht.net ; ./run-flent --ipv4 -l 60 -H singapore.starlink.taht.net rrul_var  --step-size=.05 --test-parameter bidir_streams=8 --test-parameter markings=0,0,0,0,0,0,0,0 --test-parameter ping_hosts=1.1.1.1 -D . -t IPv4_work_mbpro_thunderbolt_ethernet_2_singapore.starlink.taht.net --log-file
Sat Jul  2 11:27:32 CEST 2022
PING singapore.starlink.taht.net (172.105.113.30): 56 data bytes
64 bytes from 172.105.113.30: icmp_seq=0 ttl=46 time=292.928 ms
64 bytes from 172.105.113.30: icmp_seq=1 ttl=46 time=284.487 ms
64 bytes from 172.105.113.30: icmp_seq=2 ttl=46 time=284.738 ms
64 bytes from 172.105.113.30: icmp_seq=3 ttl=46 time=284.281 ms
64 bytes from 172.105.113.30: icmp_seq=4 ttl=46 time=291.311 ms
64 bytes from 172.105.113.30: icmp_seq=5 ttl=46 time=283.758 ms
64 bytes from 172.105.113.30: icmp_seq=6 ttl=46 time=284.761 ms
64 bytes from 172.105.113.30: icmp_seq=7 ttl=46 time=284.233 ms
64 bytes from 172.105.113.30: icmp_seq=8 ttl=46 time=284.337 ms
64 bytes from 172.105.113.30: icmp_seq=9 ttl=46 time=284.429 ms

--- singapore.starlink.taht.net ping statistics ---
10 packets transmitted, 10 packets received, 0.0% packet loss
round-trip min/avg/max/stddev = 283.758/285.926/292.928/3.129 ms
Starting Flent 2.0.1-git-7b14d50 using Python 3.9.13.
Starting rrul_var test. Expected run time: 70 seconds.
Exception ignored in: <function RunnerBase.__del__ at 0x108639790>
Traceback (most recent call last):
  File "/Users/Shared/space/data_local/moeller/PRIVATE/samba/privat/MOEWE/techno_kram/CODE/flent/flent/runners.py", line 205, in __del__
    self.close()
  File "/Users/Shared/space/data_local/moeller/PRIVATE/samba/privat/MOEWE/techno_kram/CODE/flent/flent/runners.py", line 282, in close
    if self.stdout is not None:
AttributeError: 'IrttRunner' object has no attribute 'stdout'
Exception ignored in: <function RunnerBase.__del__ at 0x10a35d790>
Traceback (most recent call last):
  File "/Users/Shared/space/data_local/moeller/PRIVATE/samba/privat/MOEWE/techno_kram/CODE/flent/flent/runners.py", line 205, in __del__
    self.close()
  File "/Users/Shared/space/data_local/moeller/PRIVATE/samba/privat/MOEWE/techno_kram/CODE/flent/flent/runners.py", line 282, in close
    if self.stdout is not None:
AttributeError: 'NetperfDemoRunner' object has no attribute 'stdout'
Exception ignored in: <function RunnerBase.__del__ at 0x10882b790>
Traceback (most recent call last):
  File "/Users/Shared/space/data_local/moeller/PRIVATE/samba/privat/MOEWE/techno_kram/CODE/flent/flent/runners.py", line 205, in __del__
    self.close()
  File "/Users/Shared/space/data_local/moeller/PRIVATE/samba/privat/MOEWE/techno_kram/CODE/flent/flent/runners.py", line 282, in close
    if self.stdout is not None:
AttributeError: 'NetperfDemoRunner' object has no attribute 'stdout'
Exception ignored in: <function RunnerBase.__del__ at 0x111581790>
Traceback (most recent call last):
  File "/Users/Shared/space/data_local/moeller/PRIVATE/samba/privat/MOEWE/techno_kram/CODE/flent/flent/runners.py", line 205, in __del__
    self.close()
  File "/Users/Shared/space/data_local/moeller/PRIVATE/samba/privat/MOEWE/techno_kram/CODE/flent/flent/runners.py", line 282, in close
    if self.stdout is not None:
AttributeError: 'NetperfDemoRunner' object has no attribute 'stdout'
^CProcess SpawnPoolWorker-10:

/usr/local/Cellar/python@3.9/3.9.13_1/Frameworks/Python.framework/Versions/3.9/lib/python3.9/multiprocessing/resource_tracker.py:216: UserWarning: resource_tracker: There appear to be 6 leaked semaphore objects to clean up at shutdown
  warnings.warn('resource_tracker: There appear to be %d '
I also opened an issue in the flent issue tracker....
When stress testing wifi against a server in the cloud, and your bandwidth to/from the cloud is less than your minimum achievable wifi rate, you are testing the cloud more than the wifi. Testing underloaded wifi is still valuable, btw, if you are experiencing dropouts, etc, but flood/stress testing it at an artificially low bitrate is a useful test of the fq, and codel code, as well as ATF if you are doing multiple station tests.
the highest rates like mcs-15 would have a tendency towards extreme flakyness, and it was always good to compare the highest rates against what the minstrel rate controller was detecting and achieving, as well as taking aircaps.
So many variables! so many chipsets! so little time, so little:
Ah, sorry this test was just to show the issues on macosx, and not related to the main thread. My current router uses neither AQL nor ATF, yet so I can not really contribute. Bowing out....
EDIT: With "bowing out..." I just want to say I stop my little flent on macosx subthread since that was off-topic....
% flent rrul_be -p all_scaled -l 60 -H netperf-eu.bufferbloat.net -o filename.png --debug-error -v
Starting Flent 2.0.1 using Python 3.9.13.
Executing test environment file /usr/local/lib/python3.9/site-packages/flent/tests/rrul_be.conf
Looking up hostname 'netperf-eu.bufferbloat.net'.
Executing test environment file /usr/local/lib/python3.9/site-packages/flent/tests/rrul_be.conf
Gathering local metadata
Executing 'uname -s' on localhost
Executing 'uname -r' on localhost
Executing 'find /sys/module -name .note.gnu.build-id' on localhost
Executing 'sysctl -e net.core.rmem_max net.core.wmem_max net.ipv4.tcp_autocorking net.ipv4.tcp_early_retrans net.ipv4.tcp_ecn net.ipv4.tcp_pacing_ca_ratio net.ipv4.tcp_pacing_ss_ratio net.ipv4.tcp_dsack net.ipv4.tcp_fack net.ipv4.tcp_sack net.ipv4.tcp_fastopen net.ipv4.tcp_syncookies net.ipv4.tcp_window_scaling net.ipv4.tcp_notsent_lowat net.ipv4.tcp_limit_output_bytes net.ipv4.tcp_timestamps net.ipv4.tcp_congestion_control net.ipv4.tcp_allowed_congestion_control net.ipv4.tcp_available_congestion_control net.ipv4.tcp_mem net.ipv4.tcp_rmem net.ipv4.tcp_wmem net.ipv4.tcp_moderate_rcvbuf net.ipv4.tcp_no_metrics_save' on localhost
Looking up hostname 'netperf-eu.bufferbloat.net'.
Executing 'ip route get 193.10.227.30' on localhost
Executing 'route -n get 193.10.227.30' on localhost
Executing 'tc qdisc show dev en0' on localhost
Executing 'tc -s qdisc show dev en0' on localhost
Executing 'tc class show dev en0' on localhost
Executing 'ethtool -k en0' on localhost
Executing 'for i in /sys/class/net/en0/queues/tx-*; do [ -d $i/byte_queue_limits ] && echo -n "$(basename $i) " && cat $i/byte_queue_limits/limit_max; done' on localhost
Executing 'basename $(readlink /sys/class/net/en0/device/driver)' on localhost
Executing 'ip link show dev en0' on localhost
Executing 'ifconfig en0' on localhost
Executing 'ethtool en0' on localhost
Starting rrul_be test. Expected run time: 70 seconds.
which: Found netperf executable at /usr/local/bin/netperf
which: Found netperf executable at /usr/local/bin/netperf
which: Found netperf executable at /usr/local/bin/netperf
which: Found netperf executable at /usr/local/bin/netperf
which: Found netperf executable at /usr/local/bin/netperf
which: Found netperf executable at /usr/local/bin/netperf
which: Found netperf executable at /usr/local/bin/netperf
which: Found netperf executable at /usr/local/bin/netperf
Ping (ms) UDP BE1: Adding child IrttRunner
which: /usr/local/bin/irtt is not an executable file
which: /usr/bin/irtt is not an executable file
which: /bin/irtt is not an executable file
which: /usr/sbin/irtt is not an executable file
which: /sbin/irtt is not an executable file
which: /usr/local/share/dotnet/irtt is not an executable file
UDP RTT test: Cannot use irtt runner (No irtt binary found in PATH.). Using netperf UDP_RR
Ping (ms) UDP BE1: Adding child NetperfDemoRunner
which: Found netperf executable at /usr/local/bin/netperf
Ping (ms) UDP BE2: Adding child IrttRunner
which: /usr/local/bin/irtt is not an executable file
which: /usr/bin/irtt is not an executable file
which: /bin/irtt is not an executable file
which: /usr/sbin/irtt is not an executable file
which: /sbin/irtt is not an executable file
which: /usr/local/share/dotnet/irtt is not an executable file
UDP RTT test: Cannot use irtt runner (No irtt binary found in PATH.). Using netperf UDP_RR
Ping (ms) UDP BE2: Adding child NetperfDemoRunner
which: Found netperf executable at /usr/local/bin/netperf
Ping (ms) UDP BE3: Adding child IrttRunner
which: /usr/local/bin/irtt is not an executable file
which: /usr/bin/irtt is not an executable file
which: /bin/irtt is not an executable file
which: /usr/sbin/irtt is not an executable file
which: /sbin/irtt is not an executable file
which: /usr/local/share/dotnet/irtt is not an executable file
UDP RTT test: Cannot use irtt runner (No irtt binary found in PATH.). Using netperf UDP_RR
Ping (ms) UDP BE3: Adding child NetperfDemoRunner
which: Found netperf executable at /usr/local/bin/netperf
which: Found fping executable at /usr/local/bin/fping
which: /usr/local/bin/ping is not an executable file
which: /usr/bin/ping is not an executable file
which: /bin/ping is not an executable file
which: /usr/sbin/ping is not an executable file
which: Found ping executable at /sbin/ping
WARNING: Found fping, but couldn't parse its output. Not using.
ERROR: Runner Ping (ms) ICMP failed check: Cannot parse output of the system ping binary (/sbin/ping). Please install fping v3.5+.
Traceback (most recent call last):
  File "/usr/local/lib/python3.9/site-packages/flent/aggregators.py", line 123, in collect
    t.check()
  File "/usr/local/lib/python3.9/site-packages/flent/runners.py", line 1196, in check
    self.command = self.find_binary(host=self.host, **args)
  File "/usr/local/lib/python3.9/site-packages/flent/runners.py", line 1287, in find_binary
    raise RunnerCheckError(
flent.runners.RunnerCheckError: Cannot parse output of the system ping binary (/sbin/ping). Please install fping v3.5+.

During handling of the above exception, another exception occurred:

Traceback (most recent call last):
  File "/usr/local/lib/python3.9/site-packages/flent/__init__.py", line 60, in run_flent
    b.run()
  File "/usr/local/lib/python3.9/site-packages/flent/batch.py", line 618, in run
    return self.run_test(self.settings, self.settings.DATA_DIR, True)
  File "/usr/local/lib/python3.9/site-packages/flent/batch.py", line 515, in run_test
    res = self.agg.postprocess(self.agg.aggregate(res))
  File "/usr/local/lib/python3.9/site-packages/flent/aggregators.py", line 237, in aggregate
    measurements, metadata, raw_values = self.collect()
  File "/usr/local/lib/python3.9/site-packages/flent/aggregators.py", line 125, in collect
    raise RuntimeError("Runner %s failed check: %s" % (n, e))
RuntimeError: Runner Ping (ms) ICMP failed check: Cannot parse output of the system ping binary (/sbin/ping). Please install fping v3.5+.
If your not testing your wan (ISP) connection, all you need to use flent is a netperf server "netserver" and the ability to respond to pings (an irtt client/server is recommended).
It is possible to install netperf (with a netserver) via opkg on your openwrt wifi AP opkg update; opkg install netperf. You will need to keep an eye on your AP cpu usage to make sure your not making observations that are limited by the AP cpu.
You can record the AP cpu (plus other AP stats if your interested) via flent if you also install opkg install flent-tools. To get the stats I use a passwordless ssh key on the AP and then include in the flent command line --test-parameter=cpu_stats_hosts=<AP-host>.
Again, I've tried both a netperf server and an irrt server running from a osx box - I don't recommend you do this except to convice yourself its not a good idea (but running flent from osx out to a non osx server may still be useful). Linux netperf/irtt servers can work (just look out for the wifi powersave feature mentioned above).
Keep in mind, ATF (and i suspect AQL) have the most impact when streaming from your AP to your clients. Streaming from you client to your AP will not be as informative.
your contributions are always welcome. In my case I was kind of flashing on some old history, and directing rodney angerfield in the direction of an uncaring universe.
I am happy we have got so many people pitching in, frustrated with all the bugs in wifi here, and elsewhere, and wishing there was funding for at least flent.
I have a TP-Link EAP245v3 (QCA9982) and had wifi latency issues that were really annoying when using SSH for example (scrolling was very laggy).
This seems to fixed by the latest airtime fairness patches on 22.03 (my current build is from commit 32e9095662).
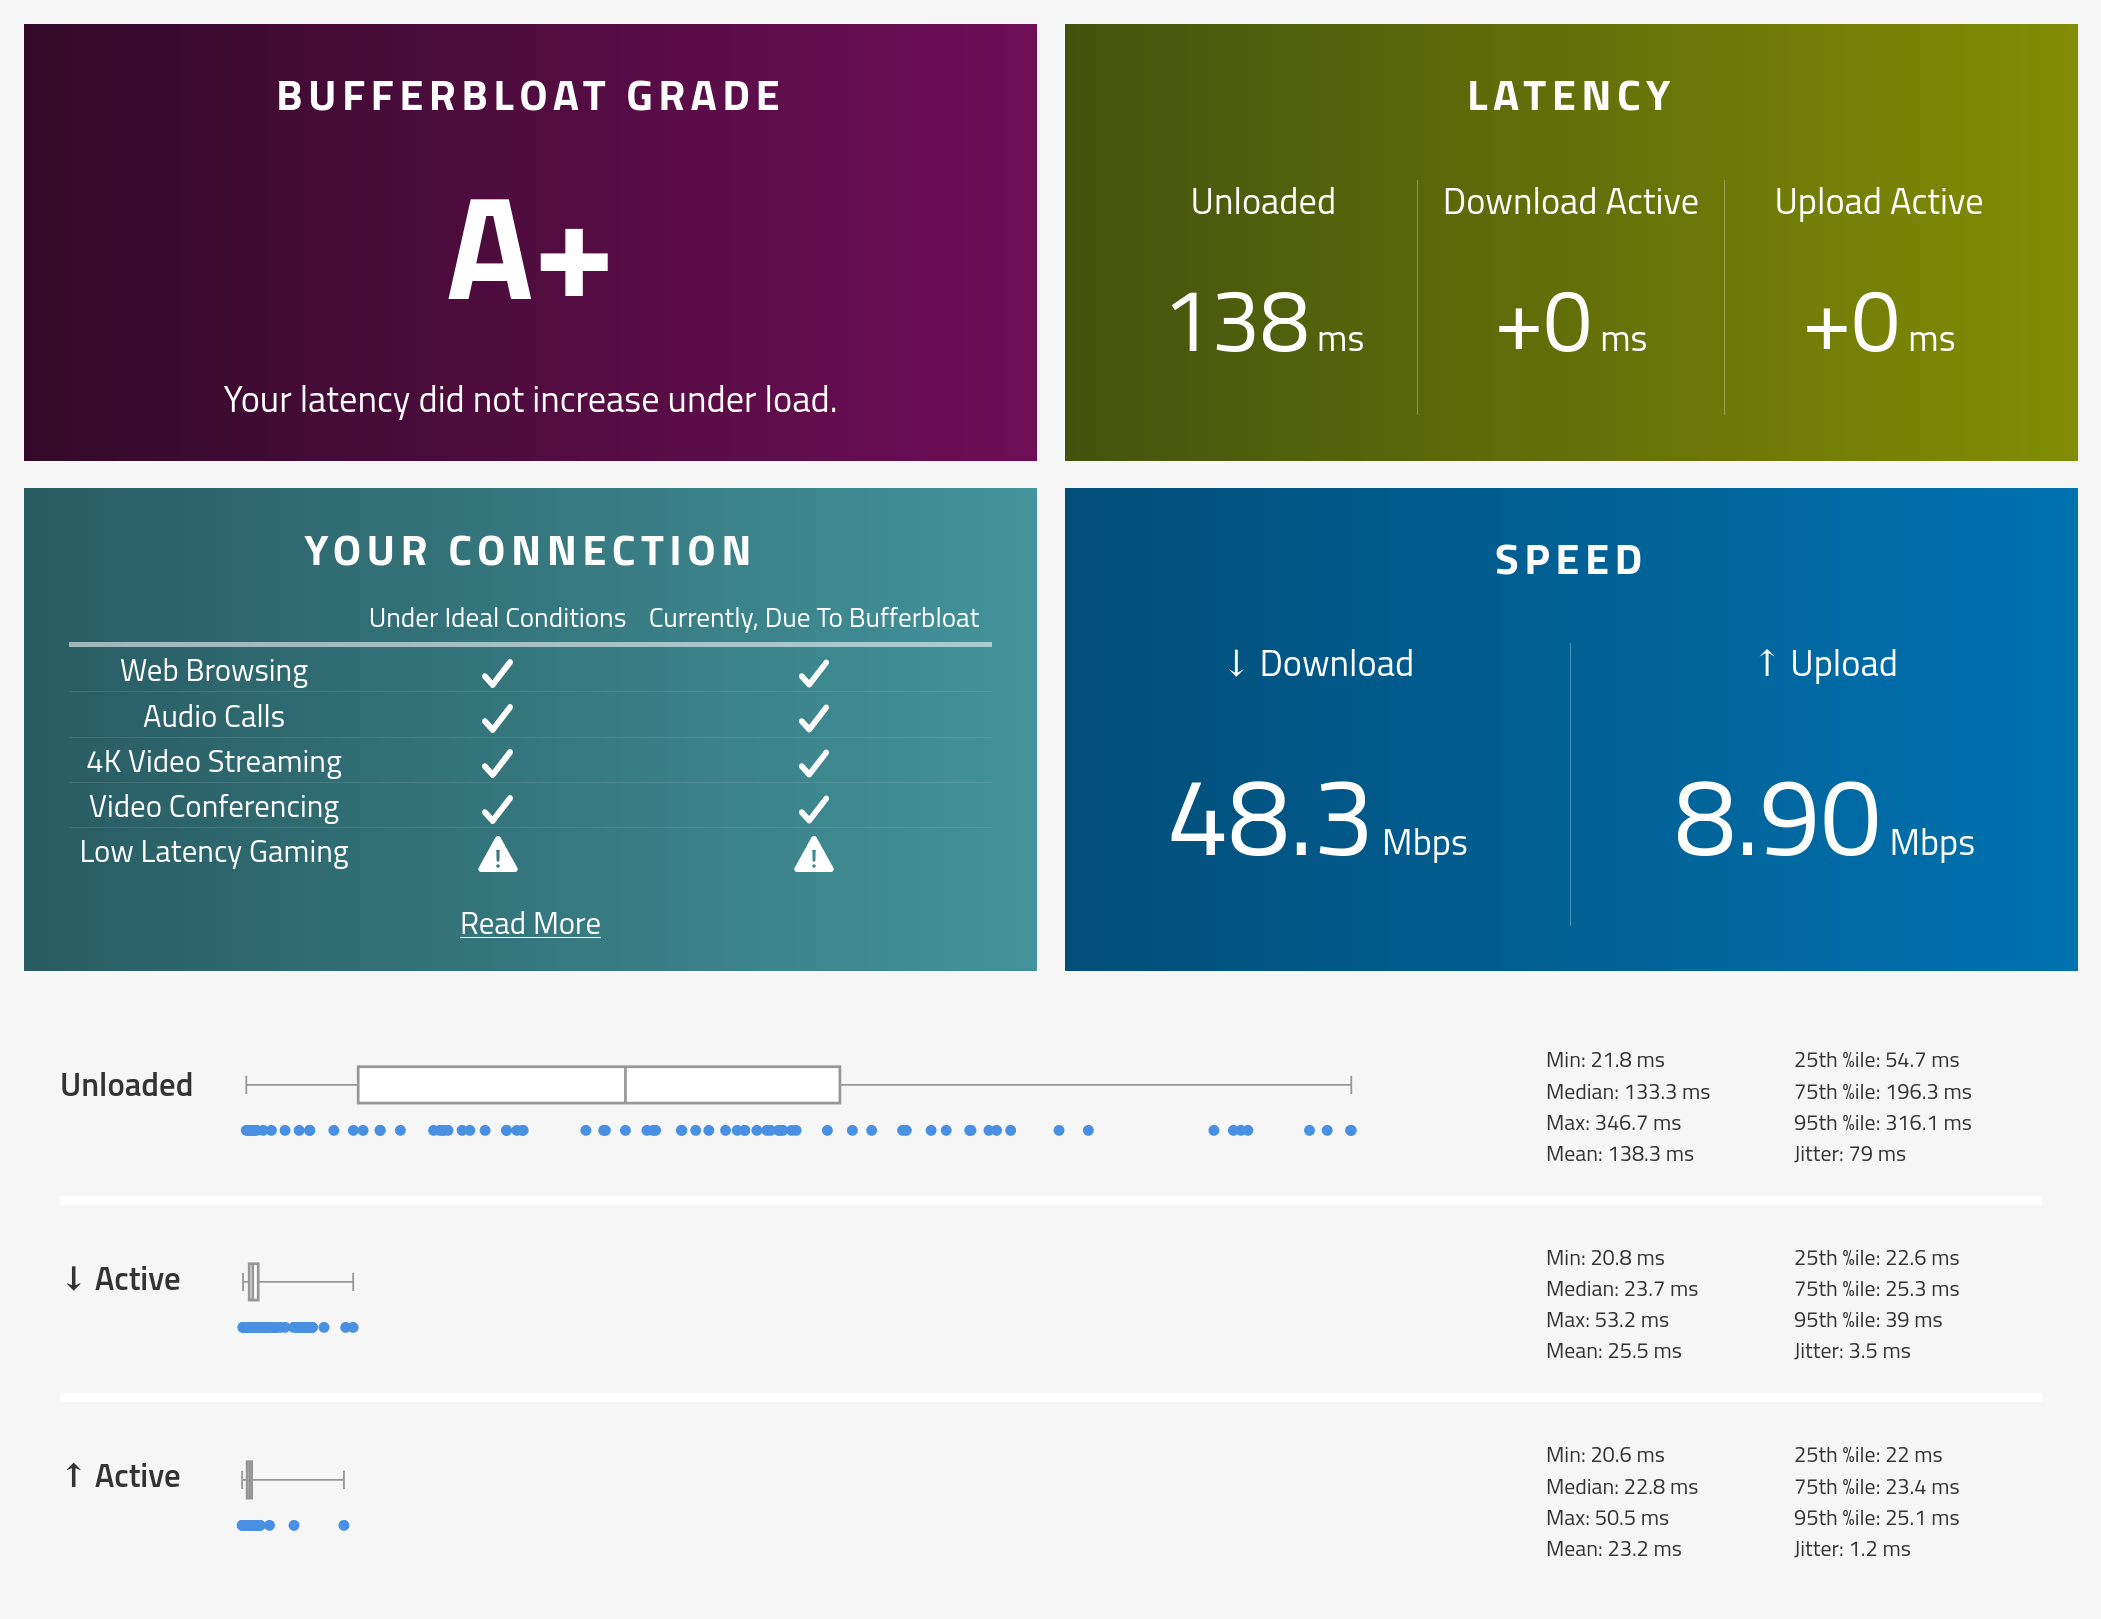
However I noticed strange latency issues when testing bufferbloat on my DSL line today: Latency is a lot higher when the line is idle. While Down- and uploading, latency is excellent. The waveform bufferbloat test shows this very well:
Is SQM on or off on the router? You are bottlenecked at the ISP link, not the wifi, in both tests.
Idle latency being poor on wifi is normal, due to the impact of powersave (usually a min 100ms)
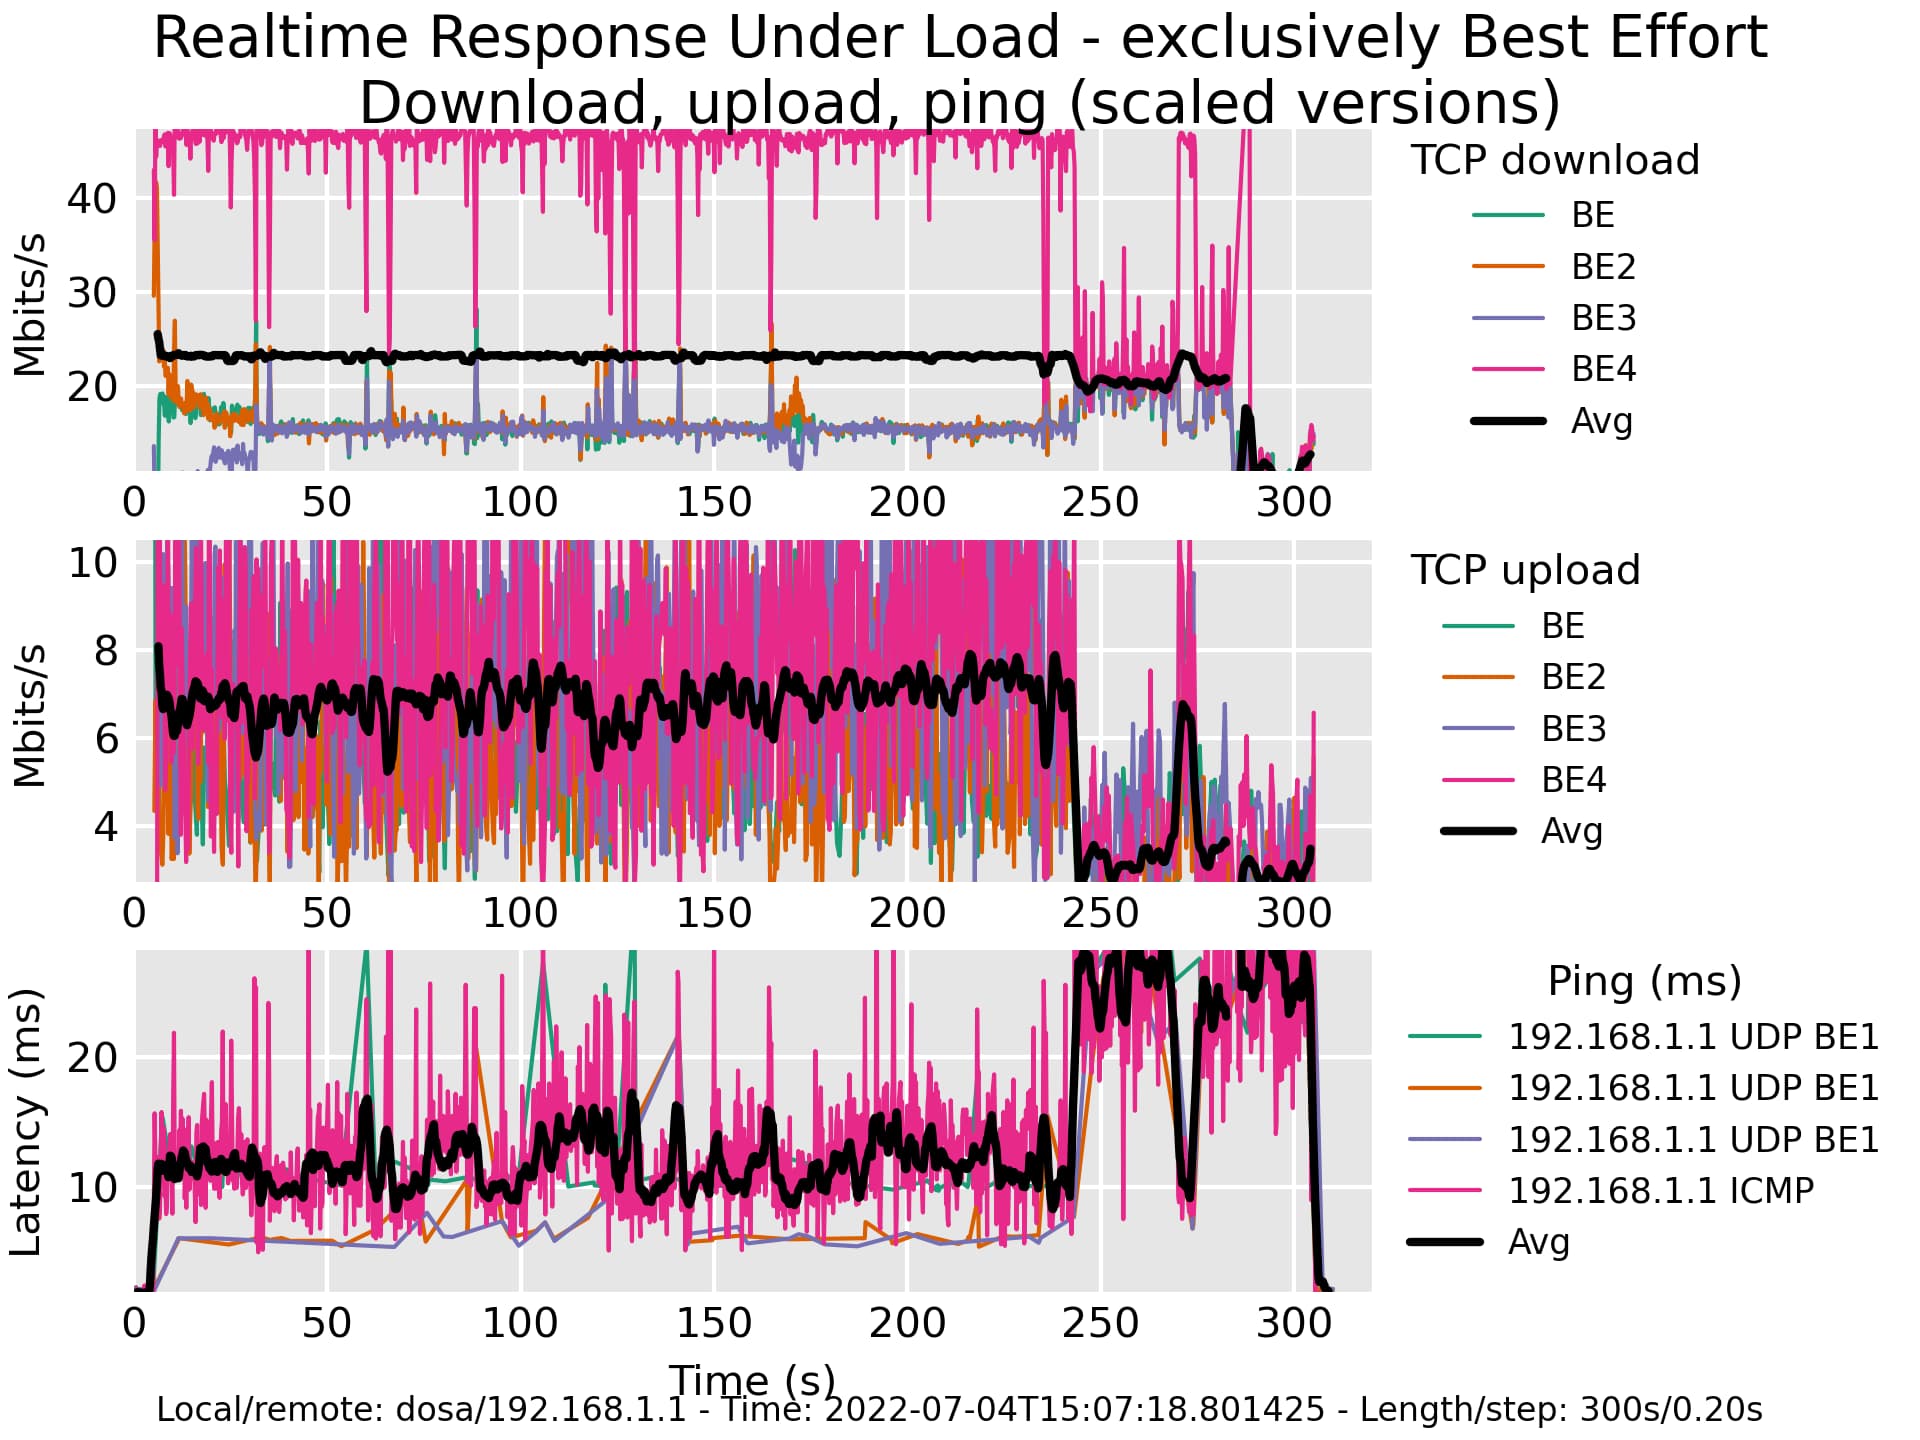
The gross disparity between the first BE flow and the other flows is puzzling. The four should have converged, long before they did, and what happened at T+250 is really puzzling. What's the client driving the test?
You actually should not be seeing 0 bufferbloat on this test, but somewhere between 5-20ms.
SQM on the router is on. It's an Apu2 that handles the PPPoE connection. That's also the node running netserver for flent, so the flent-plot should show the wifi speed. The flent client is a Thinkpad P14s with a Realtek RTL8852AE card.

