Thanks for the comment!
Does anyone know if the adb_forcedns DNS redirect type of firewall rule adds much overhead in a way that would affect overall performance?
The overhead should be virtually zero. That option adds a simple redirect rule to the firewall, CPU use is probably lost in the mix.
Take a look in /usr/bin/adblock.sh around line 560 for details on what it's doing (or do nft list ruleset | grep 'Adblock.DNS' to see its effect in action).
1 Like
Thank you. That is very reassuring and I was hoping that was the case.
Doing a bit of cleaning in the crontab. Do we still need to restart adblock regularly? I haven't seen any mention in the README.
# /etc/init.d/adblock timer
1>  00 02 * * * /etc/init.d/adblock restart
2>  30 02 * * * /etc/init.d/banip reload
Well, there might be no right or wrong ... that's my crontab:
50 03 * * * /etc/init.d/adblock report mail
55 03 * * * /etc/init.d/adblock reload
50 05 * * * /etc/init.d/banip report mail
55 05 * * * /etc/init.d/banip reload
I've never found a need to restart it, just reload it, like Dirk's doing above.
Well, generally reload is used after a configuration change, which is not the case in a cron job. That's the reason why I used restart when I installed adblock a long time ago...
I'm going to switch to using reload now
The adblock_lan53 block Traefik proxy acme certificat.
Trafiek use go-acme lego, the script seems to do an nslookup.
In my setup (ovh domain) it work only using some dns server.
For example 1.1.1.1 and 9.9.9.9 doesn't work.
How to add an exception to the dnat rule adblock_lan53.
I need to add an exception with both src_mac src_dip.
Could you help?
@dibdot
I've compiled new OpenWrt build today with kernel 6.1.74
After reboot I saw that Dnsmasq was using the CPU every few seconds.
Wondering about the possible cause I saw that the Adblock had over 530k blocked domains. I didn't change any Adblock settings nor filters and till today it was blocking ~280k.
I've reloaded Adblock and that gave me again ~280k blocked domains.
But I found this in the logs.
[ 3900.134278] uhttpd invoked oom-killer: gfp_mask=0x140cca(GFP_HIGHUSER_MOVABLE|__GFP_COMP), order=0, oom_score_adj=0
[ 3900.134341] CPU: 0 PID: 2506 Comm: uhttpd Not tainted 6.1.74 #0
[ 3900.143543] Hardware name: QNAP 301w (DT)
[ 3900.149434] Call trace:
[ 3900.153597]  dump_backtrace.part.0+0xc0/0xd0
[ 3900.155858]  show_stack+0x18/0x30
[ 3900.160370]  dump_stack_lvl+0x6c/0x88
[ 3900.163582]  dump_stack+0x18/0x34
[ 3900.167226]  dump_header+0x44/0x1a0
[ 3900.170524]  oom_kill_process+0x270/0x274
[ 3900.173825]  out_of_memory+0xd0/0x30c
[ 3900.177992]  __alloc_pages_slowpath.constprop.0+0x69c/0xa20
[ 3900.181640]  __alloc_pages+0x214/0x260
[ 3900.187020]  __folio_alloc+0x14/0x20
[ 3900.190839]  __filemap_get_folio+0x160/0x394
[ 3900.194573]  filemap_fault+0x134/0x7ac
[ 3900.198824]  __do_fault+0x3c/0x10c
[ 3900.202383]  __handle_mm_fault+0x538/0xa1c
[ 3900.205770]  handle_mm_fault+0xd8/0x260
[ 3900.209848]  do_page_fault+0x13c/0x310
[ 3900.213583]  do_translation_fault+0x88/0x94
[ 3900.217402]  do_mem_abort+0x44/0x94
[ 3900.221480]  el0_ia+0x4c/0xc0
[ 3900.224951]  el0t_64_sync_handler+0xc4/0x120
[ 3900.228079]  el0t_64_sync+0x174/0x178
[ 3900.232685] Mem-Info:
[ 3900.236024] active_anon:21695 inactive_anon:23853 isolated_anon:0
[ 3900.236024]  active_file:562 inactive_file:585 isolated_file:0
[ 3900.236024]  unevictable:0 dirty:162 writeback:0
[ 3900.236024]  slab_reclaimable:3495 slab_unreclaimable:28041
[ 3900.236024]  mapped:71 shmem:13851 pagetables:362
[ 3900.236024]  sec_pagetables:0 bounce:0
[ 3900.236024]  kernel_misc_reclaimable:0
[ 3900.236024]  free:12436 free_pcp:825 free_cma:0
[ 3900.254887] Node 0 active_anon:95412kB inactive_anon:86780kB active_file:3488kB inactive_file:276kB unevictable:0kB isolated(anon):0kB isolated(file):0kB mapped:284kB dirty:648kB writeback:0kB shmem:55404kB writeback_tmp:0kB kernel_stack:3212kB pagetables:1448kB sec_pagetables:0kB all_unreclaimable? no
[ 3900.281322] DMA free:52032kB boost:0kB min:16384kB low:20480kB high:24576kB reserved_highatomic:0KB active_anon:86780kB inactive_anon:95412kB active_file:0kB inactive_file:4104kB unevictable:0kB writepending:648kB present:1048576kB managed:888336kB mlocked:0kB bounce:0kB free_pcp:1748kB local_pcp:0kB free_cma:0kB
[ 3900.309182] lowmem_reserve[]: 0 0 0 0
[ 3900.331329] DMA: 842*4kB (U) 1491*8kB (UE) 759*16kB (UE) 394*32kB (UE) 190*64kB (UE) 0*128kB 0*256kB 0*512kB 0*1024kB 0*2048kB 0*4096kB = 52208kB
[ 3900.335072] 14938 total pagecache pages
[ 3900.348269] 0 pages in swap cache
[ 3900.351760] Free swap  = 0kB
[ 3900.355273] Total swap = 0kB
[ 3900.358172] 262144 pages RAM
[ 3900.360992] 0 pages HighMem/MovableOnly
[ 3900.363882] 40060 pages reserved
[ 3900.367438] Tasks state (memory values in pages):
[ 3900.370905] [  pid  ]   uid  tgid total_vm      rss pgtables_bytes swapents oom_score_adj name
[ 3900.375547] [   1039]    81  1039      379       46    32768        0             0 ubusd
[ 3900.384033] [   1041]     0  1041      227        9    28672        0             0 askfirst
[ 3900.392259] [   1079]     0  1079      266       16    28672        0             0 urngd
[ 3900.400786] [   1607]   514  1607      990       70    36864        0             0 logd
[ 3900.408904] [   1661]     0  1661     1045      209    36864        0             0 rpcd
[ 3900.417018] [   1954]     0  1954      275       14    36864        0             0 dropbear
[ 3900.425064] [   2066]     0  2066      707       24    36864        0             0 hostapd
[ 3900.433508] [   2067]     0  2067      707       25    32768        0             0 wpa_supplicant
[ 3900.441572] [   2077]   101  2077     2459      214    49152        0             0 wpa_supplicant
[ 3900.450713] [   2080]   101  2080     2588      319    53248        0             0 hostapd
[ 3900.459632] [   2133]     0  2133      665       85    32768        0             0 netifd
[ 3900.467800] [   2381]     0  2381      408       34    32768        0             0 odhcpd
[ 3900.476136] [   2440]     0  2440      333       14    28672        0             0 crond
[ 3900.484377] [   2506]     0  2506     1937      240    45056        0             0 uhttpd
[ 3900.492681] [   2558]     0  2558      465       28    32768        0             0 dbus-daemon
[ 3900.500763] [   2625] 65534  2625      602       81    32768        0             0 avahi-daemon
[ 3900.509441] [   2865]     0  2865     1223      171    36864        0             0 collectd
[ 3900.518455] [   4424]     0  4424      403       21    32768        0             0 ksmbd.mountd
[ 3900.526834] [   4471]     0  4471      445       17    32768        0             0 ksmbd.mountd
[ 3900.535593] [   4487]     0  4487      707       28    32768        0             0 ntpd
[ 3900.544347] [   4517]   123  4517      332        9    28672        0             0 ntpd
[ 3900.552496] [   4644]     0  4644      269       17    28672        0             0 odhcp6c
[ 3900.560624] [   4648]     0  4648      332        9    32768        0             0 udhcpc
[ 3900.568569] [   5075]     0  5075      239       19    32768        0             0 wsdd2
[ 3900.576929] [   6026]     0  6026      440      126    32768        0             0 dynamic_dns_upd
[ 3900.585171] [   9177]     0  9177      533      177    32768        0             0 banip-service.s
[ 3900.594070] [  10028]     0 10028      707       28    36864        0             0 dnsmasq
[ 3900.603124] [  10039]   453 10039    10631    10260   114688        0             0 dnsmasq
[ 3900.611444] [  10463]     0 10463      533      176    32768        0             0 banip-service.s
[ 3900.619718] [  10464]     0 10464      535      176    32768        0             0 banip-service.s
[ 3900.628727] [  10465]     0 10465      437       34    32768        0             0 logread
[ 3900.637758] [  13482]     0 13482      333       11    28672        0             0 sleep
[ 3900.646103] [  13779]     0 13779      523      168    32768        0             0 adblock.sh
[ 3900.654407] [  13950]     0 13950      523      167    32768        0             0 adblock.sh
[ 3900.663062] [  14011]     0 14011    28158    18961   200704        0             0 sort
[ 3900.671582] oom-kill:constraint=CONSTRAINT_NONE,nodemask=(null),cpuset=/,mems_allowed=0,global_oom,task_memcg=/,task=sort,pid=14011,uid=0
[ 3900.679809] Out of memory: Killed process 14011 (sort) total-vm:112632kB, anon-rss:75844kB, file-rss:0kB, shmem-rss:0kB, UID:0 pgtables:196kB oom_score_adj:0
This is in the Adblock log - user.info adblock-4.1.5[8905]: preparation of 'hblock' failed, rc: 137
Sort process was OOM-killed.
Then I decided to reload Adblock one more time and that gave again over 500k blocked domains with high CPU usage from Dnsmasq.
Any suggestions what to look for?
Gd dmn!! 280k domains?? What feeds have you enabled for blocking? Try doing a restart instead of a reload. To be honest, I don't think dnsmasq has been tested to load that much domains for filtering.
Anyway.. just curious questions..
- What was the kernel version you were using before updating to the latest?
- Before updating, 280k domains was your average for number of domains?
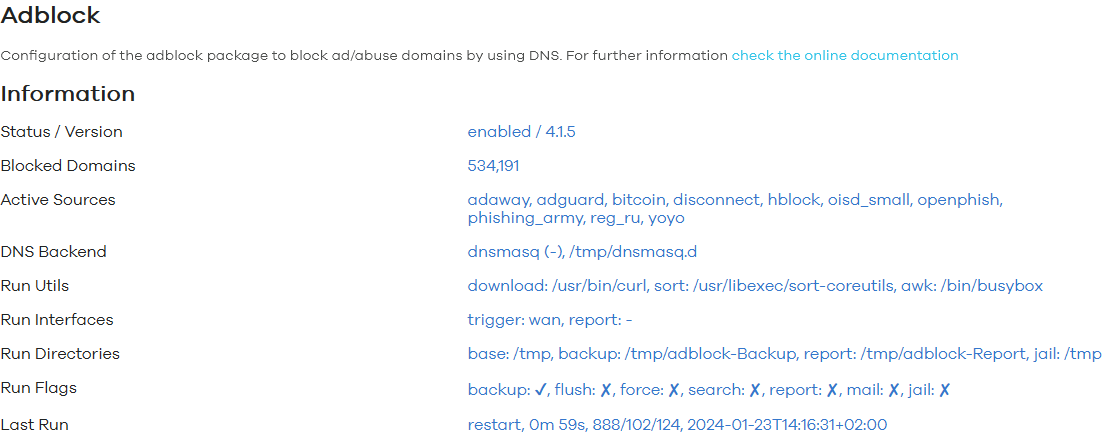
- I updated really frequently for the last two months because of testing NSS wifi build so almost all below 6.1.74.
- Yes, and I use the same filters for months (over 280k blocked domains) on R7800 (NSS build kernel 5.15) which has 512MB RAM half the system memory compared to QNAP. Never had issues.
First of all.. sorry, regarding the 280k domains.. I forgot, I'm already at 850k domains blocked and dnsmasq has no issues with it except when getting OMM every few days (even having zram enabled).. whahahahaha...
Anyway, I think it's because 6.1.x kernel (64bit) eats more memory on my experience especially with NSS build. Even after reboot, only 40-60mb free is left on my 512mb memory and mine isn't even a full NSS build yet. I think I've got too many packages installed and running hahaha
In retrospect, I have another router (not same with the 6.1.x kernel) that almost have the same packages installed and running but still using the 5.15.x kernel. Same 850k domains but the free memory is still almost 50% of the 512mb memory.
How to retain longer AdBlock logs?
I've been running AdBlock on OWRT just fine for years now.
It finally happened to me that I wanted to dig up some historic AdBlock info (from the day before). However, by default, it looks like the AdBlock logs are small in size and cycle frequently (??)
A few days ago, I updated my Advanced Report Settings:
- Report Chunk Count = 7
- Report Chunk Size = 7 MB
I still don't see logs from yesterday, and I notice my AdBlock logs are currently at 4.8 MB.
Am I on the right track in modifying these settings? My end goal is to have a much larger backlog of AdBlock data to sift through, at my own leisure.
In other words... how do you change this value? 

Thanks!
....and I think I answered my own question. I have a cronjob that restarts AdBlock every morning.
Funny, I wouldn't expect the job restart to clear the logs though. I have them stored on /etc/adblock which (should be) a non-volatile filesystem.
I'll leave these posts here in case anyone ever runs into the same.
Don't do this.. this technically writes to the FLASH memory which has a limited number of writes. You will run out of write cycles and when this happens you can brick your router. You should do saving to a flash drive (or external drives) instead if possible.
1 Like
Thanks for the tip. I've heard that before but that's why I moved logs to /etc.
I believe only my /tmp and /dev are mounted on a tempfs.
For what it's worth, I'm running OWRT on an x86 so /dev/root is actually on an HDD.
(But you bring up a good point, I should probably go back and confirm where all the other OWRT logging occurs and make sure none of it is on flash.)
Follow-up question:
What do y'all recommend for capturing historical logs in OpenWRT then? (Assuming you don't want to write to the router itself.)
Well if that's the case then it's good. Sorry I assumed you were running it on an actual router.
1 Like
The usual choices for this.. one is using external/flash drives if possible (simplest).. second is a central repository/server to store the logs (difficultly level=high).
1 Like