Hi there
Running asterisk 18 default repo package on 22.03 RC6 shows that system load is 1.0 , even with the system iddle for hours, no incoming/outgoing calls, no anything and the load does not decrease.
I attach evidence.
On 21.02 system load fluctuates between 0 and 1, also there is no evident reason for that because the system is iddle, there in no activity at all.
As soon as I turn off asterisk, system load goes down to 0 in that same iddle system (as expected).
I turned on asterisk debugging but shows nos activity at all, as expected, as there is no activity. So I am in a dead end to find out why that load,
Any help will be apreciated.
Hi there,
I cannot reproduce this on 22.03 rc6 on a ath79 generic router. I installed:
asterisk-pjsip asterisk-res-rtp-asterisk asterisk-bridge-simple
I added this to /etc/asterisk/pjsip.conf (rubbish passwords etc., just for testing):
[simpletrans]
type=transport
protocol=udp
bind=192.168.0.1

[6001]
type = endpoint
context = internal
disallow = all
allow = alaw
aors = 6001
auth = auth6001
direct_media = no

[6001]
type = aor
max_contacts = 1
support_path = yes

[auth6001]
type=auth
auth_type=userpass
password=1234
username=6001

[6002]
type = endpoint
context = internal
disallow = all
allow = alaw
aors = 6002
auth = auth6002
direct_media = no

[6002]
type = aor
max_contacts = 1
support_path = yes

[auth6002]
type=auth
auth_type=userpass
password=1234
username=6002
And this to /etc/asterisk/extensions.conf:
[internal]
exten => _6XXX,1,Dial(PJSIP/${EXTEN})
Then I put asterisk to enabled in /etc/config/asterisk and started asterisk.
15 minutes later:
uptime
 11:11:22 up 5 days, 53 min,  load average: 0.01, 0.03, 0.06
Maybe you can provide a minimal reproducer.
Hi Micmac! Thank you very much. Seeing your results I am starting to think that I messed up my Asterisk configuration, as I made a lot of changes in the config files and installed many modules (Voicemail, DB functions, codecs etc)
I am purging my installation and start all over from scratch, Will check the load after every aditional module/app/function install to try to isolate this issue.
Thank you for your help! I will report back my progress
All the best!
This is what I get after flashing 22.03RC6 and installing just asterisk-pjsip asterisk-res-rtp-asterisk asterisk-bridge-simple and luci statistics.
System running with asterisk disabled:
root@OpenWrt:~# uptime
 13:46:03 up 17 min,  load average: 0.05, 0.16, 0.15
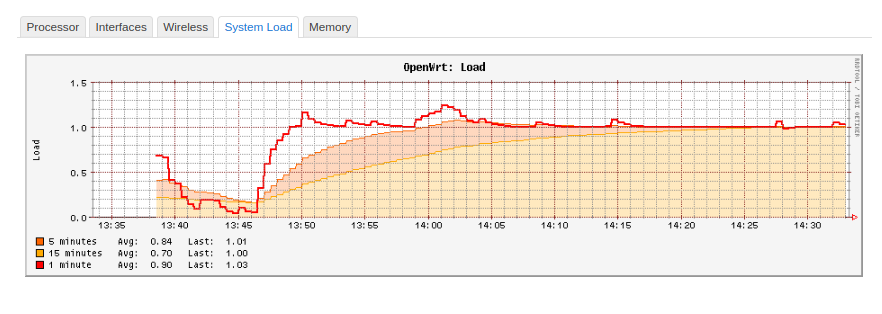
Asterisk enabled:
root@OpenWrt:~# /etc/init.d/asterisk start
root@OpenWrt:~# uptime
 14:25:48 up 57 min,  load average: 1.00, 1.00, 0.99
I noticed an strange log in Asterisk, maybe has something to do:
[Aug 27 14:28:06] Asterisk 18.11.2 built by nobody @ openwrt.org on a unknown running Linux on 2022-08-25 19:42:44 UTC
[Aug 27 14:28:06] NOTICE[6753] loader.c: 81 modules will be loaded.
[Aug 27 14:28:06] ERROR[6753] config_options.c: Unable to load config file 'cdr.conf'
[Aug 27 14:28:06] NOTICE[6753] cdr.c: Failed to process CDR configuration; using defaults
[Aug 27 14:28:06] NOTICE[6753] cdr.c: CDR simple logging enabled.
[Aug 27 14:28:07] ERROR[6804] res_pjsip/config_system.c: There are no local system nameservers configured, resorting to system resolution
[Aug 27 14:28:07] ERROR[6804] res_pjsip/config_system.c: There are no local system nameservers configured, resorting to system resolution
[Aug 27 14:28:07] WARNING[6753] pbx.c: Context 'local' tries to include nonexistent context 'iaxtel700'
[Aug 27 14:28:07] WARNING[6753] loader.c: The deprecated module 'app_macro.so' has been loaded and is running, it may be removed in a future version
**[Aug 27 14:30:06] WARNING[6777] asterisk.c: The canary is no more.  He has ceased to be!  He's expired and gone to meet his maker!  He's a stiff!  Bereft of life, he rests in peace.  His metabolic processes are now history!  He's off the twig!  He's kicked the bucket.  He's shuffled off his mortal coil, run down the curtain, and joined the bleeding choir invisible!!  THIS is an EX-CANARY.  (Reducing priority)**
**[Aug 27 14:30:06] WARNING[6777] asterisk.c: Unable to set regular thread priority on main thread**
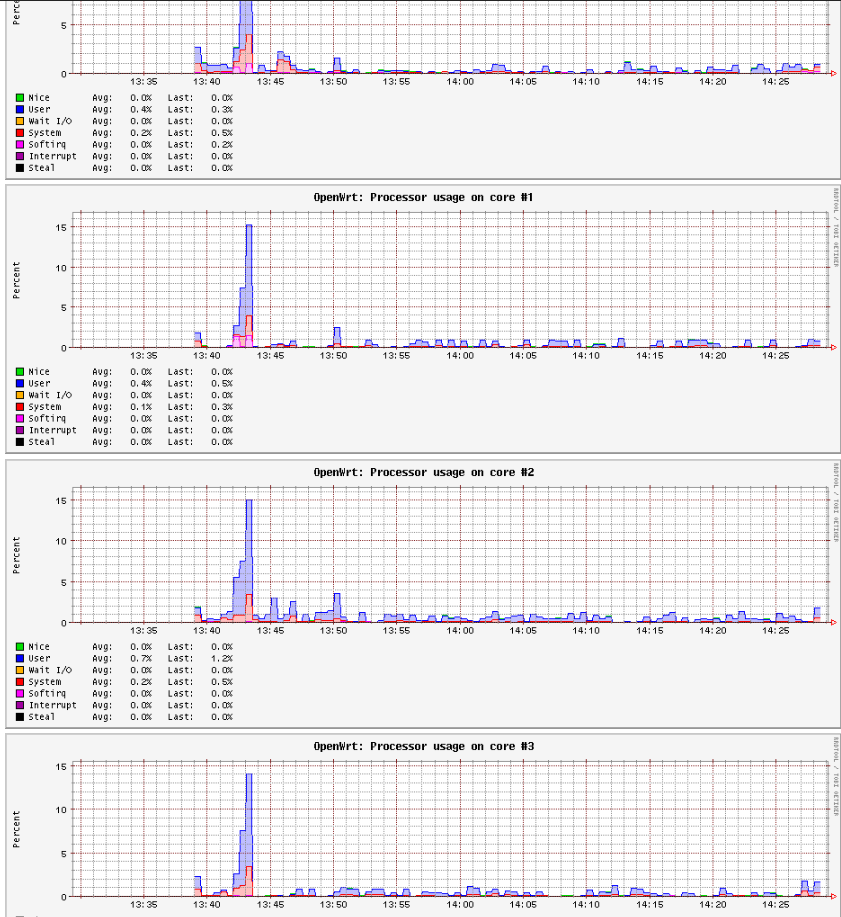
Also I can see there is no CPu activity (none of the 2 cores/ 4 threads)
I have the same messages and no load issue.
[Aug 27 15:08:13] Asterisk 18.11.2 built by nobody @ openwrt.org on a unknown running Linux on 2022-08-21 16:59:52 UTC
[Aug 27 15:08:13] NOTICE[12964] loader.c: 81 modules will be loaded.
[Aug 27 15:08:13] ERROR[12964] config_options.c: Unable to load config file 'cdr.conf'
[Aug 27 15:08:13] NOTICE[12964] cdr.c: Failed to process CDR configuration; using defaults
[Aug 27 15:08:13] NOTICE[12964] cdr.c: CDR simple logging enabled.
[Aug 27 15:08:13] ERROR[13015] res_pjsip/config_system.c: There are no local system nameservers configured, resorting to system resolution
[Aug 27 15:08:13] ERROR[13015] res_pjsip/config_system.c: There are no local system nameservers configured, resorting to system resolution
[Aug 27 15:08:14] WARNING[12964] pbx.c: Context 'local' tries to include nonexistent context 'iaxtel700'
[Aug 27 15:08:14] WARNING[12964] loader.c: The deprecated module 'app_macro.so' has been loaded and is running, it may be removed in a future version
[Aug 27 15:10:13] WARNING[12990] asterisk.c: The canary is no more.  He has ceased to be!  He's expired and gone to meet his maker!  He's a stiff!  Bereft of life, he rests in peace.  His metabolic processes are now history!  He's off the twig!  He's kicked the bucket.  He's shuffled off his mortal coil, run down the curtain, and joined the bleeding choir invisible!!  THIS is an EX-CANARY.  (Reducing priority)
[Aug 27 15:10:13] WARNING[12990] asterisk.c: Unable to set regular thread priority on main thread
date; uptime
Sat Aug 27 17:13:58 CEST 2022
 17:13:58 up 7 days,  6:56,  load average: 0.04, 0.02, 0.00
Maybe it's related to luci statistics?
Uninstalled Luci statistics, reboot:
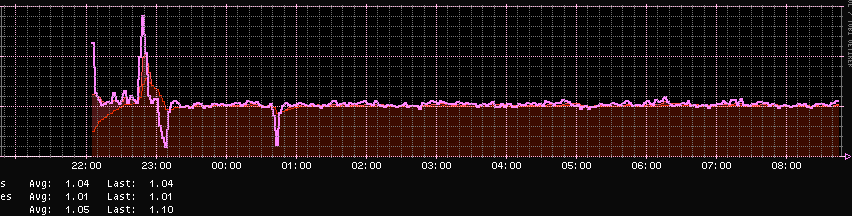
Exactly the same, sysload at 1.0
CPU:   0% usr   0% sys   0% nic  99% idle   0% io   0% irq   0% sirq
Load average: 1.04 1.05 1.01 2/115 3110
  PID  PPID USER     STAT   VSZ %VSZ %CPU COMMAND
 2254     1 asterisk S    39528  16%   0% /usr/sbin/asterisk -U asterisk -f
 3110  2930 root     R     1328   1%   0% top
 2929  1400 root     S     1236   0%   0% /usr/sbin/dropbear -F -P /var/run/dropbear.1.pid -p 22 -K 300 -T 3 -2 9
 2832     2 root     IW       0   0%   0% [kworker/u8:2-ev]
 1509  1505 network  S     4404   2%   0% /usr/sbin/hostapd -s -g /var/run/hostapd/global
 1510  1506 network  S     4404   2%   0% /usr/sbin/wpa_supplicant -n -s -g /var/run/wpa_supplicant/global
 1747     1 root     S     4116   2%   0% /usr/sbin/uhttpd -f -h /www -r OpenWrt -x /cgi-bin -u /ubus -t 60 -T 30 -k 20 -A 1 -n 3 -N 100 -R -p 0.0.0.0:80 -p [::]:80 -C /etc/uhttpd.crt -K /etc/uhttpd.key -s 0.0.0.0:443 -s [::]:443
 2185     1 root     S     2664   1%   0% {ntpd} /sbin/ujail -t 5 -n ntpd -U ntp -G ntp -C /etc/capabilities/ntpd.json -c -u -r /bin/ubus -r /usr/bin/env -r /usr/bin/jshn -r /usr/sbin/ntpd-hotplug -r /usr/share/libubox/jshn.sh -- /usr/sbin/ntpd -n -N -S /usr/sb
 1506     1 root     S     2664   1%   0% {wpa_supplicant} /sbin/ujail -t 5 -n wpa_supplicant -U network -G network -C /etc/capabilities/wpad.json -c -- /usr/sbin/wpa_supplicant -n -s -g /var/run/wpa_supplicant/global
 1505     1 root     S     2664   1%   0% {hostapd} /sbin/ujail -t 5 -n hostapd -U network -G network -C /etc/capabilities/wpad.json -c -- /usr/sbin/hostapd -s -g /var/run/hostapd/global
 2533     1 root     S     2664   1%   0% {dnsmasq} /sbin/ujail -t 5 -n dnsmasq -u -l -r /bin/ubus -r /etc/TZ -r /etc/dnsmasq.conf -r /etc/ethers -r /etc/group -r /etc/hosts -r /etc/passwd -w /tmp/dhcp.leases -r /tmp/dnsmasq.d -r /tmp/hosts -r /tmp/resolv.conf.
 1196     1 root     S     2136   1%   0% /sbin/rpcd -s /var/run/ubus/ubus.sock -t 30
 1570     1 root     S     1820   1%   0% /sbin/netifd
    1     0 root     S     1684   1%   0% /sbin/procd
 1625     1 root     S     1644   1%   0% /usr/sbin/odhcpd
 2544  2533 dnsmasq  S     1484   1%   0% /usr/sbin/dnsmasq -C /var/etc/dnsmasq.conf.cfg01411c -k -x /var/run/dnsmasq/dnsmasq.cfg01411c.pid
 1142     1 logd     S     1352   1%   0% /sbin/logd -S 64
  668     1 ubus     S     1332   1%   0% /sbin/ubusd
 2930  2929 root     S     1316   1%   0% -ash
 2229  2185 ntp      S     1312   1%   0% /usr/sbin/ntpd -n -N -S /usr/sbin/ntpd-hotplug -p 0.openwrt.pool.ntp.org -p 1.openwrt.pool.ntp.org -p 2.openwrt.pool.ntp.org -p 3.openwrt.pool.ntp.org
 2952  1570 root     S     1312   1%   0% udhcpc -p /var/run/udhcpc-wan.pid -s /lib/netifd/dhcp.script -f -t 0 -i wan -x hostname:OpenWrt -C -R -O 121
 1400     1 root     S     1216   0%   0% /usr/sbin/dropbear -F -P /var/run/dropbear.1.pid -p 22 -K 300 -T 3
 2951  1570 root     S     1132   0%   0% odhcp6c -s /lib/netifd/dhcpv6.script -P0 -t120 wan
  705     1 root     S     1116   0%   0% /sbin/urngd
  669     1 root     S     1000   0%   0% /sbin/askfirst /usr/libexec/login.sh
  594     2 root     SWN      0   0%   0% [jffs2_gcd_mtd6]
  449     2 root     IW<      0   0%   0% [kworker/0:1H-ev]
  448     2 root     IW<      0   0%   0% [kworker/1:1H-ev]
   23     2 root     IW<      0   0%   0% [kworker/2:0H-ev]
  304     2 root     SW       0   0%   0% [spi0]
  245     2 root     IW<      0   0%   0% [kworker/3:1H-ev]
  187     2 root     SW       0   0%   0% [kcompactd0]
  810     2 root     IW       0   0%   0% [kworker/0:2-eve]
  444     2 root     IW       0   0%   0% [kworker/3:5-eve]
   11     2 root     IW       0   0%   0% [rcu_sched]
   81     2 root     IW       0   0%   0% [kworker/1:1-mm_]
   30     2 root     IW       0   0%   0% [kworker/u8:1-ev]
  186     2 root     IW       0   0%   0% [kworker/2:1-mm_]
   10     2 root     SW       0   0%   0% [ksoftirqd/0]
   55     2 root     IW       0   0%   0% [kworker/0:1-eve]
   21     2 root     SW       0   0%   0% [ksoftirqd/2]
   26     2 root     SW       0   0%   0% [ksoftirqd/3]
   16     2 root     SW       0   0%   0% [ksoftirqd/1]
    2     0 root     SW       0   0%   0% [kthreadd]
  387     2 root     IW<      0   0%   0% [ipv6_addrconf]
  257     2 root     IW<      0   0%   0% [kthrotld]
  246     2 root     SW       0   0%   0% [kswapd0]
  388     2 root     IW<      0   0%   0% [dsa_ordered]
  214     2 root     IW<      0   0%   0% [blkcg_punt_bio]
  212     2 root     IW<      0   0%   0% [kblockd]
  500     2 root     IW<      0   0%   0% [mmc_complete]
  498     2 root     IW<      0   0%   0% [kworker/3:2H-ev]
  506     2 root     IW<      0   0%   0% [kworker/1:2H-ev]
  671     2 root     IW<      0   0%   0% [kworker/2:2H-ev]
  659     2 root     IW<      0   0%   0% [kworker/0:2H-ev]
  459     2 root     SW       0   0%   0% [irq/32-keys]
  445     2 root     IW       0   0%   0% [kworker/3:6-eve]
  477     2 root     IW       0   0%   0% [kworker/2:2-eve]
  796     2 root     SW       0   0%   0% [napi/phy0-7]
  805     2 root     SW       0   0%   0% [mt76-tx phy0]
  792     2 root     IW       0   0%   0% [kworker/1:2]
^C822     2 root     SW       0   0%   0% [napi/phy1-9]
I isolated the issue to pjsip stack. With that disabled, sysload is normal, 0-0,2 when there is no activity. Enabling pjsip brings the strange system load behaviour back. (note I am using the example pjsip.conf and extensions.conf that you posted)
Anyway, is system load something to worry about? I mean, the system shows 1.0 load, but cpu shows no activity, so it could be "just" a bug, the system wrongly calculating the load when asterisk is running. I dont really know the inplications of a system running all the time at 1.0 load anyway
If I am not wrong, having 4 threads means that the cpu can handle up to 4.0 load until the proceses running have to wait to use the cpu.
What router are you using?
It is a zbtlink we-1326 (mt7621)
I checked pjproject and asterisk config logs for mt7621 from 22.03 and compared against 21.02. I didn't see anything out of the ordinary.
I have no other idea regarding the load issue. I hope it works out for you anyway.
1 Like
I really apreciate all your efforts. My next step will be compiling master just in case the issue is not there.
Thank you for all your help!
I did some debug of the process asterisk and child threads, and I found out some weird activity while asterisk is iddle. Could this be causing the system load?
root@OpenWrt:~# ps -LlFm -p 2503
F S UID        PID  PPID   LWP  C NLWP PRI  NI ADDR SZ WCHAN    RSS PSR STIME TTY          TIME CMD
4 - asterisk  2503     1     -  1   30   -   - -  9882 -      11164   - 20:03 ?        00:00:09 /usr/sbin/asterisk -U asterisk -f
4 S asterisk     -     -  2503  0    -  80   0 -     - ?          -   1 20:03 -        00:00:05 -
1 S asterisk     -     -  2920  0    -  80   0 -     - ?          -   1 20:03 -        00:00:00 -
1 S asterisk     -     -  2921  0    -  80   0 -     - ?          -   1 20:03 -        00:00:00 -
1 S asterisk     -     -  2927  0    -  80   0 -     - ?          -   2 20:03 -        00:00:00 -
1 S asterisk     -     -  2928  0    -  80   0 -     - -          -   1 20:03 -        00:00:00 -
1 S asterisk     -     -  2929  0    -  80   0 -     - ?          -   3 20:03 -        00:00:00 -
1 S asterisk     -     -  2930  0    -  80   0 -     - ?          -   0 20:03 -        00:00:00 -
1 S asterisk     -     -  2931  0    -  80   0 -     - -          -   1 20:03 -        00:00:00 -
1 S asterisk     -     -  2932  0    -  80   0 -     - ?          -   1 20:03 -        00:00:00 -
1 S asterisk     -     -  2933  0    -  80   0 -     - ?          -   1 20:03 -        00:00:00 -
1 S asterisk     -     -  2934  0    -  80   0 -     - ?          -   2 20:03 -        00:00:00 -
1 S asterisk     -     -  2935  0    -  80   0 -     - -          -   1 20:03 -        00:00:00 -
1 S asterisk     -     -  2936  0    -  80   0 -     - ?          -   1 20:03 -        00:00:00 -
1 S asterisk     -     -  2937  0    -  80   0 -     - -          -   1 20:03 -        00:00:00 -
1 S asterisk     -     -  2938  0    -  80   0 -     - -          -   1 20:03 -        00:00:00 -
1 S asterisk     -     -  2939  0    -  80   0 -     - -          -   1 20:03 -        00:00:00 -
1 S asterisk     -     -  2940  0    -  80   0 -     - -          -   0 20:03 -        00:00:00 -
1 S asterisk     -     -  2941  0    -  80   0 -     - ?          -   2 20:03 -        00:00:00 -
1 S asterisk     -     -  2942  0    -  80   0 -     - -          -   0 20:03 -        00:00:00 -
1 S asterisk     -     -  2943  0    -  80   0 -     - -          -   1 20:03 -        00:00:02 -
1 S asterisk     -     -  2950  0    -  80   0 -     - -          -   0 20:03 -        00:00:00 -
1 S asterisk     -     -  2951  0    -  80   0 -     - -          -   0 20:03 -        00:00:00 -
1 S asterisk     -     -  2952  0    -  80   0 -     - -          -   1 20:03 -        00:00:00 -
1 S asterisk     -     -  2953  0    -  80   0 -     - ?          -   1 20:03 -        00:00:00 -
1 S asterisk     -     -  2954  0    -  80   0 -     - ?          -   1 20:03 -        00:00:00 -
1 S asterisk     -     -  2955  0    -  80   0 -     - -          -   0 20:03 -        00:00:00 -
1 S asterisk     -     -  2956  0    -  80   0 -     - -          -   2 20:03 -        00:00:01 -
1 S asterisk     -     -  2957  0    -  80   0 -     - ?          -   0 20:03 -        00:00:00 -
1 S asterisk     -     -  2958  0    -  80   0 -     - -          -   1 20:03 -        00:00:00 -
1 S asterisk     -     -  2959  0    -  80   0 -     - ?          -   0 20:03 -        00:00:00 -
This process is in an endless loop that repeats this message about 10 times every second:
root@OpenWrt:~# strace -p 2943
strace: Process 2943 attached
_newselect(1024, [4], [], [], {tv_sec=0, tv_usec=0}) = 0 (Timeout)
_newselect(1024, [4], [], [], {tv_sec=0, tv_usec=10000}) = 0 (Timeout)
_newselect(1024, [4], [], [], {tv_sec=0, tv_usec=10000}) = 0 (Timeout)
_newselect(1024, [4], [], [], {tv_sec=0, tv_usec=10000}) = 0 (Timeout)
_newselect(1024, [4], [], [], {tv_sec=0, tv_usec=10000}) = 0 (Timeout)
_newselect(1024, [4], [], [], {tv_sec=0, tv_usec=10000}) = 0 (Timeout)
_newselect(1024, [4], [], [], {tv_sec=0, tv_usec=10000}) = 0 (Timeout)
_newselect(1024, [4], [], [], {tv_sec=0, tv_usec=10000}) = 0 (Timeout)
_newselect(1024, [4], [], [], {tv_sec=0, tv_usec=10000}) = 0 (Timeout)
_newselect(1024, [4], [], [], {tv_sec=0, tv_usec=10000}) = 0 (Timeout)
_newselect(1024, [4], [], [], {tv_sec=0, tv_usec=10000}) = 0 (Timeout)
_newselect(1024, [4], [], [], {tv_sec=0, tv_usec=10000}) = 0 (Timeout)
_newselect(1024, [4], [], [], {tv_sec=0, tv_usec=10000}) = 0 (Timeout)
_newselect(1024, [4], [], [], {tv_sec=0, tv_usec=10000}) = 0 (Timeout)
_newselect(1024, [4], [], [], {tv_sec=0, tv_usec=10000}) = 0 (Timeout)
_newselect(1024, [4], [], [], {tv_sec=0, tv_usec=10000}) = 0 (Timeout)
_newselect(1024, [4], [], [], {tv_sec=0, tv_usec=10000}) = 0 (Timeout)
_newselect(1024, [4], [], [], {tv_sec=0, tv_usec=10000}) = 0 (Timeout)
_newselect(1024, [4], [], [], {tv_sec=0, tv_usec=10000}) = 0 (Timeout)
_newselect(1024, [4], [], [], {tv_sec=0, tv_usec=10000}) = 0 (Timeout)
_newselect(1024, [4], [], [], {tv_sec=0, tv_usec=10000}) = 0 (Timeout)
_newselect(1024, [4], [], [], {tv_sec=0, tv_usec=10000}) = 0 (Timeout)
_newselect(1024, [4], [], [], {tv_sec=0, tv_usec=10000}) = 0 (Timeout)
_newselect(1024, [4], [], [], {tv_sec=0, tv_usec=10000}) = 0 (Timeout)
_newselect(1024, [4], [], [], {tv_sec=0, tv_usec=10000}) = 0 (Timeout)
_newselect(1024, [4], [], [], {tv_sec=0, tv_usec=10000}) = 0 (Timeout)
_newselect(1024, [4], [], [], {tv_sec=0, tv_usec=10000}) = 0 (Timeout)
_newselect(1024, [4], [], [], {tv_sec=0, tv_usec=10000}) = 0 (Timeout)
_newselect(1024, [4], [], [], {tv_sec=0, tv_usec=10000}) = 0 (Timeout)
_newselect(1024, [4], [], [], {tv_sec=0, tv_usec=10000}) = 0 (Timeout)
_newselect(1024, [4], [], [], {tv_sec=0, tv_usec=10000}) = 0 (Timeout)
_newselect(1024, [4], [], [], {tv_sec=0, tv_usec=10000}) = 0 (Timeout)
Same behaviour this child thread, endless loop with same message 10 times a second even more:
root@OpenWrt:~# strace -p 2956
strace: Process 2956 attached
restart_syscall(<... resuming interrupted syscall_0x204 ...>) = 0
nanosleep({tv_sec=0, tv_nsec=10000000}, 0x7579fb10) = 0
nanosleep({tv_sec=0, tv_nsec=10000000}, 0x7579fb10) = 0
nanosleep({tv_sec=0, tv_nsec=10000000}, 0x7579fb10) = 0
nanosleep({tv_sec=0, tv_nsec=10000000}, 0x7579fb10) = 0
nanosleep({tv_sec=0, tv_nsec=10000000}, 0x7579fb10) = 0
nanosleep({tv_sec=0, tv_nsec=10000000}, 0x7579fb10) = 0
nanosleep({tv_sec=0, tv_nsec=10000000}, 0x7579fb10) = 0
nanosleep({tv_sec=0, tv_nsec=10000000}, 0x7579fb10) = 0
nanosleep({tv_sec=0, tv_nsec=10000000}, 0x7579fb10) = 0
nanosleep({tv_sec=0, tv_nsec=10000000}, 0x7579fb10) = 0
nanosleep({tv_sec=0, tv_nsec=10000000}, 0x7579fb10) = 0
nanosleep({tv_sec=0, tv_nsec=10000000}, 0x7579fb10) = 0
nanosleep({tv_sec=0, tv_nsec=10000000}, 0x7579fb10) = 0
nanosleep({tv_sec=0, tv_nsec=10000000}, 0x7579fb10) = 0
nanosleep({tv_sec=0, tv_nsec=10000000}, 0x7579fb10) = 0
nanosleep({tv_sec=0, tv_nsec=10000000}, 0x7579fb10) = 0
nanosleep({tv_sec=0, tv_nsec=10000000}, 0x7579fb10) = 0
nanosleep({tv_sec=0, tv_nsec=10000000}, 0x7579fb10) = 0
nanosleep({tv_sec=0, tv_nsec=10000000}, 0x7579fb10) = 0
nanosleep({tv_sec=0, tv_nsec=10000000}, 0x7579fb10) = 0
nanosleep({tv_sec=0, tv_nsec=10000000}, 0x7579fb10) = 0
nanosleep({tv_sec=0, tv_nsec=10000000}, 0x7579fb10) = 0
nanosleep({tv_sec=0, tv_nsec=10000000}, 0x7579fb10) = 0
nanosleep({tv_sec=0, tv_nsec=10000000}, 0x7579fb10) = 0
nanosleep({tv_sec=0, tv_nsec=10000000}, 0x7579fb10) = 0
nanosleep({tv_sec=0, tv_nsec=10000000}, 0x7579fb10) = 0
nanosleep({tv_sec=0, tv_nsec=10000000}, 0x7579fb10) = 0
nanosleep({tv_sec=0, tv_nsec=10000000}, 0x7579fb10) = 0
I didnt check all the threads, just a few, maybe others have similar activity
I have no idea what these all messages means, but that looks to me pretty intense activity for a process that is supposed to be iddle at all (no calls, no registrations no anything, the router not even connected to WAN)