[testers needed] [21.02, snapshot] collectd-exec scripts to collect Lantiq DSL values

Since the process of retrieving DSL values has completely changed between 19.07 and 21.02 and the set of scripts I originally wrote for this purpose will not work anymore ... I completely rewrote it.

Edit: The files moved to a proper Github repository:

2 Likes

Edit: resolved

Get a drill or any motor with brushes and play with it next to the line

I'll wait until the cleaning woman is using the vacuum next time.

  • ubusd needs to be restarted to pick up the amended access control list. There is probably a better/less brutal way to restart ubusd, but I am not aware of it. Suggestions welcome.

/etc/init.d/rpcd reload ?

[OpenWrt Wiki] rpcd: OpenWrt ubus RPC daemon for backend server

This restarts rpcd, but does it restart ubusd?

Installed on 7412 master r17180 .Restarting ubusd seems to be impossible . Large part of the system seems dependant on . I have enable-debug-prints=y and I'm flooded with ''DSL [00]: Rertransmission is not active.'' .Need to disable it as shows nothing useful . My Line doesn't report CRC errors .But have minor SNR fluctuaton and Es reported .Uptime 2day

1 Like

Thank you for testing. That is not exactly how it should be, errors should be equal or larger than errored seconds. So some errors that increase ES are not properly counted or displayed.

I suspect it's the CV/CVP, code violations and preemptive path(?) code violations. As I said in the readme I'm not entirely sure about their meaning and relevance, but I'm already collecting them. On various statistics they usually seem to be lumped in with CRC errors, and if they indeed increase ES, it would be prudent to at least display them alongside CRC errors.

I will update the exec.js definition later today, maybe you can try it and see if it displays the errors alongside the ES.

Edit: Just for illustration, this is why I'm having a hard time judging the errors and errored seconds display. My line simply doesn't have any errors, not a single one in the last 17 days:

So here's mine not exacly perfect line but should be stable . Before reboot more than 30d uptime


ubus dsl :

        "errors": {
                "near": {
                        "es": 4,
                        "ses": 0,
                        "loss": 0,
                        "uas": 59,
                        "lofs": 0,
                        "fecs": 2467,
                        "hec": 0,
                        "ibe": 0,
                        "crc_p": 106,
                        "crcp_p": 0,
                        "cv_p": 10246,
                        "cvp_p": 0
                },
                "far": {
                        "es": 2377,
                        "ses": 557,
                        "loss": 0,
                        "uas": 59,
                        "lofs": 0,
                        "fecs": 392725,
                        "hec": 0,
                        "ibe": 0,
                        "crc_p": 0,
                        "crcp_p": 0,
                        "cv_p": 0,
                        "cvp_p": 0
                }

It's hard to see where the errors come from from one set of values, we need another one after an error has happened. Then we can compare and see where the errors actually happen.

Although the nonzero amount of crc_p on the near side bothers me, those should show up in the graph. I would really like to check if the value is picked up correctly. Can you manually execute
/usr/lib/collectd/exec/exec-lantiqdsl.sh
on the shell and paste the output? It should be a bunch of lines starting with PUTVAL, and the CRC errors should show up there.

Not to worry. Your line may not be "perfect", but 1.2 errored seconds on the near side, and 0.6 on the far side on average per day is damn close. Keep in mind that my "perfect" DSL line is about 8 meters long, from the basement into the first floor above street level, so it's hardly a real world DSL scenario.

So seems nothing is drawn from DSL CRC errors . I see that numbers rising from what it was 2-days ago

root@7412:~# /usr/lib/collectd/exec/exec-lantiqdsl.sh
PUTVAL "7412/exec-lantiqdsl/uptime" N:422578
PUTVAL "7412/exec-lantiqdsl/bitrate-downstream" N:66777000
PUTVAL "7412/exec-lantiqdsl/bitrate-downstream_max" N:54984704
PUTVAL "7412/exec-lantiqdsl/snr-downstream" N:5.300000
PUTVAL "7412/exec-lantiqdsl/bitrate-upstream" N:8565000
PUTVAL "7412/exec-lantiqdsl/bitrate-upstream_max" N:9620000
PUTVAL "7412/exec-lantiqdsl/snr-upstream" N:7.400000
PUTVAL "7412/exec-lantiqdsl/errors-near_es" N:9
PUTVAL "7412/exec-lantiqdsl/errors-near_ses" N:3
PUTVAL "7412/exec-lantiqdsl/errors-near_fecs" N:3490
PUTVAL "7412/exec-lantiqdsl/errors-near_crc" N:267
PUTVAL "7412/exec-lantiqdsl/errors-near_crcp" N:0
PUTVAL "7412/exec-lantiqdsl/errors-near_cv" N:21370
PUTVAL "7412/exec-lantiqdsl/errors-near_cvp" N:0
PUTVAL "7412/exec-lantiqdsl/errors-far_es" N:2381
PUTVAL "7412/exec-lantiqdsl/errors-far_ses" N:557
PUTVAL "7412/exec-lantiqdsl/errors-far_fecs" N:403558
PUTVAL "7412/exec-lantiqdsl/errors-far_crc" N:0
PUTVAL "7412/exec-lantiqdsl/errors-far_crcp" N:0
PUTVAL "7412/exec-lantiqdsl/errors-far_cv" N:0
PUTVAL "7412/exec-lantiqdsl/errors-far_cvp" N:0

Ubus dsl:

        "errors": {
                "near": {
                        "es": 9,
                        "ses": 3,
                        "loss": 0,
                        "uas": 59,
                        "lofs": 0,
                        "fecs": 3490,
                        "hec": 0,
                        "ibe": 0,
                        "crc_p": 267,
                        "crcp_p": 0,
                        "cv_p": 21370,
                        "cvp_p": 0
                },
                "far": {
                        "es": 2381,
                        "ses": 557,
                        "loss": 0,
                        "uas": 59,
                        "lofs": 0,
                        "fecs": 403562,
                        "hec": 0,
                        "ibe": 0,
                        "crc_p": 0,
                        "crcp_p": 0,
                        "cv_p": 0,
                        "cvp_p": 0
                }

Thank you, sometimes what's required is an additional set of eyes to point out one's stupidity. I found the error, and going back, it should have been obvious:

image

The errors are counted, they are just not graphed correctly. Turns out it would have been helpful to spell the word "transform" with an s. :sweat_smile:

Without the transformation (values are multiplied by 86400 to have a meaningful average for days, weeks, months, years) they simply don't show up on a graph that is y-scaled to +/- 200. They were there, you just couldn't see them. :slight_smile:

This points out another problem with time-based display of incidental values: With the transformation, the average is meaningful but the totals value is useless. Without the transformation the totals value is meaningful but the average is useless. Personally I think the totals value is less useful than the average value, so I switched back to not displaying useless totals, because the totals can be read from the DSL status overview anyway.

All in all, the errors and errored seconds output is only illustrative of when the errors happened, but it's not a precise gauge for the values themselves. The most use lies in the display of the SnR values.

I updated the exec.js in the Gist. Thank you for your input and help with testing!

1 Like

Just started testing your newest version yesterday evening, and so far it seems to do what it promises. Thanks!

Sidenote: @stonerl's build I am currently testing also reports the G.INP retransmission counters, and I am contemplating adding another plot for "proto-errors" that could also include these as well as FECs, as all of these are "canary in a coal mine" parameters that indicate potential trouble ahead if the increase suddenly...
(But I agree, there will always be a baseline number of any of those, as by themselves they are no real errors, but just tools to allow for the ISP's targetted bit-error-rate in spite of the rather unsuited medium of telephony lines (which were designed with a ~3HKz bandwidth use in mind and are now pushed to 2.2 MHz (ADSL), 17 MHz (VDSL2), or even 35 MHz (VDSL2 AnnexQ), or even higher with G.fast; I am constantly amazed that all of that is possible at all)).

As mentioned my script is already collecting the FECs, just not displaying them in a graph. I created an "extended exec.js" you could use in place of exec.js, it will have a FEC display:


(The graph is scaled to what I assume to be a "really good line" without much drama.)

In this context, I have not found any reliable information whether "FECS" are FEC seconds (i.e. seconds with FEC correction) or the number of FEC events (i.e., "FECs" as in: plural of "FEC"). At the moment I'm labeling them as "events", but I have the slight suspicion they are actually second values since they come from "line sec counters.". It's just a label, though, with no influence on the actual values.

As for the retransmission counters I am not sure how the JSON library reacts if I try to retrieve a nonexistant value. I assume it just reports a null string which I could normalize to a zero-value on those machines. Will have to experiment.

Also, I'm still a bit puzzled about the "CRCP" (afaics "preemptive CRC"), "CV", "CVP" (afaics "code violations" and "path code violations"), "hec" and "ibe" values. Lots of zero values in my stats, and documentation is, as usual, very sparse on the meaning and relevance of these counters.

P.S.: I'm really curious how the shiny new and improved vectoring drivers work out for you since you have similar problems with Lantiq DSL modems as I have/had on my home line. I wouldn't mind using my spare FritzBox 3370 as a modem if it works out for you.

Excellent, thanks a lot, installed it, and now I am waiting for FEC to actually happen.

I believe that FECS really means seconds with FEC errors and not individual FEC events, but I can not point to any document to support this hypothesis :wink:

I guess I can go and play with this myself using completely made-up variable names?

Ah, no you tickled my curiosity, might try to find some time to dive into the ITU specs (which IMHO are no fun to read/search). It would be interesting to better understand what these are supposed to tell us :wink:

I will report all ups and downs :wink: (I did however clean up my internal wiring since using the HH5A before so the situation is not completely comparable any more, but I do not believe that my instability issue was primaery driven by the error count on the link).

Really? Those should happen all the time ... I tested this though, see my screenshot above, it is working.

What is the retransmission counter value actually named in the output of ubus call dsl metrics?

I DID NO SUCH THING (in public. I'm a gentleman.)

1 Like

This is exactly what happens, no problems there.

1 Like

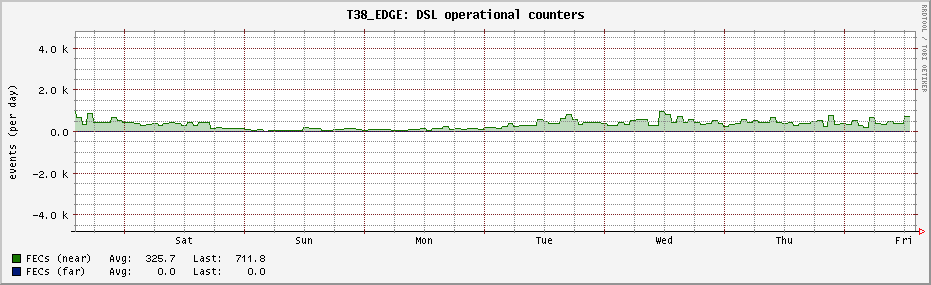
And by now they did ;), with far to little data to make robust estimates I see 3-10 minutes of no FECS... so it is working here as well.

	"errors": {
		"near": {
			"es": 0,
			"ses": 0,
			"loss": 0,
			"uas": 166,
			"lofs": 0,
			"fecs": 0,
			"hec": 0,
			"ibe": 0,
			"crc_p": 0,
			"crcp_p": 0,
			"cv_p": 0,
			"cvp_p": 0,
			"rx_corrupted": 1050,
			"rx_uncorrected_protected": 0,
			"rx_retransmitted": 0,
			"rx_corrected": 1050,
			"tx_retransmitted": 679
		},
		"far": {
			"es": 7,
			"ses": 3,
			"loss": 0,
			"uas": 166,
			"lofs": 0,
			"fecs": 17564,
			"hec": 0,
			"ibe": 0,
			"crc_p": 0,
			"crcp_p": 0,
			"cv_p": 0,
			"cvp_p": 0,
			"rx_corrupted": 220569,
			"rx_uncorrected_protected": 150519,
			"rx_retransmitted": 0,
			"rx_corrected": 70050,
			"tx_retransmitted": 60527
		}
	}

Now, I wonder which of these are actually worth reporting:
it seems that rx_corrupted = rx_uncorrected_protected + rx_corrected, but what is tx_retransmitted or rather why is tx_retransmitted not >= either rx_corrected for any of the two directions...

But looking at this gives:

/**
   Structure for getting statistics counter that are related to retransmission
   functionality.
*/
typedef struct
{
   /**
   This anomaly occurs when a received DTU with detected errors is not corrected
   by the reception of a DTU, i.e. retransmission didn't correct the corrupted
   DTU. The corresponding anomaly counter counts all corrupt DTUs, also idle
   cells in case of ATM-TC.
   \note This parameter is only valid for NEAR-END direction. */
   DSL_OUT DSL_uint32_t nRxCorruptedTotal;
   /**
   This anomaly occurs when a received DTU, eligible for retransmission, with
   detected errors is not corrected by the reception of a DTU with the same
   SID, i.e. retransmission could not correct the to-be-protected corrupted DTU.
   The corresponding anomaly counter counts only corrupt DTUs which belong to
   the user data stream which shall be impulse noise protected by
   retransmission.
   \note This parameter is only valid for NEAR-END direction. */
   DSL_OUT DSL_uint32_t nRxUncorrectedProtected;
   /**
   This anomaly occurs when a received DTU (Data Transfer Unit) is detected to
   be a retransmission of a previous sent DTU.
   \note This parameter is only valid for NEAR-END direction and in case of
         NOT using XWAY(TM) VRX200 or XWAY(TM) VRX300. */
   DSL_OUT DSL_uint32_t nRxRetransmitted;
   /**
   This anomaly occurs when a received DTU with detected errors is corrected by
   the reception of a DTU with the same SID, i.e. a retransmission corrects the
   corrupted DTU.
   \note This parameter is only valid for NEAR-END direction. */
   DSL_OUT DSL_uint32_t nRxCorrected;
   /**
   Counter of retransmitted DTU by the transmitter (rtx-tx): this is a counter
   that is incremented each time a DTU has been retransmitted by the transmitter.
   Multiple retransmission of the same DTU is counted as many times as it has
   been retransmitted. (G.998.4 chapter 12).
   \note This parameter is only valid for FAR-END direction. */
   DSL_OUT DSL_uint32_t nTxRetransmitted;
} DSL_ReTxStatisticsData_t;

it might be that "This parameter is only valid for FAR-END direction." is the most relevant piece of information here...

Then again ITU G.994.4 chapter 12 says:

" 12 DTU counters

For trouble-shooting and testing of the retransmission functionality, three DTU counters are defined to monitor the retransmissions:

  • – counter of uncorrected DTU (rtx-uc): this is a counter that is incremented each time a DTU is detected in error and has not been corrected by one or more retransmissions within the delay_max constraint;
  • – counter of corrected DTU (rtx-c): this is a counter that is incremented each time a DTU has been detected in error and has been successfully corrected by a retransmission;
  • – counter of retransmitted DTU by the transmitter (rtx-tx): this is a counter that is incremented each time a DTU has been retransmitted by the transmitter. Multiple retransmission of the same DTU is counted as many times as it has been retransmitted.Those counters are 32-bit values with wrap-around and shall be maintained by the xTU. They shall be available upon request over the eoc. The counters shall be reset at power-on. The counters shall not be reset upon a link state transition and shall not be reset when read."

My gut-feeling is that they might start out being non-zero somehow and that initial offset might make is hard to see the relevant changes...

Which is probably the same behaviour as all other far "error" counters, they don't zero with a line reset, the far end reports its values it collected over its own uptime. Not to worry, we already handle that with all other error counters, for "error" types collectd automatically only collects differences, not absolutes.

1 Like